1. Background
Considering their increasing prevalence, diabetic foot ulcers (DFU) have become a major complication of diabetes worldwide (1). Many therapeutic options have been developed to facilitate wound closure in DFU. Some studies have investigated the effect of allogenic and autologous cell bases or cell-free therapies. Platelet-rich plasma (PRP) therapy is a cell-free therapy that has been reported to potentially aid in the healing of DFU (2-6).
Platelet-rich plasma is a plasma containing over a thousand bioactive molecules that facilitate regenerative processes, including cell proliferation, migration, and differentiation (7-9). PRP is collected from blood and processed to obtain PRP in approximately two hours (10). PRP can be administered intravenously as long as it is activated (11). To activate PRP, several techniques, such as freeze-thaw and calcium methods, are employed (6). The activation stimulates the cells to secrete bioactive molecules. The bioactive molecules initiate the regeneration of the wound area. To evaluate wound closure, a less invasive technique is required.
Digital image analysis using software is a simple and affordable method for an alternative evaluation. ImageJ was created by the National Institute of Health (USA) (12). ImageJ is an easy-to-use tool that has become popular for analyzing and measuring scientific images. Some users have used ImageJ to perform cell size analysis, histology, and immunohistochemistry (9, 13-16).
2. Objectives
In this study, we used ImageJ to evaluate DFU wound closure after treatment with locally injected aaPRP. The gross DFU image can be analyzed through ImageJ to evaluate wound closure and plot the recovery timeline demonstrated by the percentage of granulation and sloughy tissue.
3. Methods
3.1. Study Design
This study aimed to validate the ImageJ software (National Institute of Health, USA) for the wound healing process in DFU patients. The study was conducted at the Royal Prima Medan Hospital (Medan, North Sumatra, Indonesia). The study protocol was approved by the Health Research Ethics Committee of Universitas Prima Indonesia (No. 016/KEPK/UNPRI/II/2022). The subjects in this study were anonymized, and written informed consent was obtained.
3.2. Blood Collection and aaPRP Isolation
Approximately 24 mL of blood was collected. To separate the plasma, the blood was spun at 1000 rpm. The collected plasma was transferred into two new tubes and spun at 3000 rpm to get the concentrate PRP. The PRP was activated using calcium called autologous-activated PRP (aaPRP). Autologous-activated PRP was injected locally around the DFU and administered intravenously.
3.3. DFU Area
The DFU area needed to be recorded. To measure the DFU area, the images should be calibrated. The “Dash line” must be covered in the wound area. The “Measure option” should be chosen to obtain the data. The data is represented by cm2. The data of three patients were analyzed on days 0, 7, and 14.
3.4. Granulation and Sloughy Area
Granulation and sloughy area measurements were conducted to analyze the wound healing timeline. ImageJ software (National Institute of Health, USA) provides various options to differentiate the granulation or sloughy tissue. In this study, we measured the granulation one, followed by the total width area of DFU. The sloughy tissue area was calculated using these formulae:
3.5. Analysis Data
The representative images are enclosed to demonstrate the steps of the analysis. The ImageJ data are tabulated. The statistical analyses were performed by IBM SPSS version 22.0. A P-value < 0.05 was considered statistically significant.
4. Result and Discussion
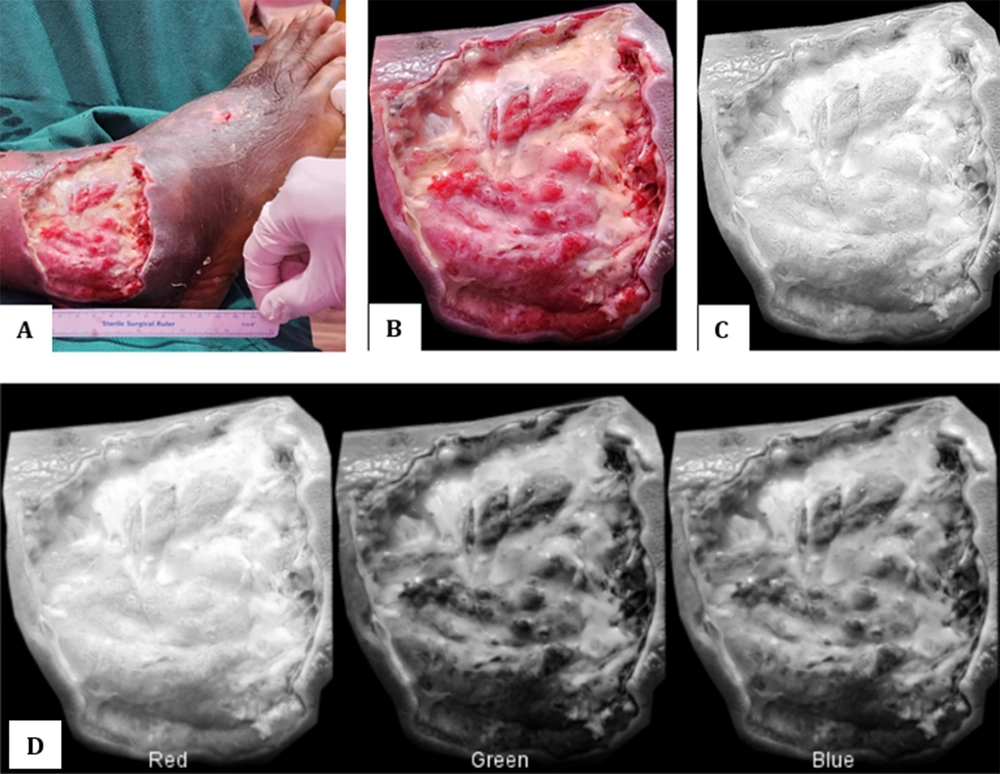
In this study, we recruited three patients with DFU and administered PRP injections to analyze the wounds using ImageJ tools. ImageJ supports the results through images to evaluate the area of DFU and their remodeling process represented by granulation and sloughy tissue. To evaluate the area of DFU, the images should include an instrument such as a ruler to calibrate the data (Figure 1).
The images can be shown in various modes, including color, black and white, red, and montage (RGB) (12). The results facilitate obtaining precise data and demonstrate the DFU healing process. Figure 1 represents day 0 of patient 1 during the healing process. The first aaPRP was injected locally around the wound when images were captured.
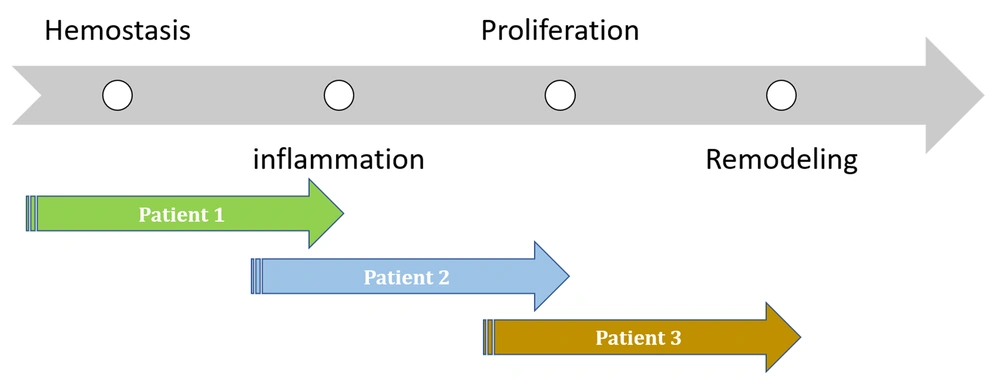
The wound closure was analyzed on days 7 and 14. Administering aaPRP on the local wound area of three patients with DFUs showed that the timeline of the healing process was different, as indicated by the varying sizes of the wound areas (Table 1). These interesting results demonstrated that the wound healing process was not in the same recovery timeline. There are four stages of DFU recovery: Hemostasis, inflammation, proliferation, and remodeling (17). Those results indicated that the aaPRP injection positively affected the DFU recovery timeline.
| No. | Observation (day) | ||
|---|---|---|---|
| 0 | 7 | 14 | |
| 1 | 71.77% | 70.53% | 80.34% |
| 2 | 21.01% | 23.47% | 21.37% |
| 3 | 3.99% | 1.05% | 0.15% |
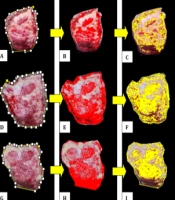
Granulation and sloughy tissue area analysis are shown in Figure 2. ImageJ facilitates image analysis based on color and texture. The different colors in the images showed granulation and sloughy tissue. Granulation has been used as an outcome measure in clinical trials on DFU (18). The granulation part of the tissue is represented in red color (Figure 2B, E and H), followed by the selection area to represent the granulation area (Figure 2C, F and I).
The summarized DFU recovery process is tabulated in Table 2. For complete healing, the tissue must gradually increase the granulation and decrease sloughy tissue. Data obtained from patient 1 indicated that the healing process still needed more time since the result showed that the sloughy tissue area was larger than granulation. Analysis of patient 2 demonstrated that the healing process commenced in the proliferation stage and closed to the final stage of recovery (remodeling). Patient 3 images demonstrated that the remodeling process was initiated and was one stage closer to recovery. The average of granulation and sloughy area data for 14 days of observation showed that the granulation area increased while the sloughy tissue decreased, indicating that the healing process occurred. No significant difference was observed between the granulation processes towards the day of observation (P = 0.691).
| No. | Observation (day) | Healing Process | ||
|---|---|---|---|---|
| 0 | 7 | 14 | ||
| 1 | 50.08% | 54.41% | 44.25% | ↓ Granulation |
| 49.91% | 45.58% | 55.74% | ↑ Sloughy | |
| 2 | 59.27% | 53.92% | 65.33% | ↑ Granulation |
| 40.72% | 46.07% | 34.67% | ↓ Sloughy | |
| 3 | 70.18% | 85.93% | 88.44% | ↑ Granulation |
| 29.82% | 14.07% | 11.56% | ↓ Sloughy | |
| Average | 59.84% | 64.75% | 66.01% | ↑ Granulation |
| 40.15% | 35.34% | 33.99% | ↓ Sloughy | |
The results demonstrated four stages of DFU regeneration: hemostasis, inflammation, proliferation, and remodeling (Figure 3). There were different timelines of wound healing for every patient. These results demonstrated how aaPRP works and why the three patients’ results differed.
4.1. Conclusions
The ImageJ software (National Institute of Health, USA) provided DFU healing process information in those treated by aaPRP based on the DFU level severity.


