
1. Background
Injectable hyaluronic acid (HA) fillers, as temporary dermal fillers, have become the primary non-surgical anti-wrinkle intervention dominating the field of aesthetic medicine (1). These fillers have proven highly effective in reversing facial sagging by restoring lost volume and filling sunken areas, particularly deep (linear) wrinkles (2).
Among the most noticeable and aesthetically significant signs of aging are nasolabial wrinkles or folds (NF). Therefore, the treatment outcome for NF has been widely regarded as a robust criterion for assessing both the effectiveness and durability of different types of HA injectable fillers (3).
Although achieving a more youthful appearance is the primary goal, aesthetic patients also consistently seek natural-looking results (4). To this end, HA fillers have undergone significant modifications to optimize both durability and naturalness (5). These modifications have included cross-linking HA fillers with intermolecular bonds to enhance product stability and delay the degradation of the injected material within the dermal tissue (6). However, an increase in endotoxins accompanies the improved longevity achieved through cross-linking (7). Consequently, various techniques have been developed to minimize the quantity of cross-linking molecules while optimizing the behavior of HA fillers (8).
In light of these developments, HA fillers can be classified as either monophasic or biphasic (8). Monophasic fillers, with their homogeneous structure, linear distribution, and controlled crossover, tend to produce better tissue results than biphasic fillers. Monophasic fillers can further be categorized as monodensified (cross-linking after homogeneous mixing) or polydensified (cross-linking at early separate stages before the final filler production) (9, 10).
The innovations mentioned above are expected to enhance overall aesthetic outcomes. Therefore, it is worthwhile to focus on assessing clinical improvements, long-lasting effects, and subjective satisfaction when comparing monodensified HA fillers to polydensified ones. The present study employed the split-face method, a widely established practice for such comparisons (11).
2. Methods
2.1. Patients
A total of 15 female aesthetic patients voluntarily participated in the study. Female patients were selected because they are recognized as discerning judges of facial beauty and rejuvenation. All participants provided written informed consent after receiving detailed information about the split-face observation method.
The subjects’ ages ranged from 40 to 70 years, with a mean age of 52.4 and a standard deviation (SD) of ± 9.39 years. The exclusion criteria included connective tissue diseases (e.g., lupus erythematosus), blood disorders, and cancer. The use of salicylic acid, vitamin E, Ginkgo Biloba, and anti-inflammatory and anti-platelet drugs was prohibited for 7 days before the application of HA and 15 days before the use of retinoids. Patients with silicone implants in the area of HA application, recent filler applications within the past year, or a predisposition to keloid or hypertrophic scars were also excluded from the study. Chemical peelings or dermabrasion in the injected area were prohibited for at least 2 months after HA application.
Each participating subject’s NF on both sides should have a similar appearance. The selection of the NF on the face side to be treated with the predetermined HA filler was consistently the same to minimize any bias. The untreated NFs had a similar age-related course and severity graded as 4 according to the Wrinkle Severity Rating Scale (WSRS) (12). The participants had a skin phototype of II-III (Fitzpatrick). They all underwent the filler injections as described in the next section. The study was conducted in compliance with Good Clinical Practice and the Declaration of Helsinki, in accordance with Greek law. The study protocol and patient involvement were formally approved by the Local Ethics Committee of Tzaneio General hospital, Piraeus, Greece.
2.2. Improvement of Nasolabial Folds
The outcomes were evaluated using both the WSRS and the Global Aesthetic Improvement Scale (GAIS) methods (12, 13). The technique involved retrograde linear deposition with the same quantity of filler injected into both wrinkles of each subject. Baseline and follow-up photos were taken using a high-resolution camera, with all photographic parameters and settings (e.g., focus mode and file format) kept consistent for each subject. Furthermore, every study participant was asked to remain expressionless during the picture-taking process.
2.3. Comparison of Hyaluronic Acid Molecule
In all cases, the right NFs were treated with the established HA filler consisting of monophasic, polydensified molecules; nevertheless, the left NFs were treated with the investigational HA filler with a molecular basis made up of monophasic monodensified ultrafine multi-spheres, following the innovative S.C.E.D.I.S.TM method depicted in Figure 1. The initial selection was randomized, and the primary goal of the comparison was to investigate whether the monophasic monodensified HA product outperforms the monophasic polydensified one.
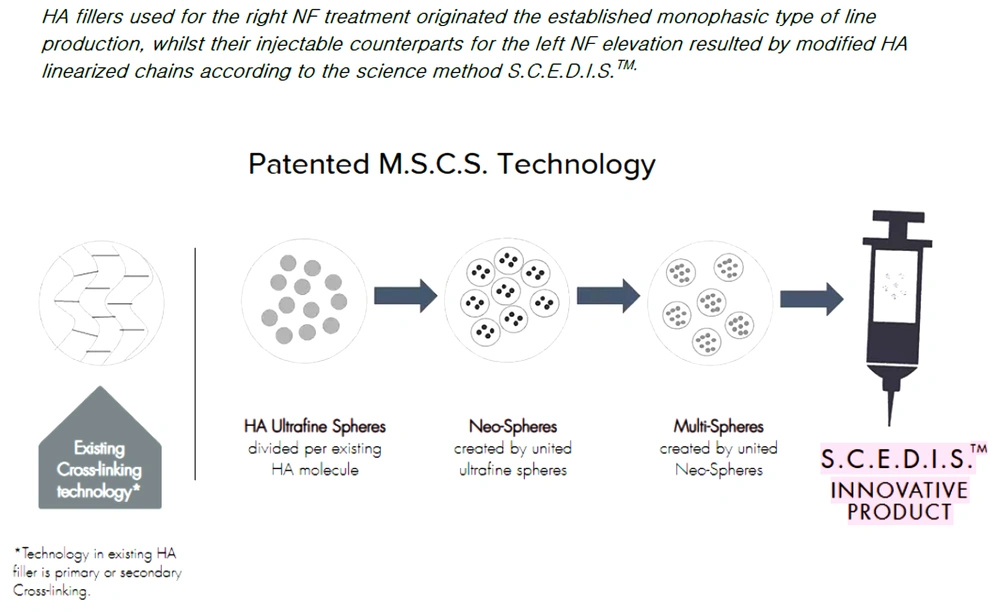
Figure 1.
Hyaluronic acid (HA) fillers used for the right nasolabial folds (NF) treatment originated the established the monophasic type of line production despite their injectable counterparts for the left NF elevation resulting from modified HA linearized chains according to the science method S.C.E.D.I.STM
2.4. Duration of the Result
The subjects were photographed before, immediately after, and at 1, 6, and 12 months after the HA injections. Wrinkle depth values were assigned based on both the clinical aspect and photographic comparisons, following the referenced methodology (14).
2.5. Statistical Analysis
Statistical analysis was conducted using Friedman’s analysis of variance (ANOVA), followed by post-hoc Wilcoxon signed ranks tests with Bonferroni adjustment and Mann-Whitney U tests, following widely established methods (15). The FACE-Q scale and checklists, used to assess the subjects’ feeling of naturalness, were employed using the methodology shown in Table 1 (16). The FACE-Q scale is based on a psychometric study that ensures the inclusion of only the most clinically sensitive items while examining reliability and validity with patients.
Table 1.
Content of the FACE-Q Scales and Checklists
| Variables | Very Dissatisfied | Somewhat Dissatisfied | Somewhat Satisfied | Very Satisfied |
|---|---|---|---|---|
| 1. How does your facial skin look at the end of your day? | 1 | 2 | 3 | 4 |
| 2. How healthy does your facial skin look? | 1 | 2 | 3 | 4 |
| 3. How attractive does your facial skin make you look? | 1 | 2 | 3 | 4 |
| 4. How smooth does your facial skin look? | 1 | 2 | 3 | 4 |
| 5. How clear does your facial skin (complexion) look? | 1 | 2 | 3 | 4 |
| 6. How refreshed does your facial skin make you look? | 1 | 2 | 3 | 4 |
| 7. How hydrated does your facial skin look? | 1 | 2 | 3 | 4 |
| 8. How does your facial skin look when you first wake up? | 1 | 2 | 3 | 4 |
| 9. How radiant does your facial skin look? | 1 | 2 | 3 | 4 |
| 10. How does the tone (color) of your facial skin look? | 1 | 2 | 3 | 4 |
| 11. How do your pores look? | 1 | 2 | 3 | 4 |
| 12. How even-colored does your facial skin look? | 1 | 2 | 3 | 4 |
3. Results
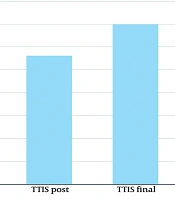
Figure 2 shows the most typical cosmetic outcomes, clearly demonstrating optimal aesthetic results. In all cases, NFs were almost not visible, leaving minimal linear remnants. The statistical analysis supported this, as shown by the overall reduction in WSRS scores in Figure 3A-C (MP: Monophasic polydensified, MM: Monophasic monodensified) at baseline and at 1, 6, and 12 months after filler application. There was a statistically significant difference in the WSRS scores from baseline to every subsequent assessment, whether the sample was considered a whole or each side separately (P < 0.001 for a = 0.05). However, both sides showed almost identical and significant improvements in the WSRS score. The mean score decreased from the baseline score of 4.40 by 1.77 units at the end of the first month, eventually reaching a mean score of 2.50 at the end of the final assessment 12 months later (P < 0.001 for a = 0.0083).
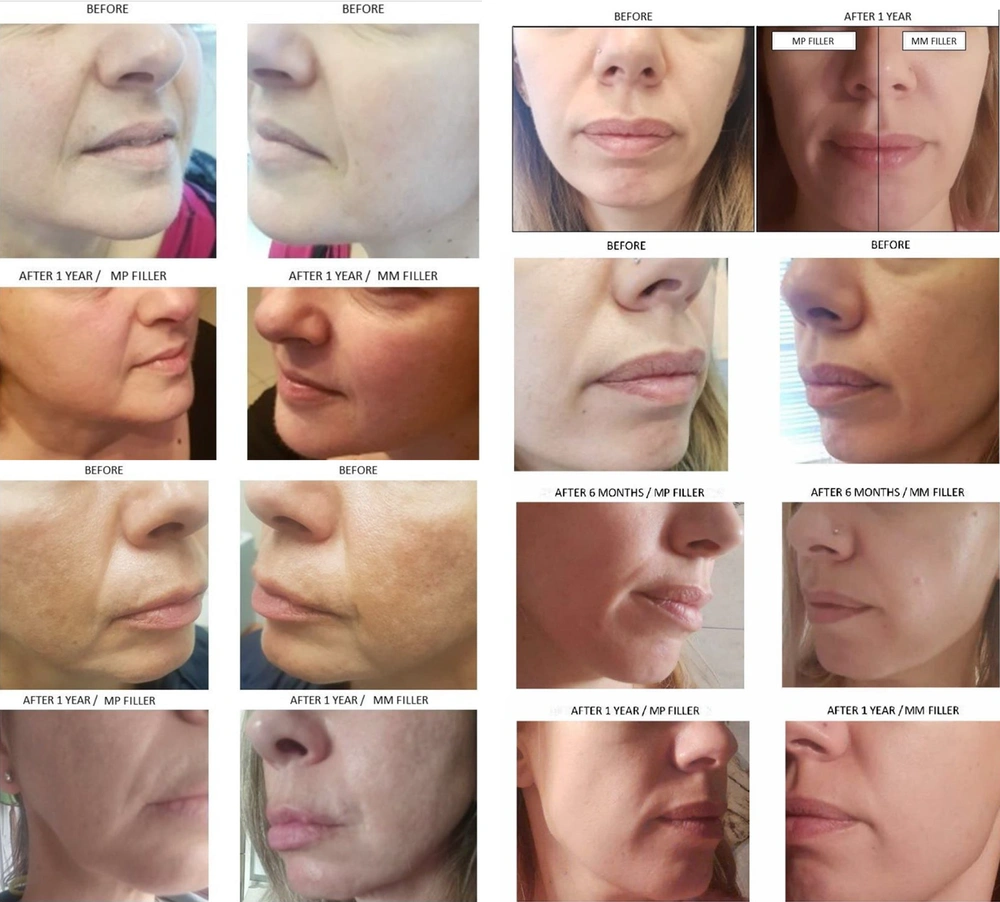
Figure 2.
Random case citations depicting a noticeable and time-sustained cosmetic result in both nasolabial folds (NFs), indifferently of the hyaluronic acid (HA) used type
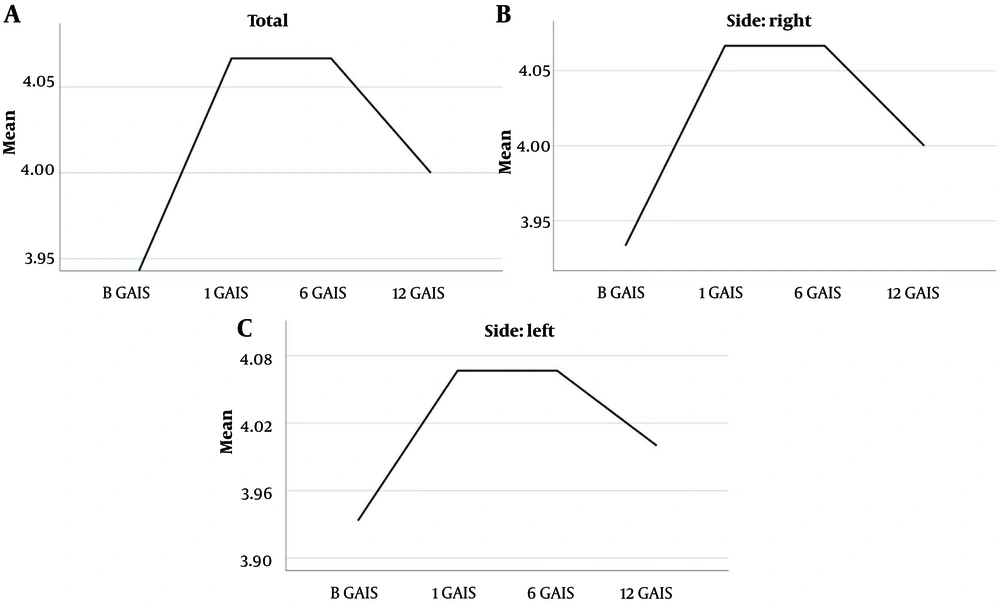
Figure 3.
A statistically significant difference between the measurements of the baseline and every following measurement is independent of whether the sample is tested as a whole or each side is tested separately (P < 0.001 for a = 0.05). A, Overall reduction of Wrinkle Severity Rating Scale (WSRS) after filler application; B, Reduction of WSRS after filler application on the right side; C, Reduction of WSRS after filler application on the left side
In addition, the statistics based on the GAIS score demonstrated a similar cosmetic response for both sides, as shown in Table 2. By this method, it was tested whether the sample, both as a whole and each of the slides individually, had a significant improvement on the GAIS scale and how well this was maintained over the course of 12 months. Friedman’s ANOVA test did not reject the null hypothesis for the sample as a whole (n = 30), suggesting that the improvement observed in the baseline measurement remained consistent over the course of one year (P = 0.300 for a = 0.05).
Table 2.
Descriptive Statistics for Global Aesthetic Improvement Scale Scores
| Variables | No. | Mean ± SD | Minimum | Maximum |
|---|---|---|---|---|
| B GAIS | 30 | 4.00 ± 0.00 | 4 | 4 |
| 1 GAIS | 30 | 4.07 ± 0.25 | 4 | 5 |
| 6 GAIS | 30 | 4.07 ± 0.25 | 4 | 5 |
| 12 GAIS | 30 | 4.03 ± 0.32 | 3 | 5 |
Abbreviation: GAIS, Global Aesthetic Improvement Scale.
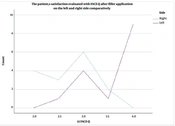
Based on the FACE-Q questionnaire results, as analyzed previously, a bar chart was created (Figure 4), illustrating that MM HA fillers strongly outperformed the MP ones in terms of aesthetic patients' feelings of naturalness. The X-axis represents the two sides, and the Y-axis represents satisfaction with the HA application, graded from 2 to 4 (2: Somewhat dissatisfied - blue block, 3: Somewhat satisfied - green block, 4: Very satisfied - yellow block). The subcategories are a result of the median function used to calculate the FACE-Q variable from the 10 items and occur between 2 categories: 2.5: Red block and 3.5: Orange block. The overall conclusion strongly supports the subjects’ feelings of naturalness after NF filling with monophasic monodensified HA product. In addition to the bar chart, a line chart also represented the number of cases for each side in each category of the FACE-Q variable, as shown in Figure 5. The “x” axis presents the number of cases, and the “y” axis presents the values taken by the FACE-Q variable. Statistical significance was evident between the 2 groups when comparing the measurements at 12 months (P = 0.01). This leads to the conclusion that patients perceived a noticeable difference in the natural feeling between the two sides of their faces. Furthermore, statistical significance was evident and is clearly shown in Figure 5. It was demonstrated that the left side injected offered a more “comfortable feeling” than the right one (P < 0.01).
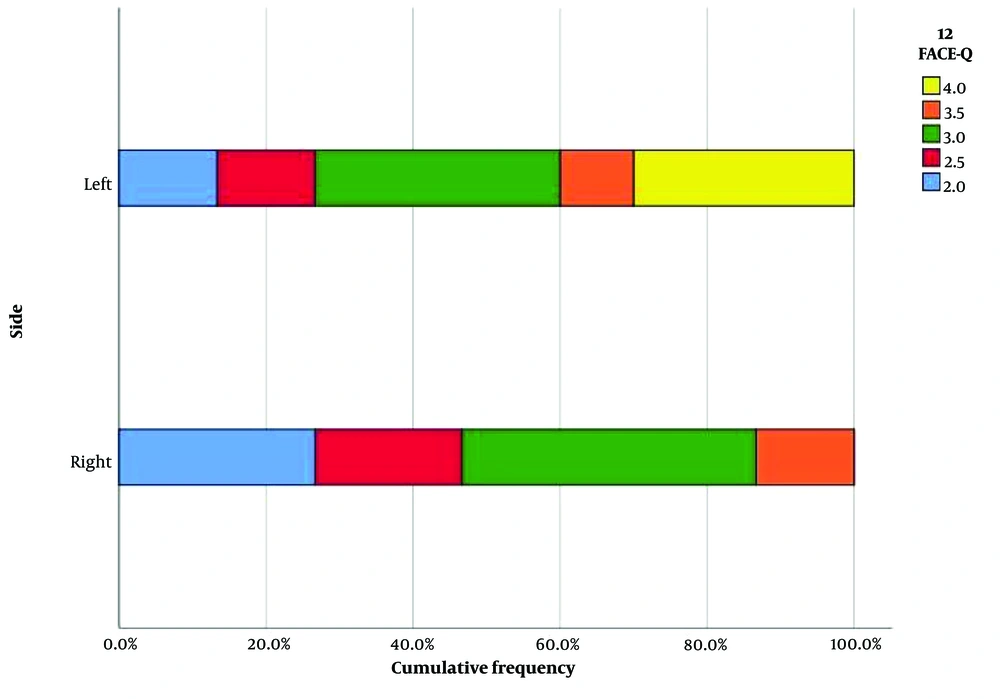
Figure 4.
Cumulative frequency bar chart for the FACE-Q variable presenting the stacked frequencies of the medians of each category for the 2 sides
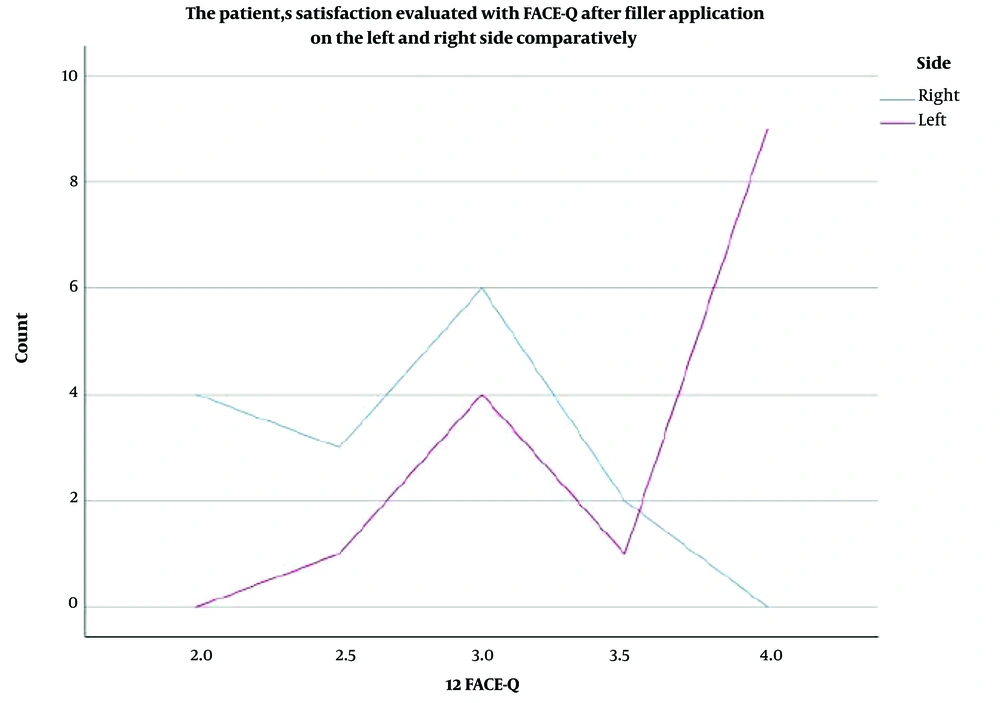
Figure 5.
Patient’s satisfaction was evaluated with FACE-Q after filler application on the left and right sides comparatively
4. Discussion
In the present study, both HA injectables have demonstrated similar effectiveness in terms of aesthetic outcomes and long-lasting effects while maintaining a safe profile of use. The aesthetic improvements were evident in the photos taken during the follow-up observations (at 1 month, 6 months, and 12 months), and these improvements were statistically supported by the WSRS and GAIS methods (P > 0.05). This outcome aligns with previous data that consistently report that similar concentrations of HA products yield comparable injectable results in terms of wrinkle depth reduction, regardless of whether they are biphasic or monophasic in composition.
In line with the above-mentioned finding, it appears that, in this study, the long-lasting effect is not significantly affected by differences in composition (5). Therefore, it was confirmed that whether the investigated monophasic HA products were monodensified or polydensified had little impact on aesthetic results and durability. The primary factors influencing the optimized outcome seem to be the physician’s technique and the injected quantity. Using the same quantity under the same injector led to nearly identical results, as expected (17, 18). However, when dealing with aesthetic practice, patient satisfaction should be a primary consideration. This aspect was addressed using the FACE-Q questionnaire (15). In this regard, the results decisively favored the monodensified HA products in terms of subjective feelings of naturalness (P < 0.05). Furthermore, all patients expressed intense satisfaction compared to their baseline appearance (P < 0.001).
All subjects reported that although there were no obvious signs of skin irregularities in both injected wrinkles, they experienced a sensation of intracutaneous tension in the left NF, which was not present in the right one (treated with the polydensified molecule). Additionally, they unanimously expressed a preference for the monodensified product when considering future cosmetic HA injection procedures. However, it is important to note that there are some limitations to this study, particularly related to the subjectivity of the answers (the content of the FACE-Q questionnaire was subjective). Future studies with larger sample sizes and more objective data collection methods might provide further insights. Nonetheless, the unanimous preference of patients for the monodensified product, which they found to be more compatible with a natural feeling, strongly supports the adoption of the studied modified HA injectable product in everyday common aesthetic clinical practice. The results observed in this study might be worth further investigation in larger-scale studies.