


1. Background
Adolescence is the period of physical, psychological, and social maturation, shifting from childhood to adulthood. Adolescents comprise around 20.0% of the total population of the world. During adolescence, the attainment of the most favorable growth is essential to maintain good health (1). Nutritional needs are the greatest during adolescence, and dietary patterns have a strong effect on lifetime nutritional status and health. Adolescents in developed and developing countries have recently experienced severe health issues due to the lack of a balanced death nutritional status (2, 3).
Adolescents in developing countries have encountered many nutritional problems such as under-nutrition, which would affect their growth spurt as well as their health (4, 5). In many African countries, the nutritional status of adolescents results from chronic under-nutrition associated with deficiencies in muscular strength and working capacity (6). Although the prevalence of undernutrition is today decreasing, overweight and obesity are becoming more prevalent among adolescents (7). As key predictors in adulthood, overweight and obesity are associated with severe health problems, such as diabetes mellitus, hypertension, cerebrovascular disease, atherosclerotic coronary heart disease, colorectal cancer, from all causes, and lower educational attainment (8, 9).
A study conducted in the southern part of Nigeria reported a 13.0% prevalence rate of underweight and was found to be influenced by residence and income levels (10). Another similar study was conducted in rural and urban areas in Enugu, and the prevalence rate of thinness was 13.9% (11). Furthermore, a study in Kano reported an overall underweight prevalence of 60.6% with a higher prevalence among boys (63.0%) than girls (58.7%) (12). Underweight is more prevalent among boys because they engage in more physically demanding activities (12, 13).
Globally, around 10.0% of the adolescents are overweight, varying from 10.0% in Africa and Asia to more than 20.0% in the USA and Europe (2, 14). Another study in southern Nigeria reported the prevalence rate of overweight and obesity as 11.4% and 2.8% (10). Another study from the southern part of Nigeria found 22.0% and 49.3% overweight and obesity, respectively (15).
2. Objectives
Literature reveals that there was limited information focusing on the nutritional status of adolescent girls, especially in the north-eastern part of Nigeria, which is a matter of concern. This study aimed to investigate the nutritional status of adolescent girls in the selected secondary school in the north-eastern part of Nigeria.
3. Methods
3.1. Study Design and Setting
This study employed a cross-sectional survey conducted at Government Girls Special Secondary School, Kafin-Madaki, Ganjuwa local Government area, Bauchi state of Nigeria. Adolescent girls studying in senior secondary class 1 - 3 (SS 1 - 3), who were available and voluntarily agreed to participate in this study were included and those who were sick or declined to participate were excluded from participation.
3.2. Data Collection
The study team first collected the list of adolescent students from the school authority, which then was used as a sampling frame. Via a systematic sampling technique, the study procedure considered one in every five students from the list resulting in a sample of 250 adolescent girls. The systematic sampling technique was handy for the study because it allowed the study team to cover all adolescent students from the list available easily. A nutrition expert accompanied by an epidemiologist gathered anthropometric information and measured the height, weight, and body mass index (BMI) calculation of the participants. The BMI was calculated as weight in kg divided by height in m squared. The BMI categories used are as follows: Underweight (BMI < 18.5 kg/m2); Normal weight (BMI ≥ 18.5 to 24.9 kg/m2); Overweight (BMI ≥ 25 to 29.9 kg/m2); Obese (BMI ≥ 30 kg/m2) (16).
Dietary habits of the participants were reported based on their usual food habits putting a particular emphasis on the food taken during the last four weeks. Written informed consent was taken first from the concerned authority to have access to official information in the school. Both the teachers and the participants (students) considered the participation without any pressure, and required information was given to the interviewers. All the participants (students) were given the consent form to sign before starting the data collection. After obtaining their consent, data were collected using a self-administered semi-structured questionnaire that included age, residence, mother’s educational status, father’s occupation, monthly family income, and dietary and eating habits.
In order to maintain the validity and reliability of the instrument and tools used; a modified standard questionnaire used in a similar study conducted in Ethiopia was adapted to collect the dietary habit related variables (17).
3.3. Ethical Approval
This study was approved by the Research Ethics Committee of Daffodil International University, Dhaka, Bangladesh. Written consent from concerned authority and the adolescent girls were obtained before data collection. The anonymity and confidentiality of the participants were strictly maintained.
3.4. Data Analysis
After data collection, all interviewed questionnaires were checked for completeness, correctness, and internal consistency to exclude missing or inconsistency in data. The data was analyzed using a Statistical Package for Social Sciences (SPSS) Ver-20. Pearson chi-square test was performed to explore the association between the socio-demographic characteristics, dietary habits and eating habits, and nutritional status of the adolescent girls. A P value of less than 0.05 was considered statistically significant.
4. Results
4.1. Socio-Demographic Characteristics of the Participants
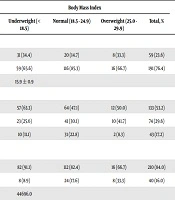
Table 1 shows that the mean age of the adolescent girls was 15.9 ± 0.9 years, and the majority (76.4%) of the adolescent girls aged 16 years and above. The body mass index was significantly associated with the age of the adolescent girls (P < 0.001). More than half (53.2%) of the adolescent girls were senior secondary class 1 (SS-1). The class of the students was significantly associated with body mass index (P = 0.007). The mean family monthly income of the participants was 44,696 Naira, which was statistically associated with their BMI (P < 0.001). Around three-fifths (59.2%) of the fathers of our participants were service holders (government and private). Father’s occupation was also significantly associated with the BMI of the adolescent girls (P < 0.001). It is also evident that the great majority (98.4%) of the participants’ mothers had secondary and above education, and the mothers’ educational level was found statistically associated with their BMI (P < 0.001). Close to seven-tenths (68.8%) of the adolescent girls were living in rural areas. The adolescent girls’ residence had a significant association with their BMI (P < 0.001).
| Variables | Body Mass Index | χ2b | P Value | |||
|---|---|---|---|---|---|---|
| Underweight (< 18.5) | Normal (18.5 - 24.9) | Overweight (25.0 - 29.9) | Total, % | |||
| Age, y | 1.214 | < 0.001 | ||||
| ≤ 15 | 31 (34.4) | 20 (14.7) | 8 (33.3) | 59 (23.6) | ||
| ≥ 16 | 59 (65.6) | 116 (85.3) | 16 (66.7) | 191 (76.4) | ||
| Mean ± SD | 15.9 ± 0.9 | |||||
| Class of the student | 21.234 | 0.007 | ||||
| SS 1 | 57 (63.3) | 64 (47.1) | 12 (50.0) | 133 (53.2) | ||
| SS 2 | 23 (25.6) | 41 (30.1) | 10 (41.7) | 74 (29.6) | ||
| SS 3 | 10 (11.1) | 31 (22.8) | 2 (8.3) | 43 (17.2) | ||
| Family monthly income, Naira | 76.990 | < 0.001 | ||||
| ≤ 41000 | 82 (91.1) | 112 (82.4) | 16 (66.7) | 210 (84.0) | ||
| ≥ 42000 | 8 (8.9) | 24 (17.6) | 8 (33.3) | 40 (16.0) | ||
| Mean | 44696.0 | |||||
| Father’s occupation | 59.347 | < 0.001 | ||||
| Job holder | 44 (48.9) | 84 (61.8) | 20 (83.3) | 148 (59.2) | ||
| Business | 46 (51.1) | 52 (38.2) | 4 (16.7) | 102 (40.8) | ||
| Mother’s educational level | 86.252 | < 0.001 | ||||
| ≤ Primary | 18 (20.0) | 20 (14.7) | 0 (0.0) | 4 (1.6) | ||
| ≥ Secondary | 72 (80.0) | 116 (85.3) | 24 (100) | 246 (98.4) | ||
| Residence | 18.258 | < 0.001 | ||||
| Urban | 31 (34.4) | 47 (34.6) | 0 (0.0) | 78 (31.2) | ||
| Rural | 59 (65.6) | 89 (65.4) | 24 (100) | 172 (68.8) | ||
Distribution of The Participants’ BMI According to Socio-Demographic Characteristics (N = 250)a
4.2. Nutritional Status of the Participants
Table 2 shows that more than half (54.4%) of the adolescent girls had normal body weight, followed by underweight (36.0%), and overweight (9.6%). The mean height of the adolescent girls was 1.5 m, the mean weight was 45.9 kg, and the mean BMI was recorded 19.9 kg/m2.
| Values | |
|---|---|
| BMI level | |
| Underweight (< 18.5) | 90 (36.0) |
| Normal (18.5 - 24.9) | 136 (54.4) |
| Overweight (25.0 - 29.9) | 24 (9.6) |
| Height, m | 1.5 ± 8.9 |
| Weight, kg | 45.9 ± 7.8 |
| BMI, kg/m2 | 19.9 ± 4.1 |
Distribution of the Participants According to Their Body Mass Index (N = 250)a
4.3. Association between Body Mass Index and Dietary Habits of the Participants
Table 3 reported that around half (49.2%) of the participants consumed coffee more than twice a week, and the coffee consumption was significantly associated (P < 0.001) with their BMI. It also shows that 78.4% of the participants consumed rice more than twice a week. The consumption of rice was not significantly associated (P = 0.242) with their BMI. About 28.4% of the participants consumed soft drinks more than 2 times a week, and consuming soft drinks was significantly associated (P < 0.001) with their BMI. More than eight-tenths (88.8%) of the participants consumed milk/milk products at least ≤ 2 in a week, and it was significantly associated (P = 0.024) with BMI of the adolescent girls. The majority (84.4%) of the participants took red meat at least ≤ 2 in a week. Taking red meat was significantly associated (P < 0.001) with their BMI. More than half (55.2%) of the participants consumed vegetables and fruits more than twice a week, and a significant association was found (P = 0.002) with their BMI.
| Variables | Body Mass Index | χ2b | P Value | |||
|---|---|---|---|---|---|---|
| Underweight (< 18.5) | Normal (18.5 - 24.9) | Overweight (25.0 - 29.9) | Total, % | |||
| Coffee/week | 38.291 | < 0.001 | ||||
| ≤ 2 times | 40 (44.4) | 83 (61.0) | 4 (0.0) | 127 (50.8) | ||
| > 2 times | 50 (55.6) | 53 (39.0) | 20 (100) | 123 (49.2) | ||
| Rice/week | 14.997 | 0.242 | ||||
| ≤ 2 times | 16 (17.7) | 38 (27.9) | 0 (0.0) | 54 (21.6) | ||
| > 2 times | 74 (82.3) | 98 (72.1) | 24 (100) | 196 (78.4) | ||
| Soft drinks/week | 36.920 | < 0.001 | ||||
| ≤ 2 times | 58 (64.4) | 97 (71.3) | 24 (100) | 179 (71.6) | ||
| > 2 times | 32 (35.6) | 39 (28.7) | 0 (0.0) | 71 (28.4) | ||
| Milk/milk/week | 17.671 | 0.024 | ||||
| ≤ 2 times | 80 (88.9) | 118 (86.7) | 24 (100) | 222 (88.8) | ||
| > 2 times | 10 (11.1) | 18 (13.3) | 0 (0.0) | 28 (11.2) | ||
| Red meat/week | 69.350 | < 0.001 | ||||
| ≤ 2 times | 65 (72.2) | 122 (89.7) | 24 (100) | 211 (84.4) | ||
| > 2 times | 25 (27.8) | 14 (10.3) | 0 (0.0) | 39 (15.6) | ||
| Vegetables and fruits/week | 24.139 | 0.002 | ||||
| ≤ 2 times | 41 (45.5) | 59 (43.4) | 12 (50.0) | 112 (44.8) | ||
| > 2 times | 49 (54.5) | 77 (56.6) | 12 (50.0) | 138 (55.2) | ||
Association Between Body Mass Index and Dietary Habits of The Participants (N = 250)a
4.4. Association between Body Mass Index and Eating Habits of the Participants
Table 4 shows that most (84.8%) of the participants took lunch regularly, and it was significantly associated (P < 0.001) with BMI. More than nine-tenths (91.6%) of the adolescent girls took breakfast regularly, and it was significantly associated (P < 0.001) with their BMI. More than three-fifths (62.8%) of the participants were snacking between lunch and supper, and it had a significant association (P < 0.001) with their BMI. Close to seven-tenths (68.8%) of the adolescent girls were snacking between breakfast and lunch, and it was not significantly associated with their BMI (P = 0.610). Little above four-fifths (80.8%) of the adolescent girls used to eat during school, which was significantly associated with their BMI (P = 0.003).
| Variables | Body Mass Index | χ2 b | P Value | |||
|---|---|---|---|---|---|---|
| Underweight (< 18.5) | Normal (18.5 - 24.9) | Overweight (25.0 - 29.9) | Total, % | |||
| Eat lunch regularly | 19.736 | < 0.001 | ||||
| Yes | 85 (94.4) | 103 (75.7) | 24 (100) | 212 (84.8) | ||
| No | 5 (5.6) | 33 (24.3) | 0 (0.0) | 38 (15.2) | ||
| Eating breakfast regularly | 13.152 | < 0.011 | ||||
| Yes | 86 (95.6) | 123 (90.4) | 20 (83.3) | 229 (91.6) | ||
| No | 4 (4.4) | 13 (9.6) | 4 (16.7) | 21 (8.4) | ||
| Snacking between lunch and supper | 24.318 | < 0.001 | ||||
| Yes | 40 (44.4) | 41 (30.1) | 12 (50.0) | 93 (37.2) | ||
| No | 50 (55.6) | 95 (69.9) | 12 (50.0) | 157 (62.8) | ||
| Snacking between breakfast and lunch | 2.695 | 0.610 | ||||
| Yes | 26 (28.9) | 44 (32.4) | 8 (33.3) | 78 (31.2) | ||
| No | 64 (71.1) | 92 (67.6) | 16 (66.7) | 172 (68.8) | ||
| Eat from the school canteen | 23.386 | < 0.001 | ||||
| Yes | 46 (51.1) | 71 (52.2) | 0 (0.0) | 117 (46.8) | ||
| No | 44 (48.9) | 65 (47.8) | 24 (100) | 133 (53.2) | ||
| Eating during school | 16.381 | 0.003 | ||||
| Yes | 75 (83.3) | 103 (75.7) | 24 (100) | 202 (80.8) | ||
| No | 15 (16.7) | 33 (24.3) | 0 (0.0) | 48 (19.2) | ||
Association Between Body Mass Index and Eating Habit of The Adolescent Girls (N = 250)a
5. Discussion
This is the first study in the region to distinctively illustrate the nutritional status of adolescent girls. The study highlighted the nutritional status of adolescent girls based on their socio-economic status, dietary pattern, food taking, frequencies, and regularity. These factors had a positive effect on determining the nutritional status regardless of age-specific tendency. This study can provide the baseline information for policymakers, researchers, national and international agencies to understand similar scenarios in a broader context and help adopt necessary interventions.
In the study above, half of the adolescent girls had normal body weight, while a one-third of them were underweight, and below one-tenths were overweight. Previous studies reported that about half of the students were within normal weight, while more than one fourth were underweight (18, 19). This finding was consistent with a study conducted in the north-western part of Nigeria, which found 63.4% of the adolescents had healthy-weight, 29.0% were undernourished (BMI < 18.5 kg/m2), while 5.4% were overweight and 2.2% were obese (20). However, another study documented among the selected schools in the south-south region of Nigeria found a higher proportion of normal weight (85.0%) and a lower proportion of underweight (21). A study conducted among nursing students reported that most of them were in the normal weight category; however, about one-fourths were overweight, and the rest were underweight and obese (22). This finding is inconsistent with our study, which may be due to the willingness of nursing students to keep their weight within the normal range. The findings of this study are consistent with another study conducted among the university students in Rwanda, where almost all students had normal weight, but there was a reasonably high occurrence of overweight among the students (23).
The BMI was significantly associated with the class of the study. However, according to the World Health Organization (WHO) project report, years of schooling are inversely associated with BMI (24). In the questionnaire, respondents were asked to state the educational level of their parents; however, there may be a little information bias. A similar study did not directly point out the association between awareness, nutritional practices, and parental educational level; nevertheless, as it reported, the students having parents with lower educational levels had lower BMI in comparison to adolescents with parents having higher educational levels (25). Data from a previous survey showed a higher prevalence of obesity in low educated men and women than high educated ones (26).
A great majority of the participants consumed milk/milk products twice or less in a week, and it was significantly associated with their BMI. Similarly, a study reported that milk and dairy products were the best sources of calcium (27). Most participants took red meat at least twice or less in a week, and a significant association was observed with their BMI. This is, however, in contrast with the findings of another study reporting daily consumption of bodybuilding and protective foods by an adolescent was practically non-existent in the study area (28).
Vegetables and fruits are an essential part of a healthy diet. In our study, there was a significant association between the BMI of the adolescents' girls and consuming vegetables and fruits more than twice a week. The finding was in agreement with a study stating that vitamins and minerals such as calcium, iron, and iodine must be included in adolescents’ diets, and the best sources of vitamins are fruits and vegetables (27). Another study conducted in America reported that the consumption of fruits and vegetables daily could significantly help to sustain the adolescent girls with expected BMI (29). Our findings revealed that more than 90.0% of the adolescent girls in this study took breakfast regularly, and a significant association was reported with their BMI. A similar study conducted in Georgia reported that about 62.0% of the girls with normal BMI had breakfast regularly (13).
5.1. Limitations of the Study
The present study encountered some limitations. First, it was conducted among the students of a selected school. Thus, the extent to which the findings can be extrapolated to other parts of the country deserves careful consideration. Besides, the dietary habits of the participants were reported based on their usual food habits emphasizing on the food taken during the last four weeks that may possess some recall bias in responses.
5.2. Conclusions
According to the finding, more than one-third of the adolescent girls were underweight, and few were overweight and obese. Socio-demographic characteristics such as age, monthly family income, mothers’ educational status. Living areas had a highly significant association with the BMI of adolescent girls. Consumption of coffee, soft drinks, milk, and milk products, red meat, vegetables, and fruits was also significantly associated with their existing BMI. Furthermore, the BMI of the adolescent girls was significantly associated with lunch regularly, breakfast regularly, snacking between lunch and supper, and eating during school. Health education programs concentrating dietary habits and regularity in food intake among adolescent girls should be encouraged by both Government and Non-Governmental Organizations (NGOs) targeting girls in rural areas.
