


1. Background
The Global Burden of Disease 2010 Study estimated that low back pain (LBP) is among the top 10 diseases and injuries accounting for the highest number of disability-adjusted life years (DALYs) worldwide (1). According to Bello and Halima (2), the 12-month prevalence of LBP was 32.5%-73.5% in Nigeria.
The role of pathological and symptom variations in paraspinal muscle morphology remains ambiguous. It is reported that patients with chronic LBP have smaller paraspinal muscles (3) and more fatty infiltration than healthy asymptomatic subjects with LBP (4), contradictory with the results of another study (5). A reduction in the cross-sectional area (CSA) and deposition of fat in lumbar multifidus (LM) muscles was observed in patients with unilateral LBP, and these morphological changes were localized to the suspected pathological spinal level and symptomatic side (4, 6); however, the findings were not consistent in all studies (7, 8).
A magnetic resonance imaging (MRI)-based study demonstrated a significant multifidus asymmetry in a group of male patients without LBP (6) and asymptomatic elite athletes (9, 10). Studies on individuals with and without LBP reported atrophy and fatty infiltration of LM (11, 12), all inconsistent. Most of these citations had a small sample size, inadequate qualitative assessment of LM, and lack of examiner blinding (13). Although a high body mass index (BMI) is associated with high fatty infiltration of LM, few studies examined the effect of physical activity and body adiposity on fatty infiltration of LM among the blacks.
2. Objectives
Due to a high prevalence of overweight and obesity among blacks, especially Nigerians (14), the current study aimed at investigating the effect of physical activity level (PAL) and body adiposity on fatty infiltration of LM among apparently healthy black Africans.
3. Methods
The current cross-sectional study employed a disproportionate stratified sampling technique. The study protocol was approved by the Ethics Committee of Kano State Hospital Management Board (ethical code; MOH/OFF/797/TI/1308). Participants who were on medication or treatment for both specific and non-specific LBP, those who received LM training in the past year, individuals undergoing surgery, those with spinal deformities, functional limitations due to medical conditions, or contraindications for ultrasound/sonography were excluded. Informed consent was obtained from the participant. The study sample size was determined based on the cross-sectional study sample size formula (15). With a standard deviation of 1.96 and population proportion of 0.81, based on the previous study (11), the sample size was determined236. However, a total of 196 participants were enrolled in the study (response rate: 83.1%).
3.1. Measurements
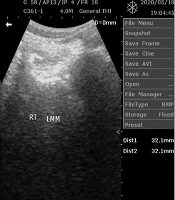
The PAL, LM morphology, weight, waist and hip circumferences (WC, HC), and height were measured for all the participants using the international physical activity questionnaire (IPAQ) with validity and reliability with ICC ranging 0.58-0.90 (16), diagnostic ultrasound, Tanita Ironman digital weighing scale (TANITA BC-549 plus IRONMANR, Tanita Corp., Tokyo, Japan), valid in assessing body weight and adiposity (17), tape measure, and stadiometer (Upsurge Medical Stadiometer ZT-120, England), respectively. The procedures for real-time ultrasound imagery, and reliability, are reported in the literature (Figure 1) (18-20).

Lumbar Multifidus
3.2. Data Analysis
Descriptive statistics were used to determine the prevalence of fatty infiltration of LM and analyze the demographic characteristics of the participants. For ease of analysis, the age range was categorized into three groups of young (18-35 years), middle-aged (36-65 years), and older (> 66 years) adults. Fat infiltration of the lumbar muscle multifidus (LMM) was visually graded using the standard criteria as follows: normal for estimates of 0%-10% fat, slight for 10%-50% fat, and severe for > 50% fat within the muscle (11). Inferential statistics of paired samples t-test was used to determine the gender difference in the infiltration of LMM. Spearman correlation coefficient was used to determine the association between PAL and lumbar multifidus CSA, and fat infiltration adjustments were made for age, gender, BMI, and the waist-hip ratio. Multiple regression analysis was performed to determine the predictors of infiltration of LMM, followed by hierarchical multiple regression analysis after controlling the sociodemographic (i e, gender, age, and level of education) variables. The sociodemographic and clinical variables were used for regression analysis. All analyses were performed using SPSS version 20.0 at a significance level of α = 0.05.
4. Results
A total of 196 participants were enrolled in the current study (response rate: 83.1%), of which 125 (63.8%) were male, 113 (57.7%) married, 106 (55.1%) young adults, 60 (30.6%) employed, and 92 (46.9) attended tertiary education, as shown in Table 1.
| Valuesa | |
|---|---|
| Gender | |
| Male | 125 (63.8) |
| Female | 70 (36.2) |
| Age, yr | 36.2 ± 14.8 |
| Young adult | 106 (55.1) |
| Middle-aged adult | 72 (36.7) |
| Old adult | 16 (8.2) |
| Marital Status | |
| Married | 113 (57.7) |
| Single | 80 (40.8) |
| Divorce | 1 (0.5) |
| Separated | 2 (1.0) |
| Occupation | |
| Employed | 60 (30.6) |
| Unemployed | 41 (20.9) |
| Self-employed | 93 (47.4) |
| Retired | 2 (1.0) |
| Educational Level | |
| No formal education | 9 (4.6) |
| Primary school | 15 (7.7) |
| Secondary school | 80 (40.8) |
| Tertiary education | 92 (46.9) |
Sociodemographic Characteristics of the Participants
The mean ± standard deviation (M ± SD) of BMI, WHR, PAL, and percentages of fatty infiltration, visceral fat, and whole-body fat were 24.40 ± 5.73 kb/m2, 0.88 ± 0.09, 2652.87 ± 3366.88, 22.24% ± 11.98%, 5.67% ± 4.3%, and 22.23% ± 11.98%, respectively. There were gender differences in BMI (P < 0.001), WHR (P < 0.001), WC (P < 0.005), and percentage of whole-body fat (P < 0.001). In addition, 79 (40.3%) subjects had a slight fatty infiltration (male > female) and 180 (91.8%: male>female) a normal visceral fat (Table 2).
| Male, N = 125 | Female, N = 70 | Mean ± SD | P | Total, N = 196 | |
|---|---|---|---|---|---|
| BMI | 24.40 ± 5.73 | 0.001 | |||
| Underweight | 17 (13.6) | 8 (11.3) | 25 (12.8) | ||
| Normal weight | 70 (56.0) | 20 (28.2) | 90 (45.9) | ||
| Overweight | 27 (21.6) | 20 (28.2) | 47 (24.0) | ||
| Obese | 11 (8.8) | 23 (32.4) | 34 (17.3) | ||
| WHR | 0.88 ± 0.09 | 0.001 | |||
| Low risk | 103 (82.4) | 20 (28.2) | 123 (62.75) | ||
| Moderate risk | 20 (16.0) | 15 (21.1) | 35 (17.86) | ||
| High risk | 2 (1.6) | 36 (50.7) | 38 (19.39) | ||
| PAL | 2652.87 ± 3366.88 | 0.008 | |||
| High | 45 (23.0%) | 20 (10.2%) | 65 (33.2) | ||
| Moderate | 47 (24.0%) | 23 (11.7%) | 70 (35.7) | ||
| Low | 34 (17.3%) | 27 (14.3%) | 61 (31.1) | ||
| % Fat Infiltration | 9.83 ± 1.72 | 0.085 | |||
| Normal | 77 (39.3) | 40 (20.4) | 117 (59.7) | ||
| Slight | 48 (24.5) | 31 (15.8) | 79 (40.3) | ||
| WC | 84.23 ± 13.42 | 0.005 | |||
| Visceral Fat | 5.67 ± 4.3 | 0.242 | |||
| Healthy level | 117 (93.6) | 63 (88.7) | 180 (91.8) | ||
| Excess level | 8 (6.4) | 8 (11.3) | 16 (8.2) | ||
| % Body Fat | 22.24 ± 11.98 | 0.001 |
Clinical Variables of the Participants
There were positive correlations between fatty infiltration of LMM and age (r = 0.237, P = 0.001), level of education (r = 0.197, P = 0.006), and marital status (r = 0.198, P = 0.005). There was a correlation between fatty infiltration of LMM and visceral fat (r= 0.519, P = 0.001) but no correlation between fatty infiltration of LMM and WC (r= 0.091, P = 0.206), WHR (r = 0.095, P = 0.811), percentage of whole-body fat (r = 0.049, P = 0.495), and BMI (r = 0.017, P = 0.811). Though not among the primary objectives of the study, there were negative correlations between PAL and WC (r = -0.299, P = 0.001), WHR (r = -0.143, P = 0.046), percentage of whole-body fat (r = -0.355, P = 0.001) and BMI (r = -0.315, P = 0.001) (Table 3).
| Pal | Age | Gender | Educational Level | Marital Status | Occupational Status | WHR | WC | Visceral Fat | %Body Fat | |
|---|---|---|---|---|---|---|---|---|---|---|
| Age, yr | 1 | |||||||||
| r | -0.128 | |||||||||
| P Value | 0.073 | |||||||||
| Gender | 1 | |||||||||
| r | -0.171 | 0.104 | ||||||||
| P Value | 0.016 | 0.148 | ||||||||
| Educational Level | 1 | |||||||||
| r | -0.03 | 0.002 | -0.07 | |||||||
| P Value | 0.679 | 0.981 | 0.33 | |||||||
| Marital Status | 1 | |||||||||
| r | -0.122 | 0.692 | 0.243 | 0.037 | ||||||
| P Value | 0.09 | 0 | 0.001 | 0.605 | ||||||
| Occupational Status | 1 | |||||||||
| r | 0.113 | -0.143 | -0.008 | -0.462 | -0.085 | |||||
| P Value | 0.114 | 0.045 | 0.907 | 0 | 0.237 | |||||
| WHR | 1 | |||||||||
| r | -0.143 | 0.370 | -0.329 | 0.003 | 0.264 | -0.039 | ||||
| P Value | 0.046 | 0 | 0 | 0.97 | 0 | 0.586 | ||||
| WC | 1 | |||||||||
| r | -0.299 | 0.539 | 0.204 | 0.076 | 0.554 | -0.161 | 0.571 | |||
| P Value | 0 | 0 | 0.004 | 0.293 | 0 | 0.024 | 0 | |||
| Visceral Fat | 1 | |||||||||
| r | -0.002 | 0.285 | 0.083 | 0.042 | 0.251 | -0.075 | 0.03 | 0.089 | ||
| P Value | 0.0975 | 0 | 0.246 | 0.559 | 0 | 0.297 | 0.673 | 0.216 | ||
| % Body Fat | 1 | |||||||||
| r | -0.355 | 0.449 | 0.609 | 0.022 | 0.492 | -0.146 | 0.138 | 0.767 | 0.065 | |
| P Value | 0 | 0 | 0 | 0.763 | 0 | 0.042 | 0.053 | 0 | 0.363 | |
| Total Fat Infiltration | ||||||||||
| r | -0.013 | 0.237 | 0.08 | 0.197 | 0.198 | -0.107 | 0.095 | 0.091 | 0.519 | 0.049 |
| P Value | 0.858 | 0.001 | 0.265 | 0.006 | 0.005 | 0.135 | 0.185 | 0.206 | 0 | 0.495 |
The Relationship Between Fatty Infiltration of Lumbar Muscle and Sociodemographic and Anthropometric Variables
4.1. Correlates of Fatty Infiltration of LMM
The result of the linear regression analysis of data showed that the total variance explained by all the variables in the model was 39.3%, F (13,195) = 9.594, R2 = 40.7%, and P < 0.001, which was significant. In the final model, the contribution of each of the variables making up the model indicated that gender (beta = 0.342, R2 = 0.015, P = 0.001), age (beta = 0.192, R2 = 0.038, P = 0.021), level of education (beta = 0.163, R2 = 0.028, P = 0.016), percentage of whole-body fat (beta = -0.465, R2 = 0.001, P = 0.010), and visceral fat (beta = 0.540, R2 = 0.335, P = 0.001) significantly predicted fatty infiltration of LMM. Despite all these, the percentage of visceral fat (beta = 0.557, R2 = 0.335, P = 0.001), with the largest contribution to the model, was the best predictor of fatty infiltration of LMM in the current study (Table 4). Hierarchical multiple regression analysis was performed by controlling gender, age, and level of education, after the assessment of the normality of variables. Three predictors (gender, age, and level of education) were entered into the first step of hierarchical multiple regression analysis. This model was significant (F (3, 195) = 6.69, P = 0.001)), and the variance explained 95% of the fatty infiltration of LMM. At the end of the second model, the total variance explained by the model as a whole was 38% (F (11,195) = 10.263, P < 0.001)). In the final model, gender (beta = 0.126, P = 0.030), level of education (beta = 0.169, P = 0.014), and visceral fat percentage (beta = 0.540, P < 0.001) made a significant contribution to the model, with a higher beta value for visceral fat (Table 5).
| Dependent Variable | Gender | Age, yr | Level of Education | %Body Fat | Visceral Fat | ||||||||||
|---|---|---|---|---|---|---|---|---|---|---|---|---|---|---|---|
| B | 95%CI for β | P Value | B | 95%CI for β | P Value | B | 95%CI for β | P Value | B | 95%CI for β | P Value | B | 95%CI for β | P Value | |
| Fatty Infiltration of Lumbar Multifidus | 1.394 | 0.582-2.206 | 0.001 | 0.029 | 0.005-0.054 | 0.021 | 0.4 | 0.076-0.724 | 0.016 | -0.076 | -0.116 | 0.01 | 0.255 | 0.198-0.312 | 0.001 |
Predictors of Fatty Infiltration of Lumbar Multifidus
| R | R2 | R2 Change | B | SE | β | t | |
|---|---|---|---|---|---|---|---|
| Step 1 | 0.0308 | 0.095 | 0.095 | ||||
| Gender | 0.521 | 0.282 | 0.128 | 1.847 | |||
| Age | 0.033 | 0.011 | 0.219 | 3.146 | |||
| Level of education | 0.527 | 0.171 | 0.215 | 3.076 | |||
| Step 2 | 0.617 | 0.380 | 0.286 | ||||
| Gender | 0.678 | 0.311 | 0.166 | 0.03 | |||
| Age | 0.019 | 0.012 | 0.126 | 0.118 | |||
| Level of education | 0.414 | 0.166 | 0.169 | 0.014 | |||
| Marital status | -0.261 | 0.296 | -0.071 | 0.38 | |||
| Occupational status | -0.023 | 0.15 | -0.011 | 0.877 | |||
| WC | -0.007 | 0.021 | -0.046 | 0.743 | |||
| WHR | 3.169 | 2.681 | 0.11 | 0.239 | |||
| Visceral fat | 0.247 | 0.028 | 0.540 | 0 | |||
| BMI | -0.012 | 0.038 | -0.036 | 0.746 | |||
| PAL | 0.026 | 0 | 0 | 0.997 | |||
| %body fat | -0.066 | 0.07 | -0.057 | 0.352 |
The Results of Hierarchical Multiple Regression Analysis
5. Discussion
The current study results showed positive relationships between fatty infiltration of LM and age, level of education, and marital status. A positive relationship was also observed between fatty infiltration of LM and visceral fat. An inverse relationship was found between PAL and WC, WHR, percentage of whole-body fat, and BMI. The predictors of fatty infiltration of LMM were age, gender, level of education, and percentages of whole-body fat and visceral fat, while gender, level of education, and percentage of visceral fat were the predictors of fatty infiltration of LMM, and percentage of visceral fat the best predictor. A high prevalence of fatty infiltration is also reported in previous studies on patients with LBP and healthy controls (13). More than half of the participants had a normal fatty infiltration of LMM, with about 40.3% demonstrating high fat infiltration. The majority of the participants had normal or slight fatty infiltration of LMM as no participant fell within the range above 50%, similar to previous studies (11, 13). In the current study, the prevalence of slight fatty infiltration of LM was higher in females than males (39.2% vs. 34.2%); consistent with findings of previous studies (8, 11). It could be concluded that adults with asymptomatic LBP have normal fatty infiltration of LM, unlike those with LBP, and that it is more common in females.
Kjaer et al., (11) reported that age could affect fatty infiltration of LM, and it is more common among older people (13), similar to the findings of the current study. However, no association was reported between anthropometric variables and the CSA of LMM in a study with a small sample size (19). There was a positive relationship between fatty infiltration of LM and the level of education and marital status. To the best of authors` knowledge, there is a lack of studies on the relationship between fatty infiltration of LM and level of education and marital status. Earlier studies showed a relationship between weight gain, educational level, marital status, and fatty infiltration of LM (20, 21).
There was a positive relationship between fatty infiltration of LM and visceral fat, but no relationships with WC, WHR, percentage of whole-body fat, and BMI. Crawford et al., (8) also reported no association between fatty infiltration of LM and BMI, while Menezes-Reis et al., (22) reported an association between it and height, weight, and BMI, contrary to the current study finding. The limitation of the study by Menezes-Reis et al., (22) was in the age group (20-40 years) recruited. The current study showed a positive relationship between visceral fat and fatty infiltration of LM, which to the best of the authors` knowledge, was the first of its kind. Motta et al., (23) reported no relationship between abdominal fat and multifidus fat percentage in males (r = -0.405, P = 0.169) and females (r = 0.287, P = 0.234). Their study had few limitations, including the small sample size (n = 32) and young adult recruitment. The current study sample size was larger (n = 196) and included individuals of 18 years and above.
The majority of the study participants had normal fatty infiltration of LM, with the mean ± SD of 9.83 ± 1.72, which was lower than that of a study from other settings (22). The predictors of fatty infiltration of LM were age, gender, level of education, percentage of whole-body fat, and visceral fat; gender, level of education, and visceral fat were predictors after controlling for certain sociodemographic variables. Individuals with large visceral fat are prone to have fatty infiltration of LM, as observed in the current study, which is in line with previous studies (24, 25).
5.1. Limitations
The current study findings should be interpreted with caution as they do not provide causative factors for LBP. Functional tests should be performed in future studies to assess the PAL of the participants, and more sophisticated equipment, such as MRI/computed tomography scan, should also be used.
5.2. Conclusion
The current study results showed that the majority of participants had normal fatty infiltration of LM, and there were positive relationships between fatty infiltration of LM and age, level of education, marital status, and visceral fat. The presence of visceral fat was the best predictor of fatty infiltration of LM in the study.
