1. Background
Fear of movement is considered one of the most important factors which can affect chronic pain and disability development (1). Several instruments, including questionnaires, are used to measure the fear of movement. Two valid questionnaires for this purpose are available, named the Fear-Avoidance Belief Questionnaire and the Tampa Scale of Kinesiophobia (TSK) (1). The TSK has been used for various disorders, such as low back pain (LBP), neck pain, Parkinson’s disease, chronic fatigue syndrome, temporomandibular joint injuries, cardiovascular diseases, and post-surgery issues (2-6). Regarding the fear of movement, the original version of the TSK developed in English includes a 17-item measurement of this disorder in individuals suffering from musculoskeletal conditions (7, 8). In addition to the 17-item version, some investigations modified the scale to 4 (9), 11 (10, 11), and 13 (12) items based on their study objectives.
Since each English-language questionnaire should be translated and validated for use in other countries, the translated versions of the TSK are available in numerous languages (13-15). There is a Persian version based on the TSK-17 the psychometric characteristics of which have been evaluated in patients with LBP (16), chronic pain (17), and neck pain (15). Askary-Ashtiani et al.’s study was carried out on patients with neck pain, assessing acceptable reliability and validity for evaluating fear of pain and fear-avoidance beliefs among populations with acute and chronic neck pain (15). Rahmati et al.’s study included a wide range of patients with chronic pain (17). Therefore, it is difficult to determine for which patients’ group this tool has acceptance validity and reliability.
Another study completed in 2010 focused on a wide variety of populations with LBP (16). On the other hand, non-specific low back pain (NSLBP) accounts for over 90% of individuals and is not attributed to a recognizable known specific pathology (18). However, to the best of our knowledge, no relevant study has been conducted on NSLBP.
2. Objectives
The present study primarily aimed to assess the reliability and domain (factor) aspect of the construct validity of the Persian version of the TSK on subjects with NSLBP. Different statistical methods were also used to emphasize the value of each of the TSK items. Additionally, this study evaluated the factor validity referred to the construct validity for the current work; nevertheless, Jafari et al. (16) studied the convergent validity and the discriminant validity. The secondary objective was to determine whether introducing a modified version of this questionnaire was possible.
3. Methods
3.1. Participants
This cross-sectional study evaluated the existing data of 295 subjects with NSLBP within the age range of 20-70 years in the chronic phase referring to physiotherapy clinics in Tehran, Iran. All the subjects provided informed consent before the beginning of the study. The individuals were included in this study if they had NSLBP (i.e., LBP with a non-defined pathology) and continuing pain for at least three months checked by a specialist physician. The patients with severe lumbar radiculopathy or other conditions, such as tumors, fractures, pregnancy, spondylolisthesis, or a history of spinal surgery, were excluded from the study. The Persian version of the TSK-17 systematically translated and validated from the original language in Jafari et al.’s study 16) was used for data collection. The participants were asked to score each item on a 4-point Likert scale, rating 1 (strongly disagree) to 4 (strongly agree). Higher scores indicated higher levels of fear of movement-related pain (19).
3.2. Statistical Analyses
Cronbach’s alpha was utilized to assess the internal consistency, and item-scale analysis using Spearman’s correlation coefficient was performed to evaluate the adequacy of the items (variables). Mardia’s coefficients were applied to judge the multivariate normal distribution of the items (Mardia’s coefficient = 79.86). The elliptical theory estimations were also conducted according to the presence of kurtosis (normalized estimation = 26.98).
Exploratory factor analysis (EFA) was conducted to investigate the dimensional construct of the questionnaire. For the confirmation of EFA, confirmatory factor analysis (CFA) or structural equation modeling was also performed to check the appropriateness of the extracted factors and the construct validity. The diagonal elements of the anti-image correlation matrix, which contains the measures of sampling adequacy for the items, were utilized to decide whether some items should be kept or removed (alpha > 0.9). A value close to 1 indicates that the item is appropriate and remains in the model; however, a small value shows that the item is inadequate and should be removed.
The Chi-square is divided by the degrees of freedom (χ2/df), the goodness of fit index (GFI), the confirmatory fit index (CFI), and the root mean square error of approximation (RMSEA) were also utilized as the goodness-of-fit criteria. A χ2/df < 3, GFI and CFI > 0.88, and RMSEA < 0.07 (with lower and upper bounds of the 90% confidence interval (CI) < 0.1) were considered the appropriate levels. Data analysis was performed in SPSS software (version 18; SPSS Inc., released 2009; PASW Statistics for Windows, Chicago, USA), AMOS software (version 20), and EQS software (version 6.2) (20-22).
4. Results
Of the 295 patients with NSLBP, 146 (49.5%) and 149 (50.5%) patients were female and male, respectively. The second and third columns of Table 1 show the statistical indices of different TSK items for these subjec ts. Spearman’s correlation coefficients between all the items were positive and significant (P < 0.001). The lowest correlation coefficient of 0.332 was observed between items 1 and 4. Moreover, the highest correlation coefficient of 0.695 was observed between items 13 and 15.
| Items | Mean ± SD | Scale Mean if Item Deleted | Scale Variance if Item Deleted | Corrected Item-Total Correlation | Cronbach’s Alpha if Item Deleted |
|---|---|---|---|---|---|
| T1 | 2.39 ± 1.15 | 41.10 | 200.26 | 0.685 | 0.946 |
| T2 | 2.15 ± 1.13 | 41.34 | 200.17 | 0.698 | 0.946 |
| T3 | 2.62 ± 1.11 | 40.88 | 200.71 | 0.700 | 0.946 |
| T4 | 2.94 ± 1.11 | 40.55 | 201.93 | 0.656 | 0.946 |
| T5 | 2.39 ± 1.23 | 41.11 | 198.43 | 0.691 | 0.946 |
| T6 | 2.43 ± 1.24 | 41.06 | 197.09 | 0.724 | 0.945 |
| T7 | 2.99 ± 1.19 | 40.51 | 199.97 | 0.667 | 0.946 |
| T8 | 2.65 ± 1.22 | 40.84 | 200.35 | 0.640 | 0.947 |
| T9 | 2.57 ± 1.22 | 40.93 | 197.98 | 0.710 | 0.945 |
| T10 | 2.91 ± 1.17 | 40.59 | 199.25 | 0.705 | 0.946 |
| T11 | 2.06 ± 1.22 | 41.43 | 198.01 | 0.712 | 0.945 |
| T12 | 2.87 ± 1.15 | 40.62 | 199.95 | 0.694 | 0.946 |
| T13 | 2.62 ± 1.24 | 40.87 | 196.50 | 0.742 | 0.945 |
| T14 | 2.22 ± 1.21 | 41.28 | 197.59 | 0.733 | 0.945 |
| T15 | 2.62 ± 1.15 | 40.87 | 197.49 | 0.776 | 0.944 |
| T16 | 2.53 ± 1.17 | 40.97 | 199.56 | 0.698 | 0.946 |
| T17 | 2.53 ± 1.25 | 40.97 | 197.57 | 0.705 | 0.946 |
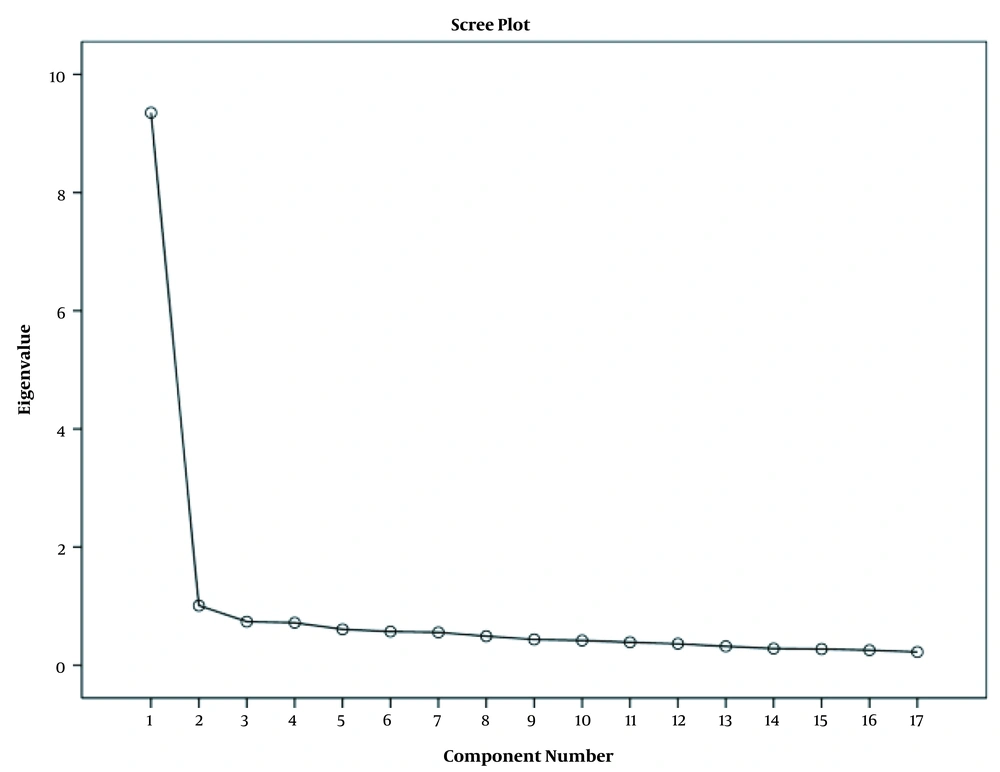
The EFA was performed by extracting the factors using Eigenvalues > 1. The Kaiser-Meyer-Olkin value for this analysis was 0.956, and Bartlett’s test was significant (χ2 = 3154.9; df = 136; P < 0.001). Accordingly, the two extracted factors accounted for 61% of the total variance (Figure 1).
Table 2 shows factor loadings greater than 0.3 (23, 24) after Varimax rotation. Based on Table 2, items 1, 2, 5, 6, 11, 13, 14, 15, 16, and 17 were included in the first factor. Furthermore, items 3, 4, 7, 8, 9, 10, and 12 belonged to the second factor. The factor loadings of item 10 were 0.661 and 0.406 for the second and the first factors, respectively. In addition, based on experience, clinical application, and similarity of items, item 10 appeared in the first subscale and was accordingly moved. Consequently, the first factor with 11 items (i.e., 1, 2, 5, 6, 10, 11, 13, 14, 15, 16, and 17) was considered the fear-of-movement factor, and the second factor with 6 items (i.e., 3, 4, 7, 8, 9, and 12) was considered the beliefs factor.
| Items | Fear of Movement | Beliefs | Measures of Sampling Adequacy |
|---|---|---|---|
| T14 | 0.802 | 0.949 | |
| T1 | 0.759 | 0.947 | |
| T11 | 0.720 | 0.323 | 0.957 |
| T13 | 0.693 | 0.394 | 0.939 |
| T5 | 0.683 | 0.333 | 0.971 |
| T2 | 0.682 | 0.344 | 0.942 |
| T17 | 0.648 | 0.393 | 0.967 |
| T15 | 0.636 | 0.504 | 0.961 |
| T6 | 0.604 | 0.470 | 0.969 |
| T16 | 0.567 | 0.471 | 0.963 |
| T4 | 0.850 | 0.925 | |
| T12 | 0.341 | 0.718 | 0.949 |
| T7 | 0.349 | 0.672 | 0.956 |
| T10 | 0.406 | 0.661 | 0.956 |
| T8 | 0.347 | 0.634 | 0.958 |
| T3 | 0.438 | 0.617 | 0.947 |
| T9 | 0.464 | 0.602 | 0.969 |
Regarding the diagonal elements of the anti-image correlation matrix, the minimum value of these coefficients was 0.925. Therefore, no candidate items were excluded. Then, the internal consistency of the questionnaire was evaluated using Cronbach’s alpha shown in columns 4 to 7 of Table 1. The coefficients were 0.949, 0.931, and 0.971 for the entire questionnaire, the 11-item fear-of-movement factor, and the 6-item belief factor, respectively, indicating the excellent reliability of the questionnaire in alpha > 0.9 (25). Regarding the existence of inappropriate items evaluated using Cronbach’s alpha, the reliability coefficient was not significantly increased by deleting any items. The correlations between the items and the total score of the questionnaire were evaluated by the corrected item-total correlation, all of which were positive and significant. Therefore, all the items were considered appropriate, and no item was selected for deletion.
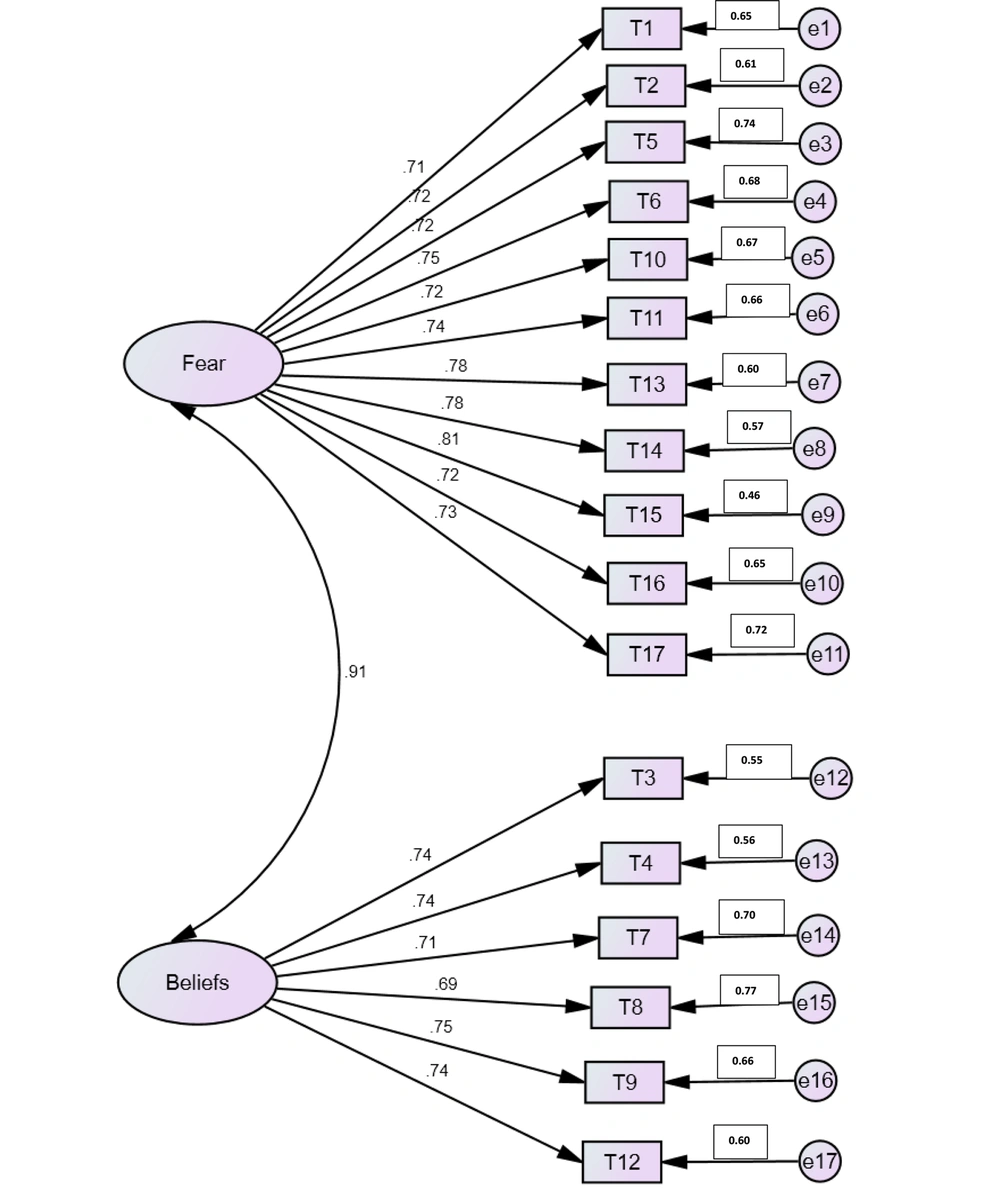
The CFA for this questionnaire was assessed with these two factors. Figure 2 illustrates the results of CFA. The goodness-of-fit indices for this factor analysis model were GFI=0.882, RMSEA = 0.066 (90% CI: 0.055-0.076), CFI = 0.983, and χ2/df = 2.27. These coefficients confirmed the two-factor structure of the instrument.
5. Discussion
The evidence suggests that a high percentage of acute musculoskeletal injuries tend to become chronic which is mainly caused by the fear-avoidance behaviors of patients (1). The TSK is a valid and reliable tool to measure the fear of movement, and its psychometric properties have been assessed in different studies (2, 3). There is currently a Persian version of the TSK for which test-retest reliability, internal consistency, discriminant validity, and convergent validity have been assessed in patients with chronic pain (17), LBP (16), and neck pain (15). In the present study, the internal consistency and the factor validity of this version were evaluated using Cronbach’s alpha, EFA, and CFA for patients with NSLBP. Furthermore, the appropriateness of the items in two factors and the possibility of their deletion were also assessed with the diagonal elements of the related anti-image correlation matrix.
In the majority of the studies examining the psychometric factors of this questionnaire, 10 out of 17 were items usually loaded on the first factor (i.e., activity avoidance) and 7 items on the second factor (i.e., somatic focus) (2, 7, 8, 26). This structure was also confirmed with the findings of the current study. However, because item 10 clinically and logically belonged to the fear domain and represented the fear-of-movement feature, this item was moved to the first domain. Statistical methods and indices established this approach, and excellent reliability and validity were obtained with this new structure. Therefore, the first and second factors consisted of 11 and 6 items, respectively (Figure 2).
In this study, no items were observed for the elimination, indicating that it is impossible to present a modified version of the TSK. Therefore, it is recommended to use the complete Persian version of the TSK for future studies. The findings of this study are consistent with the results of previous studies in which two factors, including activity avoidance and somatic focus, were obtained for this questionnaire (3, 10), providing a reasonable enough fit for the data. These findings provide support for measuring the fear of movement using the TSK-17 in the populations with NSLBP.
In addition to the 17-item version, some investigations worked on short-form versions of the TSK based on their study objectives, such as the TSK-11 used for subjects with shoulder pain (2) and chronic pain (10), the TSK-4 used for subjects with chronic musculoskeletal pain (12), and the TSK-4 used for subjects following spinal surgery (9). The aforementioned investigations revealed the positive results of the short-form versions of the TSK on their patients. The present study utilized a 17-item version in subjects with NSLBP and confirmed its excellent reliability and validity. Nevertheless, Gregg et al. reported that the TSK was not considered an appropriate screening tool for predicting pain and functional outcomes following the rehabilitation of individuals with LBP (4). However, it should be noted that patients in both acute and chronic phases were included as the sample group that might affect this finding in the aforementioned study (4). Nevertheless, the present study included only individuals in the chronic stage of LBP.
One of the limitations of the current study was that the sample group included LBP in only the chronic phase. Further studies are required to clarify whether similar results are obtained for LBP subjects in the acute phase.
5.1. Conclusion
The findings of the present study revealed that the Persian version of the TSK has high validity and reliability for individuals suffering from NSLBP. The TSK includes two factors, with 11 items in the first factor (i.e., activity avoidance) and 6 items in the second factor (i.e., somatic focus).


