


1. Background
Multiple sclerosis (MS) is a chronic and progressive disease of the nervous system (1). It causes extensive destruction of the myelin sheath around the axon of sensory and motor neurons in the central nervous system (CNS) (2). The clinical image of people with multiple sclerosis (PwMS) varies according to the variation of disease and the brain structures in which the myelin sheaths are destroyed (3). PwMS are classified by their clinical course, relapsing-remitting MS (RRMS), secondary progressive MS (SPMS), and primary progressive MS (PPMS) (4).
PwMS often experience mild to severe motor and cognitive dysfunction, such as muscle weakness, spasms, tremors, fatigue, decreased attention and executive function, impaired balance and coordination (3). Since about 63% of people report falls at least once for a period of two to six months (5), balance impairment is a major concern in PwMS as it limits independence, reduces quality of life and activity, and increases mortality. So, the ability to maintain balance is one of the most fundamental aspects of human behavior (6).
PwMS also regularly report fatigue, which is another contributing factor to falls and balance deficit in this population. Therefore, treatment planning in this group should be well-targeted and accurate to avoid additional fatigue from unnecessary activity. Similarly, an integrated and coherent treatment plan for PwMS requires careful balance assessment (7). The symptoms of MS and the deficit of quantitative clinical assessment of gait and balance often cause therapists to have problems evaluating balance (3).
Although different tests have been developed to assess balance, they have numerous limitations as follows: (1) the ability to closely monitor disease progression; (2) examining the effect of intervention; (3) the insensitivity to differentiation between groups; (4) the poor reliability; and (5) a subjective mechanism (8). Recent studies have shown that different domains affect balance in PwMS, and single activity measurements cannot measure multiple balance domains and have little value in guiding treatment plans (7).
Also, objective evaluation of balance and gait by force plate and motion capture cameras requires a lot of time and is expensive, which is not clinically possible to use such equipment in medical settings (9). Currently, the Balance Evaluation Systems Test (BESTest) is available. This tool was designed by B. Horak to comprehensively examine different balance domains (10). The BESTest evaluates the following six balance subsystems: (1) biomechanical constraints; (2) stability limits/verticality; (3) anticipatory postural adjustments; (4) automatic postural responses; (5) sensory orientations; and (6) stability in gait (11). Each known system is partly related to independent neural mechanisms that contribute to the control of postural balance. During the tests, the participants are given break times to rest if needed.
Previous studies have suggested that the BESTest is a valid and comprehensive balance assessment tool with efficacy for clinical use in PwMS. Pearson correlation coefficient between all the domains of the BESTest questionnaire with the score of the Berg questionnaire was between 0.79 and 0.93, test-retest reliability was 0.84 to 0.99, and reliability between two examiners was 0.76 to 0.98 (12). However, previous studies have compared it with other subjective clinical tests (e.g., Berg Balance Scale, Tinetti, etc.) (13-15). BESTest is an inexpensive test without the need for special equipment or training, and it provides a lot of information about the underlying mechanisms involved in balance deficits. Nonetheless, as a drawback, BESTest takes about 45 minutes to complete, which could lead to fatigue. Also, it is yet to be determined whether the subjective clinical BESTest (or its subdomains) is valid for balance assessment in PwMS compared to objective laboratory “gold-standard” references (e.g., force plates).
2. Objectives
This study aimed to investigate the concurrent validity of the BESTest for balance assessment in PwMS by comparing the outcomes with laboratory tests using a force plate. We hypothesized that the BESTest would be valid for balance assessment in PwMS compared to “gold-standard” measures.
3. Methods
3.1. Subjects
This cross-sectional study was approved by the Ethics Committee of University of Social Welfare and Rehabilitation Sciences, Tehran, Iran (ethics code: IR.USWR.REc.1396.300). A total of 17 PwMS with kind RRMS and PPMS (mean age: 42.64 ± 7.8 years old) and 17 healthy controls (mean age: 42.33 ± 8.65 years old) were included. The participants were recruited from the Rehabilitation Hospital of Rofeideh, Tehran, Iran.
The inclusion criteria for the PwMS were as follows: (1) diagnosis by a neurologist; (2) the ability to perform laboratory assessments; (3) Expanded Disability Status Scale (EDSS) score 1 - 5; and (4) cognitive function of 24 or higher in mini-mental state examination (MMSE) (16). Subjects were excluded if they had any psychological disorders, auditory or visual problems, fatigue or special diseases interfering with the process of assessment, and fractures or implants (according to case history or self-report). The participants were excluded from the study in case of not fulfilling all the test items, inability to follow commands, deterioration of the disorder, and emergencies.
We gathered the demographic information such as age, height, and weight. Data were collected after obtaining an informed consent from all patients. Healthy people who matched the biographical profile of PwMS were invited to participate. According to the formula, 34 subjects were determined as the sample size (17 PwMS vs. 17 control). Nonetheless, to increase the accuracy of the study and account for the probable loss during the study, the sample size was considered to be 40 subjects (20 patients vs. 20 controls). Three patients were excluded from the study due to unwillingness to continue the tests, and as a result, three healthy people were also excluded (17).
3.2. Instrumentation
3.2.1. Expanded Disability Status Scale
The EDSS is used to assess the progression of the disease and the effectiveness of rehabilitation therapies as a clinician-administered assessment scale for evaluating the functional systems of the CNS. The inter-rater reliability kappa values of this scale have been reported between 0.32 and 0.76 (18). It includes 11 degrees between 0 - 10 (0 means normal neuro-logical status and 10 means death due to MS in 0.5 increments intervals (19). The scores are interpreted in this way: (1) no disability; (2) minimal disability; (3) moderate disability with no impairment to walking; (4) significant disability but self-sufficient and up for about 12 hours a day and able to walk without aid or rest for 500 m; (5) disability severe enough to impair full daily activities and ability to work a full day without special provisions and able to walk without aid or rest for 200 m; (6) requires a walking aid-cane, crutch, etc. and able to walk about 100 m with or without resting; (7) unable to walk beyond approximately 5 m even with aid, essentially restricted to wheelchair; though wheels self in standard wheelchair and transfers alone up and about in wheelchair some 12 hours a day; (8) essentially restricted to bed or chair or pushed in wheelchair and may be out of bed itself much of the day, retains many self-care functions, and generally has effective use of arms; (9) confined to bed and can still communicate and eat; and (10) Death due to MS (20).
3.2.2. The Mini-mental State Examination
The MMSE test was developed 40 years ago by Folstein et al. The American Academy of Neurology suggested the MMSE as an important tool in diagnosing primary cognitive impairment, and it is currently the most common screening method for assessing the severity of dementia in both clinical and research field (16).
The tool consists of a short battery containing 20 separate tests that cover 11 areas, including orientation, registration, attention or calculation (serial sevens or spelling), recall, naming, repetition, comprehension (verbal and written), writing, and construction. It has a total of 30 points and usually takes eight minutes to be performed in people with cognitive impairment and 15 minutes in people with dementia. Internal consistency appears to be moderate, with Cronbach alpha scores reported between 0.6 to 0.9. Also, sensitivity of the MMSE was 86%, and specificity was 92% with cut-off < 24/30 (21).
3.2.3. Balance Evaluation Systems Test
The BESTest consists of 36 items divided into six domains: (1) biomechanical Constraints: This identifies ankle strategy or compensatory steps for postural recovery such as flexed posture in frail elderly and individuals with Parkinson’s disease; (2) stability limits/verticality: Stability shows the degree to which the body's center of mass can be moved over its base of support and verticality represents gravitational upright; (3) anticipatory postural adjustments: This indicates readiness before the voluntary movements which depend on interaction of supplementary motor areas with basal ganglia and brain stem areas; (4) postural reactions: This evaluates the impulses carried by short, medium, and long proprioceptive feedback loops affected in diseases such as MS, cerebellar ataxia, and sensory neuropathy; (5) sensory orientations: Spatial orientation is maintained by pathways involving vestibular system and sensory integrative areas of the temporo-parietal cortex; and (6) stability in gait: This has 36 items and evaluates the coordination between spinal locomotors and brain stem postural sensorimotor programs (22). Each item is scored on a 4-level, ordinal scale from 0 (worst performance) to 3 (best performance) (11).
In this study, a Kistler force plate device (model 9286 AB, and Bioware 4.0.2 software version, 1000Hz) was used to collect the center of pressure data during static balance tasks. This model of force plate consists of a non-moving plate, piezoelectric sensors, and software designed to measure force, acceleration, and torque (momentum). The outcomes included anterior-posterior (AP) and medial-lateral (ML) sway, velocity of anterior-posterior and Medio-Lateral Sway (V.ML & V.AP) displacement velocity, and an area of displacement. The data were processed using MATLAB Software and analyzed using NEXUS Software.
3.3. Procedure
To evaluate the validity of BESTest using the force plate, 11 different tasks were considered. These tasks were selected based on the test items that could be performed in the Motion Analysis and Biomechanics Laboratory. So, we only considered the balance outcomes that could be obtained during static standing (Table 1). These tasks were selected from the APA and Sensory Orientation subsystems of BESTest.
| Domains | Healthy | PwMS | P-Value |
|---|---|---|---|
| Biomechanical constraints | 14.667 ± .485 | 9.706 ± 3.057 | < 0.001 |
| Stability limits/verticality | 20.444 ± .784 | 19 ± 3.279 | 0.195 |
| Anticipatory postural adjustments | 17.5 ± 1.2 | 12.529 ± 3.43 | < 0.001 |
| Postural reactions | 17.389 ± .978 | 13.823 ± 5.294 | 0.006 |
| Sensory orientations | 15 ± 0.000 | 13.471 ± 3.338 | 0.007 |
| Walking instability | 20.556 ± .616 | 16.588 ± 5.1 | < 0.001 |
| Total score | 105.2.148 | 85.118 ± 19.968 | < 0.001 |
Mean and Standard Deviation in Domains of BESTest in Healthy and MS Groups a
Each task in the Motion Analysis and Biomechanics Lab was performed on each person three times, and the best and most complete data obtained was selected and used to perform calculations. The duration of each task was determined according to the time considered in the BESTest. For example, to stand on the force plate, the duration was 30 seconds and to stand after getting up from the chair the duration was 10 seconds (22). We stopped the tests whenever the participants needed a rest.
The labels for different types of tasks were selected using the research of others who had performed similar tests using the force plate, and other new tasks were named by the authors by convention (23). Then, the most complete data obtained from the force plate [values of ground reaction forces (GRFs) and location of the center of pressure (COP)] were received from the system as output with a frequency of 1000 Hz.
To investigate the balance, the displacement of the center of pressure, the velocity of sway displacement of the center of pressure, and the displacement area were considered. The data obtained from the force plate in different tasks were used in MATLAB Software, version 13.
In all tasks, to calculate the displacement in the anterior-posterior direction of formula 2, the displacement in the medial-lateral direction of formula 3 was used (23):
Another parameter to check the balance is the velocity of sway displacement of the center of pressure. The velocity of the center of pressure is an indicator of the performance of the position control system. Pressure center velocity is the most sensitive parameter in patients with different age groups and neurological diseases in different tasks (24).
Formula 4 was used to calculate the velocity of the pressure center in the anterior-posterior direction, and formula 5 was used to calculate the lateral medial direction for all tasks (23):
Formula 6 was used to investigate the area of displacement and calculate the area of the ellipse (25):
3.4. Statistical Analysis
Data were analyzed using SPSS (version 25, IBM, USA) and Shapiro-Wilk tests showed that data were non-normally distributed. Therefore, non-parametric analysis was used to compare subjective (BESTest) and objective (force plate) balance outcomes, specifically Spearman correlation coefficients. The two groups did not differ significantly in demographic information, including age, height, and weight (mean and standard deviation) (P > 0.05).
4. Results
4.1. Participants
In this study, 17 PwMS (mean age: 42.64 ± 7.8 years; mean height: 162.76 ± 6.79 cm; mean weight: 60.12 ± 9.9.4 kg; mean MMSE score: 26.41 ± 1.46) and 17 healthy controls (mean age: 42.33 ± 8.65 years, mean height: 146.39 ± 38.36 cm; mean weight: 59.83 ± 8.47 kg; mean MMSE score: 27.1 ± 0.96) participated. The two groups were not significantly different in terms of demographic characteristics (P < 0.05).
4.2. Subjective and Objective Balance Measurement Showed Impairments in PwMS
There were significant differences between groups in several balance domains, including Biomechanical Constraints, Anticipatory Postural Adjustments, Stability in Gait, and total test scores (P < 0.01) and in domains of Postural Reactions and Sensory Orientations (P < 0.05). However, the stability domain of the BESTest was not different between the two groups (Table 1).
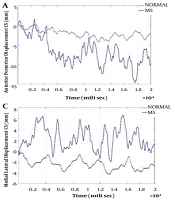
The pattern of AP & ML sways during the two tasks related to the Sensory Orientations domains [i.e., standing with a closed eye on the force plate (CS) and standing with open eyes on foam on a force plate (OF)] are shown in Figure 1. Sway in AP & ML directions, sway velocity in the AP direction, and area of displacement showed differences between the healthy subjects and the PwMS. But there was no difference between the two groups in the velocity parameter in the ML direction. Due to a large amount of data in this section, the correlation between the parameters related to ML and AP sways in the two tasks related to the Anticipatory Postural Adjustments, and the two tasks related to the Sensory Orientations domains are presented in Table 2.
. A, the pattern of anterior-posterior sway in CS task in PwMS and healthy participants; B, the pattern of anterior-posterior sway in OF task in PwMS and healthy participants; C, the pattern of medial-lateral sway in CS task in PwMS and healthy participants; D, the pattern of medial-lateral sway in OF task in PwMS and healthy participants.")
The pattern of anterior-posterior and mediolateral sways during the tasks related to sensory orientation domains (CS and OF). A, the pattern of anterior-posterior sway in CS task in PwMS and healthy participants; B, the pattern of anterior-posterior sway in OF task in PwMS and healthy participants; C, the pattern of medial-lateral sway in CS task in PwMS and healthy participants; D, the pattern of medial-lateral sway in OF task in PwMS and healthy participants.
| Tasks. Axis | APAs | Sensory Orientation | Total |
|---|---|---|---|
| OS.AP | -0.67 a | -0.57 a | -0.63 a |
| CS.AP | -0.79 a | -0.68 a | -0.78 a |
| OF.AP | -0.55 a | -0.36 b | -0.43 a |
| CF.AP | -0.60 a | -0.48 a | -0.57 a |
| TB.AP | -0.63 a | -0.62 a | -0.59 a |
| W.AP | -0.49 a | -0.48 a | -0.390 b |
| STOE.AP | -0.356 b | -0.16 | -0.32 |
| STOS.AP | -0.328 | -0.353 b | -0.312 |
| RH.AP | -0.83 a | -0.700 a | -0.78 a |
| OLSL.AP | -0.58 a | -0.343 b | -0.56 a |
| OLSR.AP | -0.52 a | -0.17 | -0.47 a |
| OS.ML | -0.637 a | -0.518 a | -0.516 a |
| CS.ML | -0.691 a | -0.700 a | -0.695 a |
| OF.ML | -0.423 b | -0.313 | -0.416 b |
| CF.ML | -0.588 a | -0.450 a | -0.537 a |
| TB.ML | -0.537 a | -0.540 a | -0.550 a |
| W.ML | -0.558 a | -0.482 a | -0.561 a |
| STOE.ML | -0.354 b | -0.32 | -0.351 b |
| STOS.ML | -0.599 a | -0.474 a | -0.622 a |
| RH.ML | -0.382 b | -0.297 | -0.369 b |
| OLSL.ML | -0.076 | 0.139 | -0.122 |
| OLSR.ML | -0.348 b | -0.009 | -0.30 |
The Correlation Between the Sway in the ML and AP During the Tasks Related to the Anticipatory Postural Adjustments, and the Sensory Orientation Domains on the Force Plate and the Participants' Scores in the BESTest Domains
The pattern of AP & ML sways during the two tasks (STOE and STOS) are shown in Figure 2. In the STOS task, AP sway in the PwMS was approximately similar to AP sway in healthy controls, but in ML sway the difference between the two groups was more prominent. In the STOE task, the AP sway in the PwMS was significantly higher than the sway in controls. However, the ML sway in the two groups had an insignificant difference.

The pattern of the AP and ML sways during the STOE and STOS. A, the pattern of anterior-posterior sway in STOS task in PwMS and healthy participants; B, the pattern of medial-lateral sway in STOS task in PwMS and healthy participants; C, the pattern of anterior-posterior sway in STOE task in PwMS and healthy participants; D, the pattern of medial-lateral sway in STOE task in PwMS and healthy participants.
4.3. The BESTest is a Valid Tool for Balance Assessment in PwMS Compared to Force Plate Analysis
There were significant negative correlations between the parameters related to AP sway in the tasks of OS, CS, OF, TB, CF, and W with domains biomechanical constraints, anticipatory postural adjustments & sensory orientations, and the total BESTest scores. In addition, the OS task had significant negative correlations with substations biomechanical constraints, stability limits/verticality, anticipatory postural adjustments, and sensory orientations & stability in gait. Also, the CS task significantly correlated with systems biomechanical constraints, anticipatory postural adjustments, postural reactions, and sensory orientations & stability in gait. Although these tasks were designed to simulate the sensory orientations system of the BESTest, they were also highly correlated with systems biomechanical constraints, anticipatory postural adjustments, and postural responses & stability in gait. Furthermore, significant negative correlations were found between CS tasks with all the BESTest domains in ML sway. The rest of the tasks were highly correlated with almost all the first and third systems of BESTest. These data indicated that the BESTest is well correlated with the force plate parameters. Regarding the tasks related to anticipatory postural Adjustments domains, RH had significant negative correlations with almost all BESTest domains except the second domains. In almost all tasks except STOS, AP sway was highly correlated with subjects' scores on biomechanical constraints domains. In the ML sway, the STOS task had significant negative correlations with all the BESTest' subsystems except postural reactions domains.
The sway velocity in the AP axis in all the sensory orientation tasks had significant negative correlations with the scores of subjects in all the BESTest' domains except system stability limits/verticality. In the tasks based on anticipatory postural adjustments domains, RH was significantly correlated with all domains except domains stability limits/verticality & stability in gait. No significant correlations were found in the ML axis between the sway velocities with the BESTest scores (Table 3).
| Speed in m/s | APAs | Sensory Orientation | Total |
|---|---|---|---|
| V.OS.AP | -0.731 a | -0.634 a | -0.747 a |
| V.CS.AP | -0.695 a | -0.637 a | -0.682 a |
| V.OF.AP | -0.609 a | -0.513 a | -0.606 a |
| V.CF.AP | -0.616 a | -0.466 a | -0.641 a |
| V.TB.AP | -0.544 a | -0.460 a | -0.574 a |
| V.W.AP | -0.544 a | -0.34 b | -0.535 a |
| V.STOE.AP | -0.33 | -0.27 | -0.351 b |
| V.STOS.AP | -0.199 | -0.35 | -0.22 |
| V.RH.AP | -0.553 a | -0.602 a | -0.580 a |
| V.OLSL.AP | -0.26 | -0.15 | -0.295 |
| V.OLSR.AP | -0.47 a | -0.22 | -0.437 a |
| V.OS.ML | -0.007 | -0.1 | -0.018 |
| V.CS.ML | -0.126 | -0.24 | -0.12 |
| V.OF.ML | -0.019 | -0.09 | -0.011 |
| V.CF.ML | -0.116 | -0.16 | -0.13 |
| V.TB.ML | -0.07 | -0.14 | -0.04 |
| V.W.ML | -0.128 | -0.21 | -0.16 |
| V.STOE.ML | -0.19 | -0.32 | -0.19 |
| V.STOS.ML | -0.07 | -0.25 | -0.02 |
| V.RH.ML | 0.038 | -0.097 | 0.020 |
| V.OLSL.ML | -0.15 | 0.021 | -0.16 |
| V.OLSR.ML | -0.32 | -0.13 | -0.27 |
The Correlation Between the Sway Velocity in ML and AP Directions During the Tasks Related to the Anticipatory Postural Adjustments and the Sensory Orientation Domains on the Force Plate and the Participants' Scores in BESTest Domains
Table 4 shows the correlations between the area of displacement during the tasks on the force plate and the BESTest scores. The area of displacement during different Sensory Orientation tasks had significant negative correlations with BESTest scores; especially, CS had significant correlations with all the domains. Among the tasks based on Anticipatory Postural Adjustment, RH significantly correlated with almost all domains except the second domain. The STOS had the highest correlation with the second domain.
| Area | APAs | Sensory Orientation | Total |
|---|---|---|---|
| A.OS | -0.787 a | -0.628 a | -0.724 a |
| A.CS | -0.764 a | -0.685 a | -0.736 a |
| A.OF | -0.528 a | -0.391 b | -0.471 a |
| A.CF | -0.680 a | -0.558 a | -0.648 a |
| A.TB | -0.606 a | -0.648 a | -0.600 a |
| A.W | -0.570 a | -0.517 a | -0.535 a |
| A.STOE | -0.32 | -0.28 | -0.323 |
| A.STOS | -0.33 | -0.356 b | -0.33 |
| A.RH | -0.737 a | -0.643 a | -0.694 a |
| A.OLSL | -0.192 | -0.058 | -0.24 |
| A.OLSR | -0.391 b | -0.049 | -0.345 b |
The Correlation Between the Areas of Sway During the Tasks Related to the Anticipatory Postural Adjustments and the Sensory Orientation Domains on the Force Plate and the Participants' Scores in the BESTest Domains
5. Discussion
In previous studies, BESTest was evaluated with functional tests, each of which had some limitations. One of the most important limitations of previous studies is the bias in the test results (13, 14). As a result, these studies cannot be confirm the accuracy of this test. Only in one study, this test was examined with objective tests. In this study, the activities intended to be performed in the laboratory were three different activities selected by the researcher (17). The present study examined the details of this test, because according to the findings, this test is the only systematic evaluation test of balance, and it is important to examine the details and sensitivity of subsystems to evaluate and plan treatment (10). In this study, all activities performed in the laboratory were similar to the test items. The results showed that the scores of the different BESTest domains except for domains stability limits/verticality were significantly different in PwMS and healthy individuals. Besides, the two groups had significant differences in the AP & ML sway during the tasks based on the BESTest domains. However, the difference between the two groups in the AP sway was higher than ML sway. There were significant differences between the two groups regarding the amount of sway in the AP & ML directions and the area of displacement. However, significant difference in the sway velocity was only observed in the AP but not in ML axis. These findings indicated that both BESTest and force plate could differentiate balance disorders. The precise findings of the force plate support the functional outcomes of the BESTest.
Investigation of the correlation between the BESTest scores and the force plate measurements showed significant negative correlations between the sway parameters in the AP direction. Besides, the sways in the ML direction correlated negatively with the scores of the BESTest. This finding confirms that the higher a person’s score in the BESTest systems, the lower the sway in the AP & ML directions. Furthermore, the area of displacement had a significant negative correlation with the BESTest scores, meaning that the higher a person's score in the BESTest, the lower his/her sway area. These findings support that the individual's scores in the BESTest can clearly and precisely predict the sways due to balance problems in the PwMS.
Presence of correlation only in AP, but not ML, between displacement velocities with the BESTest scores is consistent with some previous reports by Lee and Sun, and Salavati et al. (23, 26). Furthermore, the researchers reported that the ML direction was less affected by balance disorders in static conditions than AP directions (27). Hence, it is acceptable that velocity in ML direction showed no difference between the two groups. According to Table 3, each task in the ML direction is also less correlated with the domains from which it is derived. Also, the velocity of sway in the ML direction was not significantly correlated with any of the BESTest domains. This is justified by the fact that the ML direction is less affected in static conditions.
In a previous study, the validity of the BESTest was measured using laboratory tests, force plate, motion recording, and EDSS testing in PwMS (n = 13) and healthy people (n = 13). The results showed a significant correlation between BESTest scores with laboratory tests on the speed of the steps when starting the walking (Pearson correlation coefficient 0.48, P < 0.01). It also showed a good correlation between the changes in pressure center on both sides (Pearson correlation coefficient = 0.55, P < 0.005), and postural response (Pearson correlation coefficient = 0.76, P < 0.0001). The overall score of BESTest was accurate in diagnosing people at risk of falling from the people without risk of falling. It also showed a significant correlation with EDSS (Pearson correlation coefficient = 0.85, P < 0.0005) (17).
In another study, 110 PwMS were tested and retested by two examiners in two stages. Coronach’s alpha coefficients were calculated to be above 0.70 in all domains of the BESTest questionnaire. Also, the range of intraclass correlation coefficient (ICC) values of each domain of the BESTest in test-retest was 0.84 to 0.99. In addition, the intra-rater correlation coefficients in all the six domains were calculated from 0.76 to 0.99 (12). Also, to validate the Norwegian version of BESTest and Mini BESTest, three groups (people over 65, people with a history of stroke or MS) were assessed and correlation validity was measured by Falls Efficacy Scale International (FES-I). BESTest showed good interrater reliability (ICC = 0.98) and test-retest reliability (ICC = 0.89), and a moderate correlation was found between the FES-I test with the BESTest (Spearman rho = 0.51, P < 0.01) (28).
In a cohort study, 49 patients with acute stroke were selected with an average age of 57.8 ± 11.8. Mini BESTest, BESTest, BBS, and CB&M tests were performed before and after rehabilitation. The results showed that BESTest, compared to CB&M and Mini BESTest, was more sensitive to equilibrium changes, and it had no ceiling and floor effects compared to other equilibrium tests. The post-test accuracy and specificity were higher than the two CB&M and PASS tests in patients whose balance was improved (P < 0.01) (29).
In another observational study, the validity and reliability BESTest were measured for people with acute stroke. A total of 70 patients were included in the study for convergent validation. BBS, PASS, CB&M, and Mini BESTest tests were performed. A good reliability (ICC = 0.99) and a high correlation with other equilibrium tests were observed (Spearman correlation coefficient in BBS, CB&M, and Mini BESTest tests were 0.96, 0.96, and 0.91, respectively) (14); this test was also highly convergent. The ceiling-floor effects were not seen in this test. Furthermore, the correlation coefficient between BEST, BBS, and ABC_Brezil was reported as 0.78 and 0.59, respectively (30). To investigate the relationship between BEST and BSS, 100 patients with stroke and 20 healthy people with a range of 60 - 45 years were evaluated. There was a strong negative correlation between BESTest and BSS (r = -0.8672; P < 0.0001) (31).
5.1. Conclusions
This study provided evidence to support the use of the BESTest in PwMS for balance assessment, as the subjective clinical evaluation with the BESTest was comparable to the laboratory reference of force plate analysis and showed good validity to assess PwMS. In general, it can be concluded that BESTest has a high sensitivity in showing center of pressure changes. Also, since each task has a better correlation with its related subsystem, therefore it can be said that this test has a good specificity. As a result, due to the consideration of multiple subsystems for balance disorders and the specificity of subsystems, this test can be used to evaluate the results and to plan treatment.
5.2. Limitations
This study had several limitations. First, due to the importance of fatigue in PwMS, it was not possible to evaluate further activities with laboratory tests and functional tests. Second, we failed to examine patients with a EDSS score of less than 5. Third, the sample size of the present study was small.
