


1. Background
Substance abuse and the risks of its consequences are the major health problems in the world and an important health problem in Iran (1). Intentional drug poisoning means the intentional consumption of more than the prescribed or advised amount of any medicine, recreational drugs, non-ingestible drug, or excess alcohol for self-harming purposes (2). The drug poisoning with different intentions is a common method of suicide attempt (3), and intentional drug poisoning or self-harm through poisoning is a common reason for patients' visits to emergency departments (4). The suicide attempt is a significant predictor of future suicide attempts, and if individuals receive psychiatric care, they are significantly less likely to develop subsequent similar behaviors (3). Substance abuse and the risks of its consequences are the major health problems in the world and an important health problem in Iran (1). Intentional drug poisoning means the intentional consumption of more than the prescribed or advised amount of any medicine, recreational drugs, non-ingestible drug, or excess alcohol for self-harming purposes (2). The drug poisoning with different intentions is a common method of suicide attempt (3), and intentional drug poisoning or self-harm through poisoning is a common reason for patients' visits to emergency departments (4). The suicide attempt is a significant predictor of future suicide attempts, and if individuals receive psychiatric care, they are significantly less likely to develop subsequent similar behaviors (3).
Addiction to drugs and alcohol is closely associated with defective socioeconomic symptoms. Social and economic factors shape health disparities among drug users (5). They affect on health indirectly by shaping individual drug-use behaviors; they directly affect on health by affecting on the availability of sources (6). Adverse socioeconomic status and low social support are interactively consistent with suicidal ideation (5). The interventions in Public health should to improving the health of drug users and address the social and economical factors that exacerbate the health consequences of illicit drug use (6).
Accordingly, the present study examined the hypothesis that differences in the economic and social environments of the counties of Semnan Province could lead to differences in people's health-related behaviors. In recent years, Semnan Province has had a cumulative incidence rate higher than the national average in deaths from substance abuse (7) The results of one study examining the process of referral of drug addicts to hospitals in Semnan indicated that the referral process had an upward trend in the last decade (8). For proper preventive planning, we need to know how drug poisoning is distributed in different periods in a place to assess the effectiveness of environmental factors in increasing or decreasing the incidence of some drug poisoning.
Addiction to drugs and alcohol is closely related to defective socioeconomic symptoms. Social and economic factors shape health disparities among drug users (5). They affect on health indirectly by shaping individual drug-use behaviors; they directly affect on health by affecting on the availability of sources (6). Adverse socioeconomic status and low social support are interactively consistent with suicidal ideation (5). The interventions in Public health should to improving the health of drug users and address the social and economical factors that exacerbate the health consequences of illicit drug use (6).
Accordingly, the present study examined the hypothesis that differences in the economic and social environments of counties of Semnan Province could lead to differences in people's health-related behaviors. In recent years, Semnan Province has had a cumulative incidence rate higher than the national average in deaths due to substance abuse (7). Since, in the last decade, Iran has a significant increase in substances than in opioid derivatives, leading to an increase in the rate of poisoning and mortality owing to substance abuse in addition to their physical and psychiatric complications (9). In a study, which examined the process of referral of drug addicts to hospitals in Semnan, the results indicated that the referral process had been upward in recent years (8). For proper preventive planning, we need to know how drug poisoning are distributed in different periods in a place to assess the effectiveness of environmental factors in increasing or decreasing the incidence of some drug poisoning.
1.1. Literature Review
As drug poisoning data include deaths from illicit and non-illicit sources, intentional and not, examining spatial variation in the factors that relate to drug poisoning should point to spatial differences in drug source or intent. Drug poisoning is hypothetically related to a range of environmental, economic and demographic factors and these relationships will be reviewed following a description of relevant geographic characteristics of the Semnan province.
To explain rates of drug poisoning in the Semnan province and the apparent paradox of rates in this province, we examined two factors (spatial and time trend) affecting drug poisoning using spatial methods. Although recent studies have linked high elevations with increased death related drug use (10, 11), intentional or unintentional Drug intoxication all of which influence drug poisoning rates.
2. Objectives
The present study was designed and conducted to identify the time trend and investigate high-risk and low-risk clusters, time trend and spatial analysis of drug poisoning in 2011 - 2017 in Semnan Province. The results may contribute to the application of public health strategies to reduce preventable deaths.
3. Methods
3.1. Design of Study
A descriptive-analytical and retrospective longitudinal study was conducted using the Exploratory Mixed Design method, which simultaneously evaluated the effects of place (multiple-group study) and time (time-trend study) (12-14). It evaluated and compared the incidence of drug poisoning in different places of Semnan over different periods.
3.2. Target Population
The target population consisted of all people in Semnan Province from 2011 to 2018, including people who visited the emergency department of the hospitals of province during the period with a diagnosis of drug poisoning. Inclusion criteria were as follows: (1) access to patient spatial information; and (2) all patients of both genders and all ages with a poisoning code based on the ICD-10 book (Appendix 1) (15) from 2011 to 2018 and being registered in the medical records unit. The population statistics of the counties of Semnan Province were also received from the health deputies of Semnan and Shahroud universities of medical sciences. All samples were included using the census method.
3.3. Location of the Study Area
Semnan Province is located at a longitude of 53º 23' and latitude of 35º 34', and its average altitude is 1130 m. The area of this province is 97,491 km2 that constitutes 5.9% of the total area of Iran. The population of the province was 702,000 in the 2016 census.
3.4. Data Collection Sources
Data related to the patients in the mentioned period were received from the medical records unit of hospitals (Velayat, Kowsar, Amiralmomenin, Emam Khomeini, Shafa, Motamedi, Bahar, Emam Hosein, Khtamol’anbia). Demographic data of Semnan Province in the study period were received from the health deputies of Semnan and Shahroud universities of medical sciences. The patients' geographic data were obtained from the latest information available in the Google Map and the reference land layer of Iranian provinces (Georeferenced).
3.5. Procedure
The incidence of the drug poisoning indicates the rate of infection and is the result of dividing the number of new cases of the drug poisoning during a certain period by the average number of people at risk of developing the drug poisoning in that period. The incidence of the drug poisoning (per 100000 people) was considered as a dependent variable and the year as an independent variable. In addition to identifying the exact time of Joinpoints, the values of AAPC-APC and slope changes of the regression line were estimated at a 95% confidence interval for the annual drug poisoning trend from 2011 to 2011 according to the location.
The Global Moran's index was used to analyze the spatial pattern and evaluate the degree of spatial autocorrelation of the drug poisoning.
To this end, first the cumulative incidence of drug poisoning in the province from 2011 to 2018 was calculated and then the zoning of the cumulative incidence in the province was drawn using the ArcGIS 10.8; Finally, the spatial autocorrelation of drug poisoning was measured using Global Moran's I. The statistics varied from +1 to -1. The closer the value of the statistic is to +1, the more it is clustered, and the closer it is to -1, the more it is dispersed, Furthermore, if its value is zero, the spatial distribution of the phenomenon is random. The null hypothesis indicated that the distribution of drug poisoning was randomly dispersed in Semnan Province (13, 16).
The Kuldorff's purely spatial scan statistic test and the Gini Optimized Cluster Collection method were used to detect the high-risk and low-risk clusters and estimate the relative risk of drug poisoning in any county of Semnan Province. This new method separates clusters on a more local scale and optimizes the radius of the circular scanning window for cluster detection, thereby demonstrating the best results in cluster detection (13, 16, 17).
3.6. Statistical Analysis
The statistical analysis consisted of three main sections: (1) descriptive analysis of epidemiological and demographic indices the patients; (2) analysis of the evaluation of the time trend of theincidence of drug poisoning; (3) analysis of the spatial pattern of the incidence and clustering ofdrug poisoning. All statistical tests were in α of two domains at a significance level of 0.05.
SPSS 26 was used to conduct the descriptive analysis. To perform the time trend analysis, the annual incidence rate of drug poisoning per hundred thousand people per year from 2011 to 2018 wasfirst measured for the entire province and calculated by place and time. Then, changes in the time trend of the incidence of drug poisoning were evaluated using the Joinpoint Regression Program version 4.9.0.0 in March 2021. This application is used to detect the time trend and points when the incidence of the drug poisoning changes significantly.
4. Results
4.1. Descriptive Section
In the present study, 3360 patients hospitalized in Semnan Province were diagnosed with drug poisoning from 2011 to 2018 after applying the inclusion and exclusion criteria. The average annual number of cases per hundred thousand people was 598.4. The mean age of the patients was 26.7 years. The total number of the patients, who visited hospitals in Semnan Province and the annual incidence rate per 100000 people show in Table 1. As seen in this table, the highest rate of patients is in 2017 and the lowest in 2011 (Table 1).
| Year | 2011 | 2012 | 2013 | 2014 | 2015 | 2016 | 2017 |
|---|---|---|---|---|---|---|---|
| Number of patients | 219 | 254 | 290 | 357 | 576 | 494 | 600 |
| Annual incidence rate per 100000 people | 45.1 | 52.4 | 57.4 | 66.5 | 80.5 | 80 | 98.2 |
Figure 1 depicts the number of the incidence of drug poisoning in the counties of in Semnan Province during 8 years. The highest incidence rate was related to Garmsar County in 2011, 2012, 2013, 2014, and 2016, and the highest incidence rate belonged to Shahroud County in 2015 and 2018, as well as the highest incidence rate was related to Damghan County in 2017.

The incidence of drug poisoning as well as counties of Semnan Province during 8 years
4.2. Spatial Distribution Results
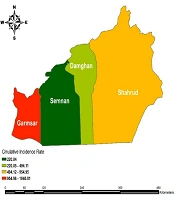
Figure 2 shows the spatial distribution zoning of the cumulative incidence of drug poisoning.

Spatial distribution map of the cumulative incidence of drug poisoning in Semnan province
Figure 3 presents the cumulative incidence of each county of the province. As the figure shows, the highest and lowest rates of cumulative incidence were in Garmsar and Semnan, respectively.
Spatial autocorrelation

Degree of the spatial autocorrelation of drug poisoning in Semnan Province using the Global Moran's I index
Figure 3 shows the result of the patient's autocorrelation and analysis of the Global Moran's I index. The value of the Global Moran's I index was equal to 0.506, and P-value = 0.74, indicating that the degree of the spatial autocorrelation of drug poisoning was non-significant (Figure 3).
4.3. Estimation of the Relative Risk and Identification of Clusters by the Gini Optimized Cluster Collection Method in Each County of Semnan Province
The relative risk value in the low-risk cluster (Semnan County) was 0.26 and significant, indicating that the risk of drug poisoning in regions inside the cluster was 0.26 times higher that in regions outside the cluster (74% less). The relative risk in the high-risk cluster (Shahroud County) was 2.07 and significant, revealing that the risk of drug poisoning in regions inside the cluster was 2.07 times higher than the regions outside the cluster (107% more). Shahroud and Garmsar were two high-risk regions for drug poisoning so that the relative risk in the regions was higher than 1 (Table 2); in other words, the people living in these regions were at higher risk of developing drug poisoning. Semnan and Damghan are low-risk and protective regions, since they have a relative risk lower than 1.
| No. | City | Coordinate/Radius | Population Size | Number of Cases | Expected Case | Annual Cases/100000 | Relative Risk | Observed/Expected | Log Likelihood Ratio | P-Value |
|---|---|---|---|---|---|---|---|---|---|---|
| 1 | Semnan | 35.34 N & 53.23 E | 233142 | 513 | 1397.92 | 219.6 | 0.26 | 0.37 | 533.0652 | < 0.000 |
| 2 | Shahroud | 36.4167 N & 55.0167 E | 164721 | 1573 | 987.67 | 953 | 2.07 | 1.59 | 219.94 | < 0.000 |
| 3 | Garmsar | 35.12 N & 52.20 E | 91659 | 954 | 549.59 | 1038.7 | 2.01 | 1.74 | 150.47 | < 0.000 |
| 4 | Damghan | 36.168 N & 54.348 E | 99370 | 491 | 595.82 | 493.1 | 0.8 | 0.82 | 11.66463 | 0.001 |
Among low-risk clusters, Semnan with a Log-likelihood ratio (LLR) of 533 was the most important low-risk cluster, i.e. the cluster was more likely to be a low-risk cluster. The geographical coordinates of the center of the cluster were 53.23 E and 35.34 N and had 513 poisoned patients. Damghan County with a relative risk of 0.8 and LLR = 11.66 was a secondary cluster. The geographical coordinates of the center of the cluster were 36.167N and 54.348E and had 491 poisoned patients.
Moreover, Shahroud was the most important high-risk cluster with LLR = 219.94, demonstrating that the cluster was more likely to be a high-risk cluster. The geographical coordinates of the center of the cluster were 36.4167N and 55.0167E and had 1573 patients. Garmsar County with a relative risk of 2.01 and LLR = 150.47 was a low-risk secondary cluster. The geographical coordinates of the center of the cluster were 36.188N and 52.20E and had 954 poisoned patients (Table 2).
4.4. Time Distribution Results
Table 3 and Figure 4 present the results of the time trend of the incidence of drug poisoning based on the residence county. The trend of poisoning was increasing for Semnan County (Figure 4A) from 2011 to 2014, and the value of APC was 71.1 for the period; in other words, the incidence of drug poisoning increased by 71.1% per year on average in this period, and then it had a non-significant reduction (APC = -13.0). The incidence of poisoning had a significant increase in Shahroud County (Figure 4B) from 2011 to 2015 (APC = 35.9), however,the rate of poisoning decreased after 2015. The trend of poisoning also increased in Damghan County from 2011 to 2014 and increased by 8% (APC) on average, however, the incidence of poisoning increased rapidly after 2015.
.")
Temporal analysis with join-point regression models fitted to crude incidence rate drug related poisoning in counties of Semnan Province (2011 - 2018).
Garmsar County also had an increasing and non-significant trend from 2011 to 2014 (APC = 7.8), however, the incidence of poisoning was declining after 2015.
The poisoning time trend in the whole province was increasing by 14.1% per year on average, which was statistically significant, from 2011 to 2015, but a joinpoint was found in 2015, and the incidence of poisoning decreased by an average of 0.2% annually from 2015 to 2018. The value of AAPC was 9.8 and significant from 2011 to 2018, indicating that the incidence of poisoning increased by an average of 9.8 % in the whole province per year from 2011 to 2018 (Table 3 and Figure 4).
| The Graph Related with Figure 4 | City | Time Frame of the Trend | APC | P-Value | AAPC | P-Value | ||
|---|---|---|---|---|---|---|---|---|
| Point Estimate | 95% CI | Point Estimate | 95% CI | |||||
| A | Semnan | 2011 - 2014 | 71.1 | -16.2 - 249.4 | 0.09 | 16.3 | -9.1 - 48.8 | < 0.01 |
| 2014 - 2018 | -13.0 | -44.6 - 36.7 | 0.4 | |||||
| B | Shahroud | 2011 - 2015 | 35.9 a | 15.8 - 59.6 | 0.009 | 24.1 a | 13.7 - 35.4 | < 0.01 |
| 2015 - 2018 | 9.9 | -14.7 - 41.6 | 0.4 | |||||
| C | Damghan | 2011 - 2015 | 8.0 | -35.3 - 80.2 | 0.6 | 14.0 | -13.8 - 50.7 | < 0.01 |
| 2015 - 2018 | 22.5 | -45.5 - 175.2 | 0.4 | |||||
| D | Garmsar | 2011 - 2013 | 7.8 | -46.1 - 115.8 | 0.7 | 1.3 | -11.9 - 16.5 | 1 |
| 2013 - 2018 | -1.2 | -15.4 - 15.4 | 0.8 | |||||
| E | Total of Province | 2011 - 2016 | 14.1* | 10.8 - 17.6 | 0.001 | 9.8* | 6.9 - 12.8 | < 0.1 |
| 2016 - 2018 | -0.2 | -12.7 - 14.1 | 0.9 | |||||
a Indicate the APC or AAPC is significantly different from zero at the alpha = 0.05 level.
5. Discussion
Knowledge about the poisoning pattern in a particular region plays an important role in identifying risk factors and early diagnosis of poisoning. Understanding the poisoning pattern also helps to design suicide prevention strategies and reduce the risks of accidental poisoning (18). Semnan Province is a region with a high risk of deaths due to substance abuse (19); hence, the present study set to identify high-risk clusters and the time trend of drug poisoning in the province. Therefore, spatial analyses at this point are valuable for identifying risk factors for informing resource allocation.
The annual number of cases per 100,000 people was 598.4 on average and in young people. The AAPC of drug poisoning incidence was 9.8 and significant in the whole province, indicating that poisoning increased by an average of 9.8% per year in the whole province from 2011 to 2018. The results of cluster identification by the Gini Optimized Cluster Collection method demonstrating that the relative risk value was 0.26 and significant in the low-risk cluster (Semnan County), showing that the risk of drug poisoning was 0.26 times higher in regions inside the cluster than regions outside the cluster (74% less). Furthermore, the relative risk value was 2.07 and significant in the high-risk cluster (Shahroud County), revealing that the risk of drug poisoning was 2.07 times higher in the regions inside the cluster than regions outside the cluster (107% more). Semnan City with LLR = 533.07 was the most likely low-risk cluster, and Shahroud was the most likely high-risk cluster with LLR = 219.94.
Semnan Province is in the transit route of drugs from Afghanistan to Tehran owing to its proximity to Khorasan Province of Iran (20). The drug trafficking route in this province has provided easy access of people to drugs and alcohol in this region. Since international evidence shows that easy access to drugs plays key role in intentional drug poisoning (4), the trend of visits of drug addicts to hospitals in Semnan Province was increasing during the 2020s (8). Additionally, its mortality rate due to substance abuse is higher than the national average (7). In case of a lack of proper planning and intervention, this trend is predictedto increase (8).
Owing to the geographical location of Semnan Province, it has the highest number of Afghan illegal asylum seekers compared to other provinces (21), leading to a high number of addicts and suicide attempts according to the large population. Furthermore, positive attitude toward addiction in families, high migration in rich strata, more than a quarter of the county's population being below the poverty line, and unfair distribution of income in families have made caused Garmsar County to have the highest cumulative incidence from drug poisoning in the province (22, 23). Regions with low-income populations are more at risk of deadly poisoning however, the mechanism of this association is unknown (24). The history of addiction in families and positive attitude toward addiction in families in Shahroud County can increase the relative risk of addiction in this county (23). This results coincides with previous research that drugusers may be use drug more available and less costly and used by peoples who misuse opioids (25).
The data indicated that most poisoned individuals were in the second decade of their lives. A similar study indicated that the highest age of suicide attempt was from 15 to 29 years in Southeast Asian countries (26). These findings correspond with the results from studies on heroin user in Seattle where it was found that younger heroin users and opioid injectors were more at risk than older heroin users (27). The major causes of this upward include increased access to opioids, injection behaviors and sharing of syringes (28).
Studies in western countries indicated that there was nosignificant relationship between gender, age group, and addiction (29). Cultural factors and regional differences play crucial roles in this field as change of cultural norms and different paths of economic development over time change this index (26).
The results indicated that there were 598.4 annual cases/100000 people on average in the province. In the United States, the figure was 232 per 100000 in 2007 (30); it was 17 per 100,000 in 2013 in Japan (31), and 115 per 100,000 in New Zealand (32). It is important to note that these statistics provide contrary definitions of the number of people poisoned by drugs and other chemicals (e.g. alcohol, carbon monoxide, and pesticides) in various studies, and the statistics are not exclusively for drug poisoning (31).
The present article reveals a more representative picture of drug poisoning in this particular region. Probably risk factors for acute poisoning in Semnan Province include regions with lower population density and a higher poverty scale, lower urban development, and young people. The interrelated nature of the published data related to illicit opioid epidemics indicates that they cannot be ignored and the people in this province are potentially at risk of the dissemination of the data on control, problematization, stigma, class and/or regional tension; however, the numbers will probably increase in the subsequent years. Irrespective of the policies that are likely to be implemented, death rates will rise and quality of life will considerably decrease for many people in the coming years. It is better to design planning for naloxone distribution that is considered worldwide as an effective antidote for intervening deaths from drug overdoses (25).
To support the current approaches to reducing the harm, there are important research gaps to be filled in future studies. Among the gaps are surveillance, ethnographic studies on drug use behaviors; epidemiologic studies on exposure, natural histories to describe transitions in routes of administration and use, and risks associated with new synthetic opioids that are illegally manufactured; evolution of treatment trajectories; opioid markets changes; and measurement of the social and economic effects of the use of opioids, particularly heroin.
Further studies are recommended to report the causes of poisoning as well as the exact status of death or recovery of individuals according to the type of drugs and using forensic reports so that the officials may know how to better plan the quality and quantity of substance available to the public in Semnan Province and to prevent more serious accidents with timely interventions.
5.1. Conclusion
Semnan Province is a region with a high risk of deaths due to substance abuse. Shahroud and Garmsar as two border towns of Semnan province had the highest incidence and relative risk of substance abuse. After clustering regions in poisoning incidents, drug policies should be designed according to geographical differences in the region. Training packages should be provided for the most at-risk populations, and differences in demographic characteristics should be considered inside and outside the province. It is necessary to upgrade preventive and therapeutic services in high -risk substance abuse areas.
5.2. Limitations
Lack of access to some social, economic, and climatic data to measure their effects on substance abuse is one of the most important limitations of the present study that we suggest that other researchers can measure their effects on the Substance Abuse by resolving this limitation.
A limitation of the study was the lack of cooperation of the province's hospitals in providing accurate statistics on the type of toxic substance and the individuals' gender. To better understand the determinants of the spatial distribution of drug poisoning, more data should be collected and analyzed at the personal level, including the history of prescribing drugs and sources of prescribed drugs (legal vs. diversion; by a physician vs. via the Internet) Since there may be confounding factors that affect the results of spatial regression. The information system and records of patients are not without errors in the hospitals; and there is no specific national registration system in Iran to determine the number of suicides or poisoning cases due to addiction. Different organizations and sources report different statistics; thus, there are many under-enumerations in this field (7).
