


1. Background
The larynx and phonation system is crucial for preserving the social and professional life of each voice user (1, 2). Theater actors are a special subgroup of professional voice users with high voice demands (3, 4). Voice is considered the primary source of artistic expression for a theater actor and is used to convey various emotions. Theater actors require the use of a wide range of vocal repertoire and high intensity in professional rehearsal and performances; therefore, the slightest voice dysfunction can lead to severe professional consequences for them (4, 5). The published literature indicated that the high prevalence of voice disorders ranges between 47 and 74% among professional voice users (6, 7). The stage theater actors among professional voice users have reported the most complaints of voice problems, so the prevalence of voice disorders is 74% in this population. It is also proposed that 55% of these actors lose their voice and working activity during a stage performance for two to three-day courses (8).
Evaluation and measurement of the acoustic characteristics of voice are one of the best ways to identify voice problems (9, 10). In determining the acoustic parameters, perceptual evaluation and acoustic analysis usually contribute significantly to the detection and analysis of disorder, as Casper and Leonard note perceptual and acoustic evaluation at the top of voice assessments (11). Pitch, loudness, breathiness, strain, and roughness are the most significant perceptual parameters of voice that are predominantly determined by perceptual voice rating scales (12). Furthermore, the most important acoustic parameters in evaluations are the mean fundamental frequency (F0), local jitter, local shimmer, and harmonic-to-noise ratio (HNR), which are particularly important in voice studies. These characteristics are mainly measured by specific tools or software such as Praat (11, 13). Acoustic measurements are not only part of subjective assessments of voice but can also be used alongside voice perceptual assessment (14, 15). There are limitations to voice measurements concerning voice assessment.
On the other hand, the experts have no agreement to determine the most sensitive instrument in acoustic measurement (16). In addition, due to the nature of acoustic measurement, there are also practical problems with using these tools. However, it seems that neither the perceptual nor acoustic evaluation method alone is perfect, but using them together can complement one another’s shortcomings (17).
There are various scales to the auditory-perceptual evaluation of voice, such as Consensus Auditory-Perceptual Evaluation of Voice (CAPE-V). The CAPE-V is a standardized clinical protocol for evaluating auditory-perceptual judgments of vocal quality (12). The validity and inter-rater reliability of this profile in Persian were reported in 2013 by Salary Majd et al. (18). Moreover, the construct and discriminative validity of the Persian version of the CAPE-V were investigated in 2020 (19). This profile is at the top of the profiles of perceptual evaluation of voice in terms of validity. Its reliability is also high without taking most training courses for most voice parameters. This profile measures several parameters related to voice quality, including overall severity, roughness, breathiness, strain, pitch, and loudness.
There was published literature that demonstrated relationships between acoustic measurements and auditory perceptual parameters in various populations, such as dysphonia patients, healthy participants with no history of voice disorders, and non-professional voice users (14, 20-22). There is a dearth of studies exploring the relationships between these two categories of voice evaluation in theater actors.
2. Objectives
This study aimed to investigate the correlation between auditory-perceptual parameters and acoustic measurements of voice in Iranian theater actors. The auditory-perceptual parameters that correlate most strongly with corresponding acoustic measurements can be used for clinical assessment of the voice in theater actors, especially when we do not have access to a sensitive instrument for acoustic evaluation of the voice.
3. Methods
3.1. Study Subjects
This descriptive-analytical study aimed to provide a cross-sectional description of theater actors’ perceptual and acoustic voice characteristics. The study subjects consisted of 45 Iranian theater actors (22 females and 23 males, mean age 30.7 ± 7.6 years) who were native speakers of the Persian language and performed exclusively in the Iranian theater style. The mean age of male subjects was 32.04 ± 7.68, and the mean age of female subjects was 32.29 ± 6.05. A minimum of four years of performance experience, no history of neurologic, progressive, and/or respiratory disorders, and head and neck surgery were considered inclusion criteria for this study. The exclusion criterion was getting a cold. Moreover, female subjects were not tested during their menstruation or menopause period (11). Subjects were selected through virtual snowball sampling. Before the study, the subjects read and completed an informed consent form based on the principles of the Declaration of Helsinki on research ethics. This study was approved by the research council of the School of Rehabilitation Sciences, Iran University of Medical Sciences (IUMS), and the Ethics Committee of IUMS (ID: IR.IUMS.REC.1397.896, link: ethics.research.ac.ir/IR.IUMS.REC.1397.896). A unique identifier number was assigned to each individual to protect the confidentiality of data and the subject’s privacy.
3.2. Study Procedure
Following interviews with the subjects, the evaluation steps of auditory-perceptual and acoustic assessment were explained. Each subject’s voice was recorded in a sound-proof room at the speech laboratory with a noise level attenuated 35 dB or below. The subjects were positioned in a chair with their back straight.
For performing acoustic voice analysis, each individual was explained to produce a sustained phonation of the vowel /a/ three times at their conversational pitch and loudness for five seconds. The first and last seconds of each vowel phonation were removed from the analysis to rule out transient vocal changes during the onset and offset vocal periods, and only the more stable section of vowel production (three seconds in the middle) was submitted for analysis. The acoustic parameters of vowel phonations were extracted using Praat (version 5.4.08), including the mean F0, local shimmer (%), local jitter (%), and HNR (dB) (13).
The actors were then asked to read the standard sentences of the CAPE-V perceptual-auditory profile in the auditory-perceptual evaluation phase (18). Tasks in this profile included producing the sustained vowels /a/ and /i/, reading six standard sentences, and a continuous speech for 20 seconds. The first sentence contained the common vowels of the language, the second one included the easy onset, and the third one had the vowel consonants. The fourth sentence is designed to identify glottal closure, the fifth to identify nasality, and the last to evaluate intraoral pressure. All perceptual parameters were quantitatively graded using a 100-mm visual scale. The qualitative conclusion was also based on quantitative scores in the form of normal expressions, mild disorder, moderate disorder, and severe disorder. This study used the task of reading six standard sentences of this tool, and the results were reported quantitatively (18, 23).
Voice recording was done using a cardioid microphone (model AKGD5) with a frequency range of 20 to 20,000 Hz (24). The microphone was positioned about 10 cm from the right corner of the mouth at a 45-degree angle (9, 25). The microphone was connected to a handy recorder (Model: ZOOM H5, portable, Japan), and the voice samples were stored on the memory card. The sampling frequency of voice recording was 44 kHz with 16-bit precision, and the data were stored in WAV format.
3.3. Data Analysis
For acoustic analysis, the recorded voice samples were submitted to Praat software (version 5.4.08). The extracted parameters included the mean F0, local jitter, local shimmer, and harmonic-to-noise ratio. According to CAPE-V instructions, the perceptual judgment of voice quality was performed by two expert speech-language pathologists (SLPs) who had more than 10 years of experience in the field of voice and were blinded to subjects and tasks for auditory-perceptual voice evaluation. A Sony Laptop (model: VPCEE23FX, VAIO Notebook, Japan) with Sony headphones (Sony, model: MDR-ZX-310, Japan) (26) were given to raters to listen to the voice samples of theatre actors stored on the laptop in WAV format and perform rating based on the CAPE-V (18). The SLPs were only allowed to listen to the voice samples twice. Finally, an inter-rater reliability agreement was measured between the raters of each item CAPE-V. For a given subject and voice sample, the mean rate was reported for the subscales of perceptual-auditory evaluation if the inter-rater reliability reached a minimum of 80% agreement (27). Otherwise, another expert SLP in the field of voice would rate the voices as the third person.
3.4. Statistical Analysis
Pearson and Spearman correlation coefficients were used to investigate relationships between parametric and non-parametric data, respectively. The Kolmogorov-Smirnov test was applied for the normality analysis of data. The strength of correlations was interpreted as low (0.00 - 0.39), moderate (0.40 - 0.59), and high (0.60 - 1.00) (27). Statistical analyses were performed using SPSS software (version 22.0) (28). The level of statistical significance was P ≤ 0.05. The correction factors were used to control for type 1 error.
4. Results
4.1. Acoustic Parameters of Voice
The mean and standard deviation of the acoustic measures of voice, including the mean F0, local jitter, local shimmer, and HNR, are reported in Table 1. As can be seen in this table, female subjects produced the vowels at a higher pitch and HNR compared to males, whereas the male subjects showed a greater level of local jitter and local shimmer in their voice than females. The local jitter, local shimmer, and HNR for all participants (n = 45) were 0.306 ± 0.08, 1.96 ± 2.92, and 24.61 ± 2.92, respectively.
| Subjects | Mean F0 (HZ) | Local Jitter (%) | Local Shimmer (%) | Harmonic-to-Noise Ratio (dB) |
|---|---|---|---|---|
| Male (n = 23) | 114.906 ± 25.34 | 0.341 ± 0.10 | 2.869 ± 1.46 | 23.668 ± 3.36 |
| Female (n = 22) | 220.369 ± 26.48 | 0.270 ± 0.07 | 1.920 ± 0.75 | 25.608 ± 2.48 |
Acoustic Parameters of Participants (Mean ± SD)
4.2. Inter-rater Reliability Agreement of Raters for Auditory-Perceptual Measures
Krippendorff’s Alpha (0.95 confidence interval) for each auditory-perceptual parameter was calculated, and an agreement percentage was obtained between the two raters. The most agreement was for overall severity (92.7%), and the agreement percentage for strain (80.05%) was the least. The agreement percentage for other auditory-perceptual parameters included roughness (90.6%), breathiness (81.2%), pitch (87.4%), and loudness (80.01%).
4.3. Auditory-Perceptual Measures of Participants
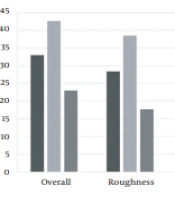
The mean and standard deviation of auditory-perceptual parameters of participants according to the results of CAPE-V characteristics, including the overall severity, roughness, breathiness, strain, pitch, and loudness, are reported in Table 2. The bar plot representation of this data is also shown in Figure 1. All the auditory-perceptual measures were greater in men than in women. Among the auditory-perceptual measures, the overall severity and the strain showed the highest mean scores across male and female subjects. Participants’ lowest mean of auditory-perceptual scores was observed for the loudness measure.
| Subjects | Overall Severity | Roughness | Breathiness | Strain | Pitch | Loudness |
|---|---|---|---|---|---|---|
| All (n = 45) | 33.00 ± 17.61 | 28.33 ± 17.53 | 18.72 ± 12.11 | 24.88 ± 14.55 | 6.00 ± 8.95 | 3.11 ± 6.24 |
| Male (n = 23) | 42.60 ± 16.33 | 38.47 ± 15.08 | 20.54 ± 12.38 | 30.00 ± 13.12 | 9.13 ± 10.40 | 4.78 ± 7.14 |
| Female (n = 22) | 22.95 ± 12.78 | 17.72 ± 13.22 | 16.81 ± 11.80 | 19.54 ± 14.32 | 2.72 ± 5.71 | 1.36 ± 4.67 |
Auditory-Perceptual Parameters of Participants Based on Consensus Auditory-Perceptual Evaluation of Voice (Mean ± SD)

Bar plot representation of auditory-perceptual measures in Iranian theater actors based on Consensus Auditory-Perceptual Evaluation of Voice
4.4. Relationship Between Acoustic and Auditory-Perceptual Measures of Voice
The results of the correlation analysis are reported in Table 3. As seen, the measure of overall severity on CAPE-V was negatively correlated with mean F0 (r = -0.592, P < 0.05) and HNR (r = -0.324, P < 0.05). The CAPE-V measure of roughness was also negatively correlated with mean F0 (r = -0.629, P < 0.05) and HNR (r = -0.322, P < 0.05), but showed a positive correlation with voice local jitter (r = 0.310, P < 0.05). In addition, the perceptual measure of pitch on CAPE-V was negatively correlated with the acoustic measure of voice mean F0 (r = -0.309, P < 0.05) and positively correlated with voice local jitter (r = 0.292, P = 0.050). The strongest correlation among these measures was between the roughness and the mean F0.
| Acoustic Measures | Auditory-Perceptual Parameters | |||||
|---|---|---|---|---|---|---|
| Mean F0 (Hz) | Overall | Breathiness | Roughness | Pitch | Loudness | Strain |
| r | -0.592 b | -0.205 b | -0.629 b | -0.309 b | -0.272 b | -0.300 b |
| P | 0.000 b | 0.100 b | 0.000 b | 0.039 b | 0.071 b | 0.030 b |
| Local jitter (%) | ||||||
| r | 0.238 b | 0.240 c | 0.310 c | 0.292 b | 0.222 b | -0.020 c |
| P | 0.115 b | 0.100 b | 0.031 b | 0.050 b | 0.144 b | 0.800 b |
| Local shimmer (%) | ||||||
| r | 0.254 b | 0.047 b | 0.172 b | 0.216 b | 0.095 b | 0.060 b |
| P | 0.093 b | 0.750 b | 0.207 b | 0.154 b | 0.535 b | 0.696 b |
| HNR (dB) | ||||||
| r | -0.324 b | -0.102 c | -0.322 c | -0.194 b | -0.251 b | -0.097 c |
| P | 0.030 b | 0.460 b | 0.031 b | 0.201 b | 0.096 b | 0.524 b |
Correlation Between the Auditory-Perceptual Parameters and Acoustic Measures of Voice in Participants a
5. Discussion
The present study specifically determined the relationship between auditory-perceptual parameters and acoustic measures of voice in Iranian theater actors. The findings revealed a significant correlation between the overall severity score of the auditory-perceptual assessment and the acoustic characteristics of voice mean F0 and HNR in Iranian theater actors. These findings are consistent with the literature (20-22, 29). It seems that the negative correlation between mean F0 and HNR with overall severity score could be explained by the direct relationship between the presence of oral severity and any vocal fold vibration irregularity, which may result from small edemas, vasodilation, fatigue, voice misuse, and abuse in professional voice users such as theater actors.
In the present study, the acoustic measurements of the mean F0 and HNR were significantly (and negatively) correlated with auditory-perceptual scores, which indicates the results parallel Mckenna and Stepp’s study (21). In another study by Khoddami and Salary Majd (20), subjects suffering from dysphonia performed vowel stretching and standard sentence reading tasks. The auditory-perceptual parameters of CAPE-V and acoustic voice measures were extracted to examine the relationship between these measures. Their findings revealed a significant correlation between all acoustic and auditory-perceptual measures except for voice mean F0 (20).
Awan et al. (29) studied healthy subjects and patients with dysphonia to examine the relationship between acoustic voice measurements and auditory-perceptual parameters. In that study (29), they used standard sentence reading and vowel /a/ phonation tasks for acoustic analysis combined with computerized speech laboratory (CSL). For the aim of this study, only the overall severity rating was used. Although different methodologies were used for data analysis in that study (29), their findings were consistent with the results of our research in showing a direct relationship between the acoustic and CAPE-V auditory-perceptual measures, specifically for the perceptual measure of overall severity and the acoustic measures of cepstral peak prominence (CPP), CPP SD, L/H spectral ratio, and L/H spectral ratio SD (29).
Moreover, Bhuta et al. (14) studied subjects with voice disorders, including different severities of dysphonia, to investigate the relationship between acoustic parameters and voice quality. Using the GRBAS profile for auditory-perceptual evaluation, they showed a significant correlation between the auditory-perceptual and acoustic parameters (14). The perceptual components of grade (G) and roughness (R) were significantly correlated with the noise-to-harmonics ratio (NHR).
The present study findings showed that two auditory-perceptual parameters, breathiness, and loudness, were not correlated with any measured acoustic parameters. This finding is in line with Bhuta et al. (14). However, Khoddami and Salary Majd (20) demonstrated that breathiness and loudness were significantly correlated with other acoustic parameters of voice except for voice mean F0. Also, in Vaz Freitas et al.’s (22) study, breathiness was identified as the measure with the strongest correlation with acoustic parameters. The present study revealed that roughness as an auditory-perceptual parameter was positively correlated with the local jitter and negatively correlated with the mean F0 and HNR. The HNR parameter was more specific in this study because it reflects the efficiency of voice, is directly related to voice quality, and is more sensitive than jitter for indexing vocal function (30, 31). These findings indicate that the higher level of voice roughness in the auditory-perceptual evaluation was associated with a greater increase in acoustical measures of voice local jitter and lower voice mean F0 and HNR.
Bhuta et al. (14) also showed a significant correlation between the auditory-perceptual measure of voice roughness and HNR. This pattern was also observed in the study by Khoddami and Salary Majd (20), but they did not find a significant correlation between voice roughness and mean F0 (20). Inconsistent with that study (20), the findings of the present study indicated that the strain was significantly correlated with voice mean F0, and in line with Bhuta et al.’s study (14), the strain did not have any relationship with other acoustic components including local jitter, local shimmer, and HNR.
These differences in correlation results between the present study and others are likely due to multiple factors, including the differences in the target population, perceptual assessment batteries, sample size, acoustic measurement and analysis methodologies, rater characteristics, and experimental design. Subjects tested in those other studies were primarily normal speakers or ones with voice disorders such as dysphonia who were all non-actors with no professional experience in using their voice during intensive theater practice and performance sessions. Previous studies have primarily used the vowel-stretching task for auditory-perceptual evaluation, whereas, in the present study, standard sentences of the CAPE-V task were used for that purpose. Although there is evidence of a high level of agreement between auditory-perceptual measures for the perceptual components of CAPE-V and GRBAS (32, 33), some studies have used different profiles of CAPE-V for auditory-perceptual evaluation, which may have accounted for the observed differences (14, 21). Using Dr. Speech, Multidimensional Voice Program Analysis (MDVP), and voice studio software for acoustic analysis of voice in previous studies can account for some disparity in the findings of other studies and ours. Lastly, the type of voice analysis methodologies between the present and prior studies may also explain the differences observed between our results and some data presented in previous studies (34).
5.1. Limitations
There were some possible limitations in this study. The first limitation was the small sample size due to the lack of more available subjects. Second, the primary acoustic parameters of voice were only investigated in this study due to a lack of access to professional acoustic instrumentation such as a Computerized Speech Lab (CSL).
5.2. Conclusions
The present study findings showed that mean F0 is one of the most critical acoustic parameters for determining the voice quality in Iranian theater actors. It was also found that local jitter and HNR account for the voice quality of Iranian theater actors. The findings revealed that the decrease in the acoustic measure of HNR was associated with an overall deterioration of voice quality for this group of professional voice users, as reflected by the increase in two components of auditory-perceptual tasks, including the roughness and overall severity. The interpretation of our finding is that Iranian theater actors apply voice and its frequency variations to perform their roles. Also, the acoustic parameters, including F0, jitter, and HNR, are affected by larynx function. Therefore, Iranian theater actors should receive voice training and vocal exercises before performances to prevent dysphonia and its complications on voice quality.
