1. Background
Road accidents are one of the most critical public health challenges worldwide. Despite the severity of injuries resulting from road accidents, they are often disregarded (1, 2). Currently, traffic accidents rank eighth among the most common causes of death globally, and projections suggest this will rise to fifth place by 2030. In addition to the staggering death toll of over 1.2 million people annually, around 50 million individuals sustain non-fatal injuries due to road accidents (3).
Given the significant number of deaths resulting from road accidents worldwide, the United Nations General Assembly designated 2011 to 2020 as the Decade of Road Safety Action, urging member states to adopt preventive measures to combat traffic accidents (4).
The Middle East and North Africa (MENA) region is among the areas where the rates and burden of road accidents are the highest (5). According to the World Health Organization's (WHO's) 2013 report, young people aged 15 to 30 years in low- and middle-income countries accounted for more than 30 percent of all deaths caused by road accidents (6). A study conducted on road traffic injury (RTI) mortality rates between 1995 and 2015 showed that these rates were higher than the global average in the Eastern Mediterranean Region (EMR), although there was a declining trend (7).
It has been suggested that human errors in driving are the most important causes of road accidents and their consequences (5, 8). Meanwhile, traffic safety projects typically focus more on the physical environment, vehicles, and drivers, paying less attention to drivers' behaviors (9). Increasing population growth, rising production and use of vehicles, changing lifestyles in the community, and lack of access to public transportation are among the root causes of traffic injuries (10, 11).
Due to the significant magnitude of fatalities and the resulting years of life lost (YLL), it is imperative to delve deeper into the issue of road accidents and present a comprehensive analysis of their prevalence and epidemiology. Given the scarcity of comprehensive research conducted in the MENA region and the need for valuable and purposeful insights, this study was undertaken to compare the burden of road accidents in the region from 1990 to 2019.
2. Objectives
The aim is to provide essential information to inform effective strategies and interventions to mitigate the impact of road accidents.
3. Methods
The study population for this research encompassed the MENA region, which consists of 21 countries in the MENA. These countries include Afghanistan, Algeria, Bahrain, Egypt, Iran, Iraq, Jordan, Kuwait, Lebanon, Libya, Morocco, Palestine, Oman, Qatar, Saudi Arabia, Sudan, Syria, Tunisia, Turkey, the United Arab Emirates, and Yemen. Collectively, these countries have a population of approximately 400 million individuals.
The data for this study were sourced from the Global Burden of Diseases (GBD) 2019 databases (https://ghdx.healthdata.org/gbd-2019). The GBD is a comprehensive and systematic global health assessment that provides estimates of causes of mortality, categorized by location, age, and sex for almost all countries and regions. It aims to determine the relative rates of disability-adjusted life years (DALY) attributable to diseases, injuries, and risk factors, incorporating systematic adjustments and uncertainty quantification. Furthermore, it aids in estimating life expectancy based on variables such as age, sex, and geographical location over time (12, 13). The GBD 2019 involved the collaboration of over 5,000 researchers from 152 countries and territories, as stated in the GBD reports. The GBD's conceptual and analytical framework, along with detailed methodologies, have been previously published in peer-reviewed journals (14, 15).
For this study, the researchers accessed the GBD 2019 dataset to extract data on road traffic accidents in the MENA region from 1990 to 2019. The GBD 2019 data provide comprehensive information on the incidence, prevalence, mortality, and DALY rates associated with road traffic accidents, which the researchers utilized to analyze the epidemiological trends and patterns in the MENA region over the 30-year period.
The GBD classifies traffic accidents as external causes of death, as defined in the international classification of diseases (ICD). Information regarding the causes of coded deaths was gathered from vital information registering systems (VIRS) and verbal autopsy reports (VAR). The VIRS collects birth and death information within the population and provides the most accurate cause of death. In situations where VIRS is unavailable, verbal autopsy is utilized as a method to classify deaths. Verbal autopsy involves trained interviewers who collect information on the deceased's symptoms and sociological data to determine the cause of death (16).
The GBD study employs advanced techniques such as VAR and VIRS to ensure the highest quality of data. To address variations in data quality, the GBD study applies data standardization methods, meticulously examines instances of inappropriate coding, and corrects inaccuracies. This includes correcting cases where impossible causes of death or unspecified underlying causes of death are erroneously recorded on death certificates. By implementing these measures, the GBD study aims to enhance the accuracy and reliability of the data used in its analyses.
In this study, we used incidence, prevalence, and DALY data extracted from the GBD study rather than calculating these metrics directly. Incidence refers to the estimated number of new cases of a disease or condition per unit of population over a given time period, as derived by the GBD study. Prevalence is the estimated number of existing cases of the disease or condition per unit of population, also estimated by the GBD study. The rates presented in the GBD are standardized to reflect the global population as a whole. For our study, we utilized data from the GBD 2019 to calculate key indicators such as DALYs, which capture years lived with disability (YLDs) and YLL. Additionally, we reported age-standardized incidence rates, age-standardized prevalence rates, and age-standardized death rates per 100,000 individuals. Microsoft Office Excel 2016 was used for the necessary calculations and analysis of the data.
4. Results
Table 1 shows the variations in the age-standardized incidence rate of road accidents per 100,000 population for both sexes across different countries in 2019. Notably, Palestine had the lowest rate at 438.53 (95% UI: 375.84 - 509.98), followed by the Syrian Arab Republic at 483.42 (95% UI: 415.13 - 565.64), and Lebanon at 493 (95% UI: 423.45 - 579.21). In contrast, Oman recorded the highest rate at 1415.14 (95% UI: 1240.3 - 1619.8), followed by Saudi Arabia at 1347.34 (95% UI: 1151.95 - 1538.06), and the United Arab Emirates (UAE) at 1155.36 (95% UI: 998.09 - 1332.19). For further details, please refer to Table 1.
| Country and Year | Incidence Rate of Road Injuries by ASR | Prevalence Rate of Road Injuries by ASR | Death Rate of Road Injuries by ASR | DALYs Rate of Road Injuries by ASR |
|---|---|---|---|---|
| Afghanistan | ||||
| 1990 | 659.88 (561.1 - 776.49) | 1975.66 (1822.23 - 2124.81) | 39.17 (28.95 - 48.33) | 2240.86 (1685.71 - 2772.66) |
| 2019 | 543.14 (452.77 - 641.21) | 1556.84 (1436.63 - 1674.12) | 26.58 (19.93 - 36.71) | 1432.69 (1087.96 - 1969.29) |
| Algeria | ||||
| 1990 | 1294.38 (1127.28 - 1496.91) | 3616.75 (3335.06 - 3872.54) | 61.69 (42.8 - 76.18) | 3336.19 (2477.97 - 4046.61) |
| 2019 | 869.17 (743.22 - 1003.38) | 2357.03 (2184.78 - 2517.65) | 27.92 (20.41 - 34.1) | 1422.84 (1114.13 - 1695.06) |
| Bahrain | ||||
| 1990 | 1031.93 (897.85 - 1186.05) | 2867.29 (2658.48 - 3080.62) | 28.19 (24.3 - 33.65) | 1435.55 (1265.31 - 1645.02) |
| 2019 | 741.4 (631.2 - 873.96) | 2021.19 (1869.96 - 2180.13) | 14.04 (11.1 - 18.15) | 744.49 (612.56 - 903.41) |
| Egypt | ||||
| 1990 | 958.77 (830.33 - 1105.48) | 2711.98 (2509.89 - 2888.23) | 56.1 (40.33 - 63.71) | 3005.09 (2211.48 - 3436.66) |
| 2019 | 837.36 (725.02 - 947.55) | 2282.58 (2108.05 - 2437.13) | 36 (23.21 - 48.18) | 1590.25 (1122.36 - 2068.13) |
| Global | ||||
| 1990 | 1192.7 (1017.76 - 1389.27) | 3387.22 (3135.99 - 3612.41) | 21.92 (20.65-23.86) | 1329.47 (1235.48-1435.89) |
| 2019 | 1298.55 (1092.23 - 1529.42) | 3425.18 (3181.54 - 3664.71) | 14.99 (13.29 - 16.32) | 917.94 (814.15 - 1011.37) |
| Iran | ||||
| 1990 | 1173.18 (985.64 - 1394.57) | 3305.23 (3056.68 - 3518.11) | 60.2 (51.18 - 65.89) | 3262.52 (2815.52 - 3635.35) |
| 2019 | 801.8 (670.08 - 961.05) | 2152.88 (1982.47 - 2303.67) | 25.44 (21.9 - 29.86) | 1302.09 (1147.38 - 1488.34) |
| Iraq | ||||
| 1990 | 746.91 (641.65 - 874.26) | 2096.58 (1944.03 - 2228.3) | 24.52 (20.46 - 29.31) | 1386.51 (1183.09 - 1638.39) |
| 2019 | 588.11 (504.35 - 678.93) | 1590.33 (1469.01 - 1699.15) | 15.19 (11.35 - 19.89) | 790.25 (613.84 - 1008.34) |
| Jordan | ||||
| 1990 | 769.46 (666.18 - 884.67) | 2143.17 (1986.47 - 2275.31) | 22.87 (19.59 - 26.59) | 1214.9 (1065.29 - 1384.21) |
| 2019 | 549.35 (470.41 - 635.7) | 1461.25 (1359.28 - 1554.73) | 12.71 (10.64 - 15.36) | 666.98 (568.6 - 781.68) |
| Kuwait | ||||
| 1990 | 1115.87 (977.25 - 1250.28) | 3059.51 (2836.29 - 3260.93) | 29.85 (25.92 - 32.47) | 1517.7 (1364.22 - 1641.34) |
| 2019 | 786.26 (698.52 - 888) | 2125.03 (1974.94 - 2266.75) | 16.26 (13.24 - 19.57) | 767.56 (649.96 - 900.67) |
| Lebanon | ||||
| 1990 | 574.87 (491.85 - 672.87) | 1596.58 (1479.04 - 1702.81) | 13.39 (10.72 - 16.27) | 740.22 (611.05 - 889.57) |
| 2019 | 493 (423.45 - 579.21) | 1279.86 (1181.89 - 1368.62) | 8.45 (6.54 - 10.3) | 467.85 (372.03 - 571.15) |
| Libya | ||||
| 1990 | 1191.54 (1041.25 - 1365.25) | 3345.58 (3105.91 - 3589.82) | 44.41 (30.09 - 54.39) | 2386.73 (1745.58 - 2876.31) |
| 2019 | 916.05 (798.07 - 1059.09) | 2487.59 (2309.58 - 2659.29) | 31.79 (21.59 - 41.43) | 1590.76 (1143.29 - 2023.98) |
| Morocco | ||||
| 1990 | 996.51 (858 - 1144.1) | 2850.42 (2627.07 - 3049.41) | 42.04 (27.11 - 51.23) | 2252.73 (1568.5 - 2708.41) |
| 2019 | 846.62 (733.49 - 981.62) | 2326.83 (2154.99 - 2492.51) | 26.41 (17.48 - 35.25) | 1280.56 (923.78 - 1726.22) |
| North Africa and Middle East | ||||
| 1990 | 939.35 (818.92 - 1077.33) | 2628.03 (2430.22 - 2795.84) | 42.97 (33.96 - 47.32) | 2336.72 (1919.06 - 2597.23) |
| 2019 | 768.97 (667.85 - 880.58) | 2073.17 (1912.82 - 2216.27) | 26.3 (21.04 - 30.75) | 1306.58 (1096.23 - 1509.14) |
| Oman | ||||
| 1990 | 1908.95 (1657.34 - 2178.6) | 5172.7 (4776.87 - 5565.53) | 109.33 (85.67 - 134.85) | 5317.31 (4261.11 - 6476.16) |
| 2019 | 1415.14 (1240.3 - 1619.8) | 3699.85 (3429.72 - 4001.48) | 55.73 (48.2 - 65.13) | 2533.14 (2248.58 - 2835.14) |
| Palestine | ||||
| 1990 | 525.48 (447.41 - 621.65) | 1430.81 (1328.02 - 1523.47) | 16.84 (13.07 - 20.76) | 939.41 (733.76 - 1150.29) |
| 2019 | 438.53 (375.84 -509.98) | 1176.55 (1097.17 - 1255.32) | 9.98 (8.29 - 11.68) | 506.97 (432.38 - 583.29) |
| Qatar | ||||
| 1990 | 1467.59 (1261.88 - 1678.54) | 4057.51 (3762 - 4345.68) | 61.19 (45.36 - 73.51) | 2963.24 (2342.33 - 3476.24) |
| 2019 | 933 (794.19 - 1084.41) | 2477.44 (2294.77 - 2664.99) | 34.09 (25.84 - 43.77) | 1463.73 (1168.48 - 1838.18) |
| Saudi Arabia | ||||
| 1990 | 1287.94 (1114.81 - 1475.26) | 3599.79 (3337.7 - 3854.93) | 65.51 (49.25 - 82.06) | 3071.12 (2395.93 - 3744.48) |
| 2019 | 1347.34 (1151.95 - 1538.06) | 3592.11 (3307.7 - 3875.13) | 58.22 (41.97 - 74.02) | 2626.3 (1976.6 - 3354.62) |
| Sudan | ||||
| 1990 | 657.63 (564.28 - 760.1) | 1893.17 (1744.46 - 2019.52) | 42.71 (32.39 - 52.84) | 2043.01 (1556.39 - 2675.7) |
| 2019 | 587.64 (508.34 - 686.12) | 1646.62 (1526.83 - 1757.3) | 26.21 (18.54 - 34.8) | 1121.69 (845.26 - 1470.33) |
| Syrian Arab Republic | ||||
| 1990 | 604.72 (521.66 - 701.67) | 1697.97 (1576.67 - 1804.41) | 19.99 (16.04 - 24) | 1062.06 (883.41 - 1261.81) |
| 2019 | 483.42 (415.13 - 565.64) | 1307.32 (1218.06 - 1389.35) | 14.49 (10.9 - 18.82) | 677.78 (539.42 - 859.28) |
| Tunisia | ||||
| 1990 | 979.24 (841.53 - 1118.81) | 2728.12 (2529.72 - 2909.86) | 30.56 (26.45 - 34.78) | 1696.7 (1499.75 - 1916.65) |
| 2019 | 883.31 (761.58 - 1025.8) | 2350.56 (2177.84 - 2513.96) | 20.32 (14.61 - 27.1) | 1034.83 (778.95 - 1325.56) |
| Turkey | ||||
| 1990 | 692.71 (596.49 - 799.13) | 1961.62 (1823.51 - 2082.01) | 15.52 (13.17 - 18.07) | 936.24 (796.78 - 1086.44) |
| 2019 | 592.01 (505.41 - 682.8) | 1558 (1441.14 - 1658.26) | 9.02 (7.05 - 10.98) | 508.91 (412.56 - 600.35) |
| UAE | ||||
| 1990 | 1461.33 (1274.1 - 1673.12) | 4051.62 (3755.24 - 4314.39) | 66.39 (47.43 - 86.89) | 2830.11 (2118.86 - 3582.42) |
| 2019 | 1155.36 (998.09 - 1332.19) | 3201.95 (2960.7 - 3437.45) | 43.66 (25.36 - 63.23) | 1837.62 (1174.08 - 2570.69) |
| Yemen | ||||
| 1990 | 934.36 (806.49 - 1086.9) | 2673.32 (2463.41 - 2858.63) | 66.11 (41.47 - 89.49) | 3510.37 (2233.19 - 4846.39) |
| 2019 | 789.19 (675.45 - 916.65) | 2212.47 (2040.47 - 2366.33) | 47.08 (31.72 - 62.71) | 2325.1 (1589.14 - 3038.28) |
The Comparison Between Road Accidents Burden in the World and MENA Regions 1990 and 2019
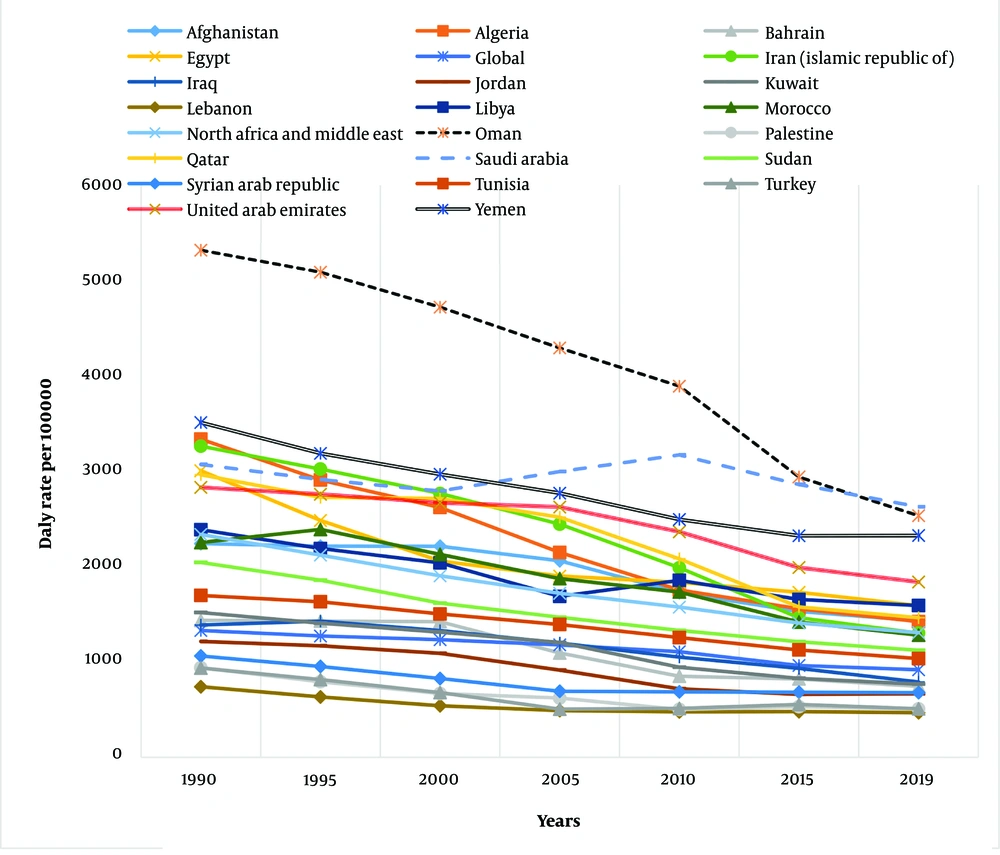
Between 1990 and 2019, there was a notable decline in the DALY rate for road traffic injuries (RTIs) globally as well as in the MENA region. However, it is important to highlight that the MENA region still exhibits higher DALY rates, at 1306.58 (95% UI: 1096.23 - 1509.14), compared to the global average of 917.94 (95% UI: 814.15 - 1011.37). In recent years, the disparity between the region and the global average has narrowed (Figure 1). Among the countries in the MENA region, Oman demonstrated the most substantial reduction in DALY rates associated with RTIs, while Saudi Arabia experienced the least reduction.
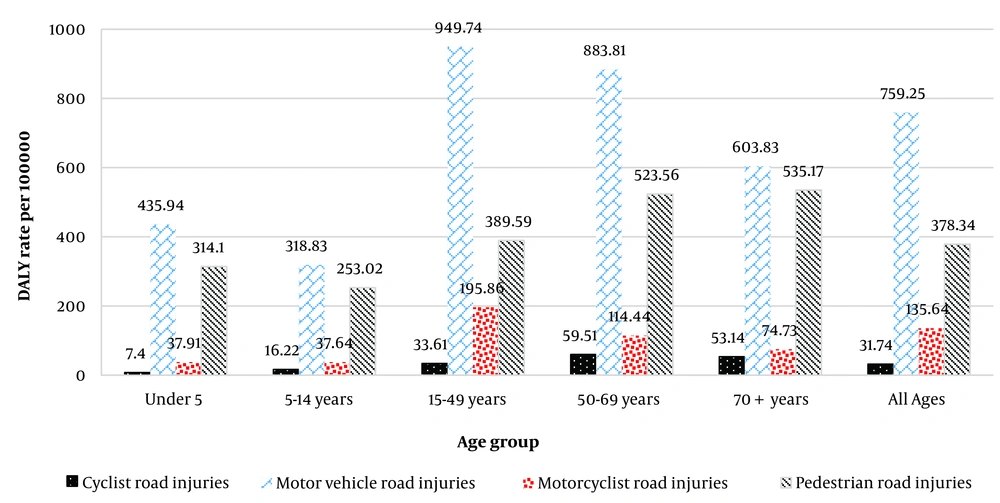
Between 1990 and 2019, RTIs in the MENA region declined across all age groups, with a particularly notable decrease in the 15 to 49-year age group. Among all age groups, the highest DALY rates for RTIs were observed in motor vehicle occupants, followed by pedestrians, motorcyclists, cyclists, and other categories, respectively. However, it is worth noting that, excluding the age group under 5 years, the DALY rates for RTIs increased with advancing age, peaking in the age group over 70 years (Figure 2).
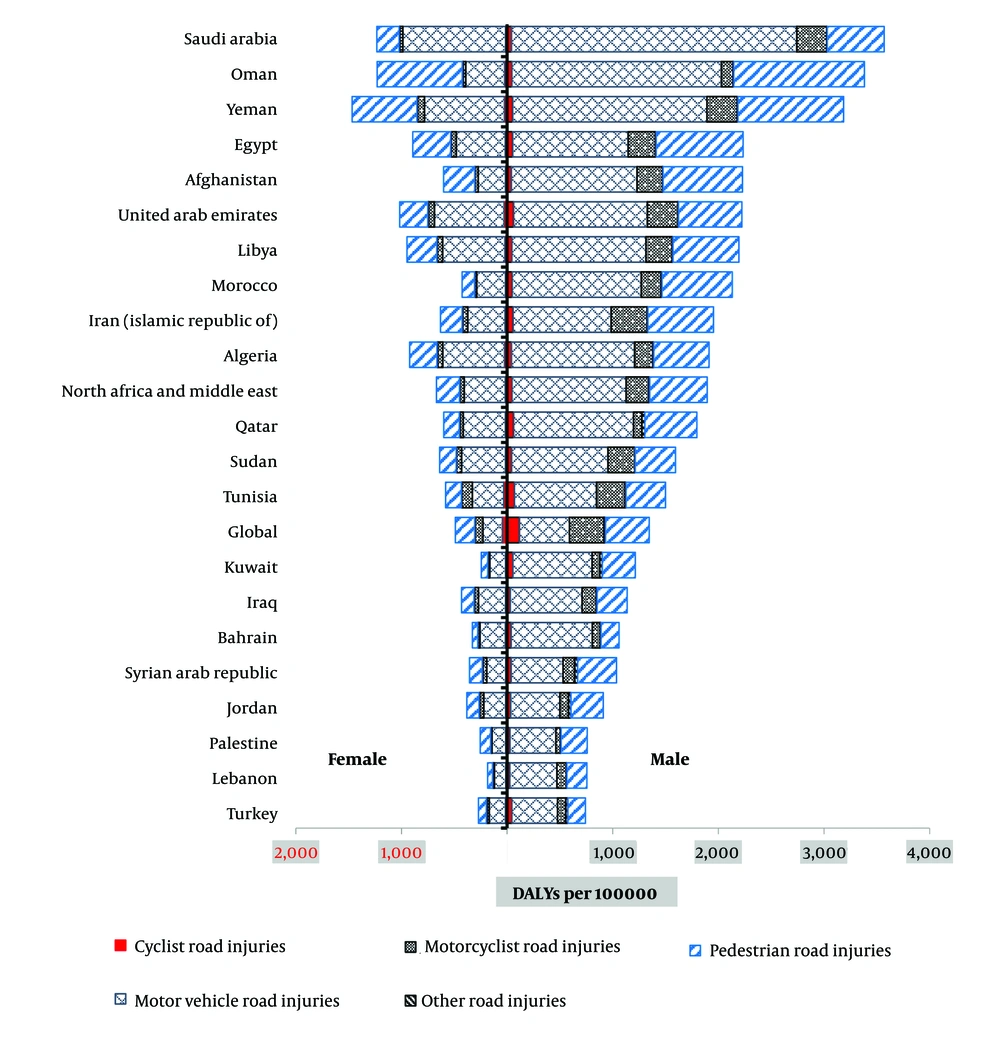
Between 1990 and 2019, the MENA region showed varying death rates from RTIs across different categories. Motor vehicle accidents accounted for the highest death rates, followed by pedestrian, motorcyclist, cyclist, and other road accidents, respectively. Notably, motor vehicles were associated with the highest incidence of RTIs, while motorcyclists had the lowest incidence. Specifically, Saudi Arabia recorded the highest death rate from motor vehicle-related road injuries at 46.7 per 100,000, followed by Oman at 25.5 per 100,000. For pedestrian road injuries, Oman had the highest death rate at 17.7 per 100,000, closely followed by Yemen at 12.95 per 100,000. More detailed information can be found in Figure 3.
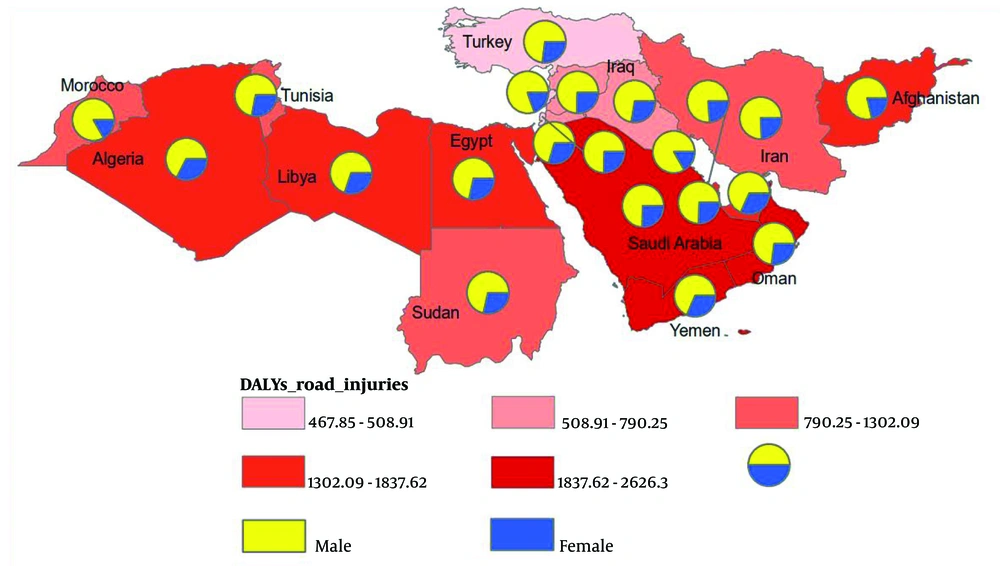
Consistent with global trends, the incidence and mortality rates of RTIs were more prevalent among men than women in countries across the MENA region between 1990 and 2019. Among the MENA countries, Afghanistan, the UAE, Yemen, and Oman recorded the highest DALY rates related to RTIs, respectively, as presented in Figure 4.
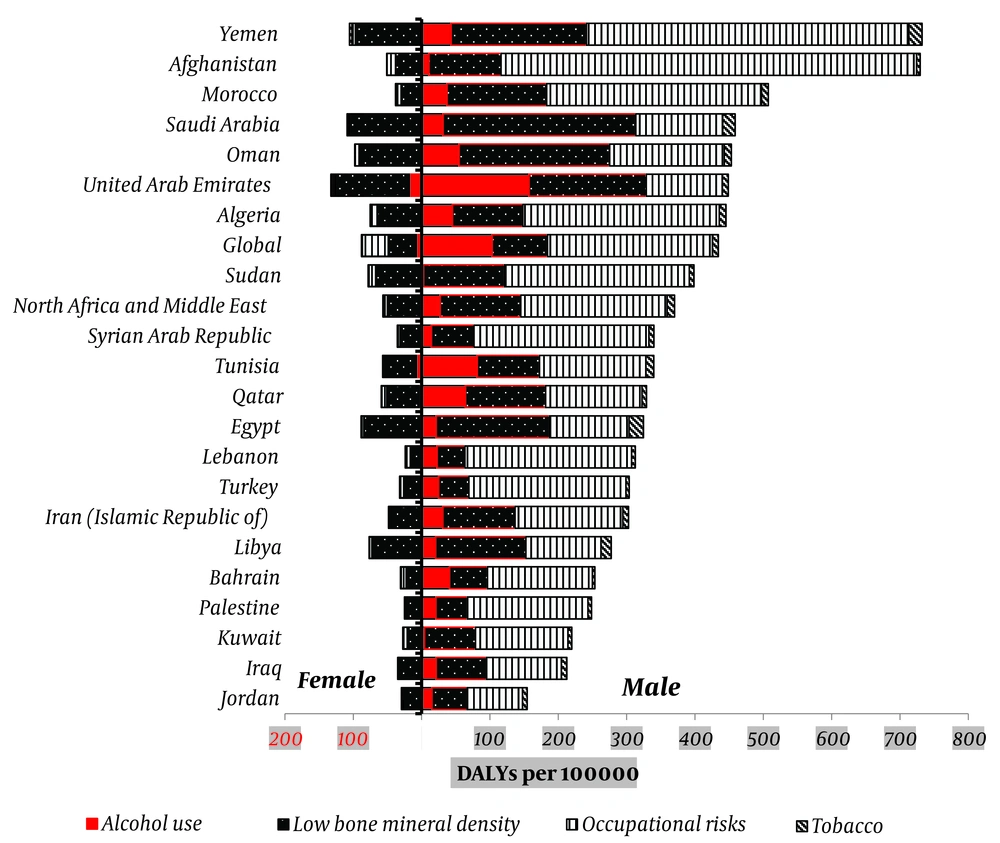
In MENA countries, the primary risk factors contributing to DALYs related to RTIs were occupational risks, alcohol consumption, low bone mineral density, and tobacco consumption. Specifically, the DALY rates associated with these risk factors were 115, 14.85, 84.5, and 5.89 per 100,000 population, respectively (Figure 5).
Afghanistan demonstrated a higher percentage of DALYs attributed to occupational risks, while the UAE exhibited a higher percentage of DALYs arising from alcohol consumption compared to other MENA countries. Notably, Iran is the only MENA country that has not reported alcohol consumption or occupational risk among women (Figure 5).
5. Discussion
Road accidents pose a serious burden to communities, leading to injuries, disabilities, fatalities, and significant economic and social problems (17). The trend of road accidents in the MENA region from 1990 to 2019 indicates that the incidence and prevalence of road accidents in these countries are higher than the global average.
Additionally, while the death rate and DALY have decreased both globally and in the MENA region during these years, they remain higher in the MENA region than the global average (Figure 1). Road accidents have increased due to factors such as population growth, an increase in vehicle production and usage, changes in lifestyle within communities, and an increase in risky behaviors among the general population (10, 11, 18).
Traffic accidents can be considered one of the most significant causes of death and disability (19). The high rate of fatal road accidents among young people can be attributed to high-risk and emotional behaviors such as speeding, overtaking, ignoring danger and warning signs on the roads, and talking on the cellphone while driving. Various studies have shown the impact of these factors on the occurrence of road accidents (20, 21). Other studies have also demonstrated the effect of seat belt use in reducing the number of deaths due to traffic accidents (22).
The UAE, Palestine, and Saudi Arabia show the highest percentage changes in the standardized incidence of road accidents between 1990 and 2019, while Oman, Iraq, and Syria show the lowest. However, in the study by Moradi et al. (23), Iran has the highest death rate in the Eastern Mediterranean region, and according to recent statistics, more than 18,000 people die annually in Iran due to RTIs, equivalent to 22 per 100,000 people in 2019 (24). Iraq and Oman follow, with the lowest death rates in this region reported in Bahrain and the UAE (23).
According to data from the WHO collected from 178 countries, traffic accidents are the ninth leading cause of death among all age groups and the third leading cause of death among those aged 5 - 44 (25, 26). Studies have shown that more than 90% of road accident deaths occur in low- and middle-income developing countries, even though they have only half of the world's vehicles (5). According to the GBD in 2010, traffic accidents ranked eighth worldwide in terms of the number of YLL due to premature death or disability (15).
Regarding the global number of deaths due to traffic accidents, the United Nations (UN) General Assembly designated 2011 - 2020 as the decade for road safety action and called on all member states to implement road accident prevention measures to reduce traffic accidents (6). In the countries of the MENA region, this issue is also a public health problem. In this study, the age trend of road accidents from 1990 to 2019 showed the highest rate in the 15 - 49 age group, with the highest rates of road accidents in all age groups related to motor vehicles, motorcycling, cycling, pedestrian accidents, and other methods, respectively. According to the WHO in 2013, 60% of deaths due to traffic accidents occurred in the 15 - 44 age group, which is considered the productive age group of society (6). In 2016, the highest percentage of deaths due to road injuries from motor vehicles was in the 20 - 24 age group. Additionally, the highest number of deaths related to motorcycling was in the 15 - 19 age group, followed by the 20 - 24 age group (27). Emotional and high-risk behaviors, low adherence to traffic rules and regulations, and high speeds can be the reasons for accidents in this group (28). Furthermore, 80% of deaths due to traffic accidents occurred in middle-income countries, while these countries account for 72% of the world's population and 52% of the world's total registered vehicles (6).
The results of this study showed that the incidence of road accidents in men is higher than in women, consistent with the global average. The WHO report also stated that out of every four people who lose their lives in road accidents, three are men and one is a woman (19). Another study also reported that, on average, the rate of fatal injuries in men was 24% higher than in women (27). Various studies in Turkey have shown that deaths from road accidents are significantly higher in men than in women (29, 30). The reasons for the higher prevalence of road accidents in men compared to women include more male drivers, higher speeds, more excitement, and less fear while driving (31). In addition, men wear seat belts less often than women. In contrast, women drive more slowly and cautiously and are more patient while driving (32).
Among the countries of the MENA region from 1990 to 2019, the most important risk factors attributable to DALYs due to road accidents were occupational risks, alcohol consumption, low bone mineral density, and tobacco consumption, accounting for 0.5%, 0.09%, 0.08%, and 0.01% of the total burden of diseases in this area, respectively. By country, the highest DALYs due to accidents were in Afghanistan, the UAE, Yemen, and Tunisia, where the share of occupational risks in Afghanistan and alcohol consumption in the UAE was higher than in other countries in the region. Among the countries in the region, Iran is the only country that did not report the DALYs related to road accidents attributed to the risk factors of alcohol consumption and occupational risk among women. In a study by Salmani et al. in Iran, high speed, haste, non-compliance with traffic rules, and driver drowsiness were the most important human factors, while alcohol and drug consumption and nervous problems were the least effective factors in accidents (33, 34). In some studies, alcohol consumption has been identified as the most important factor in road accidents (35).
5.1. Limitation
This study has several limitations. First, there are concerns about data quality since the study relied on the GBD project, which made extensive assumptions that may have reduced the validity and reliability of the findings. Second, the lack of individual-level data limited the ability to explore nuances in RTIs. Third, the study did not thoroughly examine the influence of social, economic, and cultural differences across the diverse MENA region. Fourth, the aggregated regional analysis may have obscured important country or subregional differences. Fifth, the study was limited in identifying specific risk factors contributing to the burden of RTIs in the MENA region. Lastly, the potential for underreporting of RTIs could have led to an underestimation of the true burden.
5.2. Conclusions
Despite efforts to reduce the number of deaths caused by road accidents, this study emphasizes the necessity for more comprehensive investigations into the principal factors contributing to such incidents. These factors include road conditions, human characteristics and behavior, physiological and mental capacities, vehicle capabilities and technical defects, as well as environmental and atmospheric conditions. Moreover, it is important to draw lessons from countries that have effectively tackled road accidents. Analyzing their approaches and strategies would provide valuable insights to guide future endeavors aimed at minimizing fatalities associated with road accidents.
