


1. Background
Technological advancements, demographic shifts, and lifestyle changes have led to increased healthcare expenditures, making access to healthcare services more challenging. The close connection between healthcare services and the socio-economic development of societies is well-recognized (1). Improving healthcare accessibility by reducing financial inequalities and increasing financial security for older adults is a crucial first step (2). The rapid rise in healthcare expenditures, driven by advancements in medical knowledge, technological innovations, and changing lifestyle and social structures, has placed significant financial strain on healthcare systems (3). Additionally, factors such as population growth and evolving healthcare needs, including the management of chronic diseases and aging populations, have made accessing healthcare services increasingly challenging for many communities in recent years (4).
Financial resources for these services are a critical issue in health economics. Investment in the healthcare sector is considered one of the most essential strategies for development and poverty reduction, and universal access to healthcare is shaped by economic analyses and the priorities of different societies, along with the mutual influence of government and society through healthcare investment (5). It has been demonstrated that the healthcare sector significantly impacts a community’s economic progress and, consequently, poverty reduction (6). When an individual’s health is threatened by the lack of essential health determinants and the medical care system and healthcare facilities — another key health determinant — are not accessible, this risk can lead to death or disability. Disability, as one of the outcomes of the absence of health determinants, has profound individual and social consequences such as limited social participation (7, 8).
According to the World Health Organization, over 1 billion people, or 15% of the global population, have some form of disability, with 80% of them living in low- and middle-income countries. The prevalence of disability is increasing due to factors such as aging, the rise in non-communicable diseases, lifestyle changes, and growing accidents, particularly in developing and low-income countries (9). Studies have shown that nearly 15% of the world’s older adult population suffers from significant disabilities due to age-related conditions and musculoskeletal disorders (10).
In addition to the healthcare needs of the general population, individuals with disabilities require a higher level of services known as rehabilitation services. These services encompass a wide range of interventions aimed at optimizing the functioning of individuals with disabilities. Rehabilitation services play a crucial role in preventing and minimizing the disabilities associated with chronic diseases and aging, such as the role of physiotherapy in preventing disability and promoting health (11). Therefore, with the growing prevalence of disabilities, aging, and injuries resulting from accidents (12) and disasters, rehabilitation services have become an essential component of national healthcare systems (13). The Global Burden of Disease study in 2019 revealed that 2.41 billion people worldwide could benefit from rehabilitation services, indicating that at least one in three people will require rehabilitation during their illness or injury. This finding challenges the traditional view of rehabilitation as a service for a small minority of the population (14).
Rehabilitation services, particularly when provided intensively and by specialists, lead to long-term or medium-term savings in healthcare and other sectors (15, 16). These services also reduce the indirect expenditure of ongoing care and support provided by families and communities (17). For example, a 2019 study by Mousavi et al. showed that rehabilitation services not only reduce medical expenditure and dependency on daily activities but also improve quality of life and reduce future expenditures, such as absenteeism from work. However, many patients discontinue rehabilitation services following initial medical treatment due to insufficient healthcare system support and inadequate insurance coverage. This decision can lead to greater problems for the patient and their family in the future (18).
Socioeconomic status (SES) plays a crucial role in creating disparities in rehabilitation expenditure, particularly for individuals with disabilities. A range of factors influences access to rehabilitation services, and numerous studies have explored the determinants of the use or non-use of these services (19). For example, a study in Ghana found that 76.3% of stroke patients did not use rehabilitation services due to economic barriers (20). In Iran, studies have also reported low utilization of rehabilitation services among individuals with disabilities (21). Another study in Iran revealed that socioeconomic factors play a critical role in determining access to rehabilitation services, with the Wealth Index identified as the most significant contributor to disparities. Specifically, 94.22% of the observed inequality in rehabilitation service utilization was attributed to wealth, indicating that individuals from higher SES groups had disproportionately better access compared to their lower SES counterparts (22).
Similar patterns are observed globally; for instance, in Peru, access to rehabilitation care is inequitable, with older adults and those with lower educational attainment experiencing higher disability burdens yet facing greater barriers to accessing necessary services. The findings underscore the urgent need for policy interventions aimed at enhancing financial protection and equitable access to rehabilitation services for all individuals, regardless of their SES (23). People with disabilities often have poorer health outcomes than those without disabilities. Despite their greater need for healthcare services, they face substantial barriers to accessing both healthcare and rehabilitation. This highlights the importance of focusing on disability as a significant issue (24, 25).
Studies indicate that individuals or households with insurance have better access to rehabilitation services in times of injury or aging compared to those without coverage. Additionally, socioeconomic inequalities significantly impact the use of these services. Research using indicators such as the Gini coefficient and Concentration Index has measured inequalities in healthcare expenditure. Findings show that poorer households bear a larger share of health expenses through out-of-pocket payments, while wealthier individuals are more likely to access health services (26-28).
Despite the growing demand for rehabilitation services, no studies in Iran have specifically analyzed the inequality in healthcare and rehabilitation expenditure among individuals with disabilities or related factors.
2. Objectives
Therefore, this study aims to fill this gap by analyzing disparities in the treatment and rehabilitation expenditure of individuals with disabilities in Iran.
3. Methods
3.1. Study Design
This quantitative descriptive-analytical study utilizes data from the 2020 survey conducted by Soltani et al. (25). Data collection was conducted at the national level through the Iranian Society for the Disabled, which has branches in all provinces of Iran and provides various educational, supportive, and cultural services to people with disabilities.
3.2. Data Collection
We used data from a previously conducted survey, which was collected through an electronic questionnaire. The questionnaire included questions about demographic information, SES, and health and disability conditions.
3.3. Participants
The study sample consisted of members of the Iranian Society for the Disabled, including 483 adults with physical disabilities, selected through convenience sampling.
3.4. Variables
The dependent variables in this study are healthcare expenditure (including outpatient services expenditure such as medical services, visits, and medicine) and rehabilitation expenditure (including rehabilitation services and assistive device expenditure). Outpatient healthcare expenditure refers to the amount households spent on these services in the month before completing the questionnaire. Rehabilitation and assistive device expenditure refer to expenditures over the past month on services and devices such as wheelchairs, orthopedic shoes, prosthetics, hearing aids, cochlear implants, etc. One month of outpatient healthcare expenditure was analyzed to minimize recall bias and ensure the accuracy of self-reported data.
The independent variables, based on the questionnaire, include age, gender, education level, marital status, insurance coverage type, employment status, monthly income, household size, and the number of individuals with disabilities in a household. Additional data used in this study includes questions related to expenses for medical and assistive devices (e.g., wheelchairs, hearing aids), income sources for paying healthcare and rehabilitation expenditures, and expenses for medications, healthcare, and rehabilitation services.
3.5. Data Analysis
Collected data was imported from Excel to Stata software for analysis. The Gini coefficient and Concentration Index were used to estimate socioeconomic inequalities.
The Gini coefficient measures differences among individuals or social groups ranked based on their health status by quantifying the relative share of the population in health outcomes. It is a widely used Inequality Index, especially among economists, but it has limitations. The Gini coefficient ranges from 0 to 1, where higher values indicate greater inequality. It is commonly recognized that a Gini Index of 0.4 - 0.5 corresponds with high income disparity (29). However, it cannot show the gradient of inequality, and when used for binary health variables, it is less effective in distinguishing between individuals with varying degrees of health status across socioeconomic groups (30).
The Concentration Index, first introduced by Wagstaff et al. in 1991, has been widely used to measure inequality in health and access to healthcare services. The Concentration Index has desirable properties such as the accuracy of measuring income-related inequality in the distribution of health variables and is easy to calculate (31). This index, based on the concentration curve, quantitatively shows the degree of inequality in health variables based on income distribution or SES. The concentration curve plots the percentage of the population, ranked by income or SES, on the x-axis, and the cumulative percentage of the health variable on the y-axis. If the curve lies below the diagonal, it indicates concentration of the health variable among higher socioeconomic classes, and if above, it indicates concentration among lower socioeconomic classes. The Concentration Index varies between +1 and -1, with negative values indicating that the health variable is concentrated among individuals with lower SES, and positive values indicating concentration among wealthier individuals. A zero value indicates complete equality in the distribution of the health variable (30, 32).
The Concentration Index can be calculated using the following formula (31, 33, 34).
Where CI is the Concentration Index, μ is the mean of the dependent variable, and ri and yi are the ranked socioeconomic variables for individuals.
4. Results
In this study, among the 483 participants, 61.08% were male and 38.92% were female. The average age of participants was 55.11 years, with a standard deviation of 14.96. Regarding employment status, 66.81% of the participants were unemployed. In terms of insurance coverage, the majority (45.09%) were covered by social security insurance. The average monthly income of the participants was reported to be 3,125,957 Iranian tomans (Table 1).
| Variables | Values a |
|---|---|
| Gender | |
| Male | 295 (61.08) |
| Female | 188 (38.92) |
| Age | 55.11 ± 14.96 |
| Education level | |
| High school | 189 (33.87) |
| Bachelor | 136 (24.37) |
| Middle school | 82 (14.70) |
| Masters | 50 (8.96) |
| Associate degree | 48 (8.60) |
| Elementary | 47 (8.42) |
| Ph.D | 6 (1.08) |
| Employment status | |
| Unemployed | 320 (66.81) |
| Worker (labor) | 36 (7.52) |
| Freelancer | 35 (7.31) |
| Employee | 30 (6.26) |
| Retired | 22 (4.59) |
| Other | 36 (7.52) |
| Marital status | |
| Single | 228 (47.50) |
| Married | 217 (45.21) |
| Divorced | 31 (6.46) |
| Deceased/widow | 4 (0.83) |
| Type of insurance coverage | |
| Social security | 202 (45.09) |
| Health insurance for other classes | 76 (16.96) |
| Health insurance | 66 (14.73) |
| Rural insurance | 36 (8.04) |
| Health insurance for government employees | 26 (5.80) |
| Armed forces | 16 (3.57) |
| Other | 26 (5.80) |
| Relief Committee | - |
| Income | 3125957 (4069310) |
a Values are expressed as No. (%) or mean ± SD.
The average total cost of 24,600,000 Iranian tomans (equivalent to 270.09 PPP US dollars) underscores the significant financial burden faced by individuals with disabilities. This amount encompasses all health and rehabilitation-related expenses. A comparison of the expenditure reveals that rehabilitation services and equipment constitute the largest portion of the total expenses, indicating a need for special attention to alleviate the financial pressure on these individuals. Healthcare and medication expenses also form important parts of the overall expenditure, which must be addressed (Table 2).
| Variables | Mean (PPP$ US) |
|---|---|
| Total expenditure | 24600000 (270.09) |
| Healthcare expenditure | 3134284 (34.41) |
| insurance expenditure | 278504 (3.06) |
| Visit expenditure | 318378 (3.50) |
| Medicine expenditure | 2708365 (29.74) |
| Rehabilitation expenditure | 3175600 (34.87) |
| Rehabilitation equipment expenditure | 8236840 (90.43) |
| Inpatient expenditure | 1567446 (17.21) |
4.1. Gini Coefficient Results
The analysis of the Gini coefficient for various expenditures reveals significant inequality in the distribution of these expenses. The Gini coefficient ranges from 0 to 1, with values closer to 1 indicating greater inequality in the distribution of expenditure. The results of the analysis are as follows:
- A Gini coefficient of 0.901 indicates severe inequality in the distribution of total expenditure.
- A high Gini coefficient in the rehabilitation and rehabilitation equipment sectors reflects significant inequality in rehabilitation expenses.
- Inequality is also high in the distribution of healthcare expenditure, demonstrating that access to healthcare services and the expenses associated with them are unequally distributed among individuals.
- There is also a high Gini coefficient in insurance-related expenditure, highlighting significant inequality in insurance expenses. This suggests large disparities in insurance coverage and payments among different individuals.
These inequalities indicate that the expenditure for some individuals is extremely high, while others face much lower expenses (Table 3).
| Type of Expenditure | Gini Coefficient |
|---|---|
| Total expenditure | 0.901 |
| Health expenditure | 0.848 |
| insurance expenditure | 0.887 |
| Visit expenditure | 0.803 |
| Medicine expenditure | 0.892 |
| Rehabilitation expenditure | 0.981 |
| Rehabilitation equipment expenditure | 0.894 |
| Inpatient expenditure | 0.981 |
The extracted Lorenz curve also illustrates these inequalities. A comparison of the Gini coefficients calculated in Table 3 indicates that the inequality in rehabilitation expenditure is greater than that observed in other expenses. Additionally, inequality in hospitalization expenditure ranks second, following rehabilitation expenditure, indicating a significant disparity in this area as well (Figure 1).

Lorenz curve
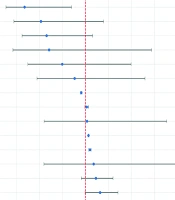
Table 4 presents the Concentration Index for healthcare expenditure and types of health services based on income and educational quintiles, weighted by county. The cumulative index of total expenditure based on income and educational quintiles is significant. However, the index based on income is positive, indicating that the concentration of inequality favors higher-income groups. Conversely, the index based on educational quintiles favors individuals with lower educational levels. Regarding rehabilitation expenditure and expenses for rehabilitation equipment, this index does not show a significant correlation (Table 4 and Figure 2).
| Type of Expenditure | Education Level (P-Value) | Income (P-Value) |
|---|---|---|
| Total expenditure | -0.519 (0.011) a | 0.514 (0.022) a |
| Health expenditure | -0.005 (0.960) | -0.088 (0.340) |
| insurance expenditure | 0.163 (0.102) | -0.055 (0.565) |
| Visit expenditure | 0.004 (0.614) | -0.019 (0.061) |
| Medicine expenditure | 0.127 (0.623) | -0.261 (0.349) |
| Rehabilitation expenditure | -0.202 (0.309) | 0.185 (0.102) |
| Rehabilitation equipment expenditure | -0.033 (0.781) | -0.027 (0.797) |
a P < 0.05 was considered statistically significant.

Concentration curve
5. Discussion
The present study aimed to examine socio-economic inequalities in healthcare and rehabilitation expenditures for individuals with disabilities in Iran. The findings reveal a significant economic burden on people with disabilities when accessing healthcare and rehabilitation services, with 66.81% of the participants being unemployed. According to the United Nations, unemployment rates for persons with disabilities in low- and middle-income countries can be as high as 60% - 90% (35).
Individuals with disabilities are forced to spend up to seven times their income on healthcare and rehabilitation expenses. A study in Korea showed that households with a disabled member experience significantly higher catastrophic health expenditures, allocating approximately 1.2 to 1.4 times more of their annual living expenses to out-of-pocket medical costs compared to households without individuals with disabilities (36).
Unfortunately, individuals with disabilities in Iran face disparities in access to services across various domains, effectively rendering them second-class citizens (37). A Gini coefficient of 0.901 reflects this inequality. Additionally, the high inequality in healthcare expenses indicates that access to health services and associated costs are unevenly distributed among individuals, with a positive income-based index favoring higher-income groups.
Furthermore, a high Gini coefficient for rehabilitation services and equipment indicates substantial inequality in rehabilitation-related expenses. The high costs of healthcare and rehabilitation services, as confirmed by previous studies, combined with inadequate insurance coverage, have placed a heavy financial burden on individuals with disabilities. As a result, they are forced to cover a significant portion of these costs out-of-pocket, leading to substantial financial challenges (38, 39). Research by Aarabi et al. demonstrated that individuals with autism spectrum disorders face various challenges in accessing rehabilitation services, with high service expenditures and inadequate insurance coverage being among the most significant (40).
The study's findings emphasize the substantial costs of pharmaceuticals and healthcare, as well as significant disparities in their distribution among individuals with disabilities. National health accounts data from Iran also confirm that the highest share of healthcare expenditures is allocated to treatment services, medications, and other medical supplies distributed to patients (41).
The high Gini coefficient indicates that rehabilitation expenditures exhibit the most pronounced level of inequality, highlighting disparities in the financial burden among individuals with disabilities. Research by Yahyavi et al. also showed that inequality in access to rehabilitation services favors wealthier individuals, with low-income households facing greater challenges in obtaining these services. These findings align with the results of our study. Integrating rehabilitation services into the basic health insurance package, implementing appropriate pricing strategies, expanding demographic coverage, and ensuring the equitable distribution of rehabilitation service centers in both public and private sectors could improve equity in access to rehabilitation services (15).
The high Gini coefficient observed in insurance expenditure complicates the landscape of healthcare access, reflecting significant disparities in insurance coverage and payments. This imbalance may lead to unequal access to rehabilitation services, as individuals with inadequate insurance coverage often face substantial out-of-pocket expenses, limiting their ability to afford essential treatments (42). This issue could create a cycle of inequality in which those most in need of rehabilitation have the least financial capability, perpetuating health disparities among socioeconomic groups.
Significant inequality in rehabilitation expenditure suggests that access to these essential services is strongly influenced by SES. Individuals with lower incomes may struggle to afford necessary rehabilitation, potentially leading to worse health outcomes and prolonged recovery times. Studies have shown that high healthcare costs can discourage individuals from seeking care, resulting in unmet health needs and exacerbating existing health disparities (43).
Based on the results of the present study, inequality in rehabilitation service expenditure did not show a significant relationship. However, the Concentration Index of rehabilitation expenditure was measured in another study by Soltani et al., which reported a significant value of -0.22. Similar to our findings, their research identified the wealth index as the primary factor contributing to socioeconomic inequalities (44).
The overall expenditure Concentration Index based on education level was negative and significant. Lower education levels are often associated with poorer health literacy, which can hinder individuals' ability to effectively navigate the healthcare system. Those with less education may not only utilize fewer healthcare services but also incur higher expenditures due to delays in care. This dynamic can worsen existing inequalities, as individuals with lower educational backgrounds may encounter more barriers to accessing necessary rehabilitation services and equipment (45).
The positive cumulative index of total expenditure and medication expenses by income indicates that higher-income groups disproportionately benefit from healthcare and rehabilitation expenditures. Research by Soltani et al. demonstrated that the use of rehabilitation services is predominantly concentrated among individuals with higher SES. Given that rehabilitation services have weak insurance coverage in Iran, individuals in lower socioeconomic groups face financial difficulties in accessing these services. Financial challenges remain one of the primary barriers to healthcare access for individuals with disabilities in Iran (44).
The highlighted inequalities and challenges underscore the urgent need for a comprehensive and foundational approach to address the issues faced by individuals with disabilities. Resolving rehabilitation service provision challenges in the country is essential to reducing disparities and enhancing access to services (46).
5.1. Conclusions
The findings reveal a significant level of inequality in healthcare and rehabilitation expenditure for individuals with disabilities. These expenses are often high and can be particularly burdensome for this population, many of whom face challenges related to inadequate education and limited income. As a result, they encounter substantial barriers to accessing essential services, ultimately leading to poor health outcomes. The deprivation of necessary healthcare and rehabilitation services, combined with inequalities in payment and service accessibility, undermines the health system’s ability to achieve the goal of universal health coverage. This highlights the urgent need for targeted policy interventions aimed at reducing financial barriers and ensuring equitable access to rehabilitation services for all socioeconomic groups. Implementing such measures would contribute to improved health outcomes and a better quality of life for individuals with disabilities.
