


1. Background
Restoration of the functioning of the digit following flexor tendon injury is still one of the important challenges in hand surgery, as outcomes are influenced by numerous factors, including adhesion formation, scar tissue development, and the type and zone of injury (1). Flexor tendon injuries often result in poor outcomes and functional limitations of the hand, leading to negative consequences for the individual’s independence and quality of life (2). The flexor tendons of the hand have a complex structure. The zone classification of flexor tendons divides the hand into five zones based on anatomical location. Zone 1 is distal to the flexor digitorum superficialis (FDS) insertion, and zone 2 is located between the A1 pulley and the insertion of the FDS. In zone 2, FDP and FDS are in the same tendon sheath (3). Zone 2 is historically referred to as "no man’s land" due to the complexity of achieving successful repairs and rehabilitation outcomes (4).
Although evidence supports various surgical approaches and rehabilitation protocols for zones 1 and 2 injuries, ongoing debate persists regarding the optimal approach to achieve the best possible functional recovery (5-8). Despite many reports on various rehabilitation protocols, there is a notable lack of comparative research evaluating early passive versus early active motion protocols (7). This gap in the literature has contributed to a persistent debate regarding which protocol yields superior outcomes (9). Early motion protocols have been experimentally shown to promote tendon healing and reduce adhesion (10). Kleinert et al. recommended a passive flexion-active extension regimen as one of the postoperative rehabilitation protocols. The literature has supported that early passive motion can prevent adhesion and improve tendon excursion (11-14). Early active motion was introduced by Small et al. (as cited by Bainbridge et al.) (15), which has been recognized as an important rehabilitation program for several decades (16). Other authors, such as Lee et al., have reported that early active motion protocols lead to greater articular movement through effective tendon gliding and reduced adhesion (14). Although there are many rehabilitation protocols for postoperative management of flexor tendon injury, each one has its strengths and limitations.
Assessment of the effect of hand injury on activity and participation is extremely important, as these comprise a significant part of the postoperative functional outcomes. Based on the evidence, it has been suggested that research in the field of flexor tendon rehabilitation, which includes outcome measures addressing limitations in activity and participation, would be beneficial for hand therapy (17). In a recent study, Williams et al. recommended that using patient-reported questionnaires can provide a better understanding of recovery in patients with finger flexor tendon injuries (18). However, existing randomized controlled trials (RCTs) comparing early active and passive motion protocols in zones 1 and 2 remain limited (8, 19), and the effects of these protocols on occupational performance and patient satisfaction with occupational performance, measured through patient-reported outcomes (PROs), have not been sufficiently explored as primary outcomes.
2. Objectives
To address these gaps, the current pilot RCT aims to compare the effectiveness of the early active motion protocol versus the early passive motion protocol in improving hand function and satisfaction in individuals with flexor tendon injuries in zones 1 and 2.
3. Methods
3.1. Study Design
The present pilot double-blind (patients and assessor) randomized clinical trial study (parallel design, with a 1:1 allocation ratio) was conducted in a university hospital (specializing in reparative surgeries) and approved by the Ethics Committee of Iran University of Medical Sciences, Tehran, Iran (IR.IUMS.FMD.REC 1396.9511355005) and registered in the Iranian Registry of Clinical Trials (IRCT20150721023277N7).
3.2. Sampling and Randomization
Sampling began in August 2018 and ended in September 2019. Patients with flexor tendon injury enrolled in the study based on inclusion criteria. The inclusion criteria were: Sharp tendon injury without crushing of the soft tissue, flexor tendon repair in zones 1 and 2, repair of FDS and FDP at the same time, surgery with 4-strand repair method using Prolene 4.0 thread, elapse of 2 to 4 days since surgery, ages 12 years and up, with no concomitant injuries (pulley repair, fracture of the same limb, extensor tendon injury in the digit), no psychiatric problems (causing non-cooperation with treatment protocols based on medical reports and interviews with the patients and caregivers), score of 21 and above in mini-mental status examination (MMSE score ≥ 21); initial tendon repair without the need for tendon transfer or graft; no neurological (e.g., stroke, dementia, Parkinson’s disease) or orthopedic diseases (e.g., arthritis) based on medical reports. The exclusion criteria were unwillingness to continue cooperation, infection, or other problems requiring medical procedures during the rehabilitation phase.
Participants were randomly assigned to either the early active or early passive motion groups using the random numbers table method. A statistical consultant generated the random allocation sequence. The sequentially numbered, sealed, opaque envelopes method was used for allocation concealment. The allocation ratio was 1:1.
Based on the acceptable sample size for pilot RCT studies, which suggests a range of 10 to 75 participants per group, this study allocated 15 participants to each group (n = 30) (20). All participants signed a consent form before starting treatment. Although necessary explanations about therapy sessions and exercises were discussed with the patients, all study participants were blind to the treatment protocols, and therapy sessions took place on different days to avoid unmasking.
3.3. Procedures
The Modified Duran protocol was implemented in the early passive motion group, and the Strickland/Cannon protocol in the early active motion group by two occupational therapists with master’s degrees and special experience in the field of hand injuries (the first author for early active and the third author for early passive motion group). Interventions were based on standard protocols presented in the literature (21-23), and all participants received written instructions plus videos of home exercises. Due to collaboration between hand surgeons, occupational therapists, and patients, and therapists’ availability for responding to patients’ questions via phone calls and virtual social networks, none of the patients was absent during therapy sessions and follow-up. The interventions were implemented for eight weeks, three sessions per week with a 45-minute duration for each session, followed by a follow-up at fourteen weeks.
In the present study, occupational performance and satisfaction, as well as hand function, were considered as primary outcomes, whereas pain, hand disability, hand dexterity, grip and pinch strength, and total active motion (TAM) were assumed as secondary outcomes. Before the implementation of rehabilitation protocols, pain was assessed using the Visual Analog Scale (VAS) (24); hand function was measured by the Michigan Hand Outcomes Questionnaire (MHQ) (25, 26); hand disability was measured by the Disabilities of the Arm, Shoulder, and Hand Outcome Questionnaire (DASH) (27-29); and occupational performance and satisfaction were assessed using the Canadian occupational performance measure (COPM) (30, 31). Additionally, after the intervention (week 8) and follow-up period (week 14), the range of motion (TAM) was assessed using a goniometer; dexterity was assessed using the box and block test (BBT) and Purdue Pegboard test (PPT) (32, 33), and power grip and pinch tests (34). All assessments were carried out in random order. An occupational therapist with a master’s degree conducted all assessments and was blind to the study participants and protocols.
3.4. Modified Duran Protocol
The dorsal blocking splint (DBS), which made by the occupational therapist, placed the wrist at 20 degrees flexion, the metacarpophalangeal at 50 degrees flexion, and the interphalangeal joint at 0 degrees (Figure S1 in Appendix 1 in the Supplementary File). The subject performed passive flexion and active extension exercises of the metacarpophalangeal and phalangeal joints individually and in combination, and passive flexion and active extension of each joint with 15 repetitions every two hours (while other joints were fully blocked in flexion). After three weeks, the splint was removed during the day but used at night for two more weeks. Wrist active flexion and digits active extension and flexion began in week 4, blocking exercises and light daily activities in week 6, passive extension and static corrective splint in week 7, and progressive resistance exercises in week 8 (22).
3.5. Strickland/Cannon Protocol
Two splints which made by the occupational therapist using thermoplastic material, were used in this protocol: (1) The DBS that placed the wrist at 20 degrees flexion, the metacarpophalangeal at 50 degrees flexion, and the interphalangeal at full extension, which was worn most of the time; (2) a tenodesis splint that allowed full flexion of the wrist, MP, and IP joints, but restricted wrist extension to 30 degrees, MP to 60 degrees, and IP to 25 degrees (Figure S2 in Appendix 1 in the Supplementary File). This was an exercise splint, and the subject wore it for hourly exercises. During weeks 1- 4, the subject performed modified Duran protocol exercises in the DBS every hour with 15 repetitions. Moreover, the DBS was replaced every hour with the tenodesis splint, with which the patient actively extended his wrist to 30 degrees (as allowed by the splint). His/her digits were taken into flexion by the therapist or his/her other hand, and this position was maintained for 5 seconds through gentle muscle contraction (place and hold). After relaxing the digits, the patient placed his wrist in flexion to extend the digits to the angle allowed by the splint (tenodesis exercise). This exercise was repeated 25 times every hour. The exercise splint was removed between weeks 4 and 7 or 8. However, the DBS was worn (except during exercises), and exercises were performed every two hours, but with digits in active flexion. Active flexion and extension of the digits and wrist were performed, and the patient was advised to refrain from simultaneous extension of the wrist and digits. In week 5, active flexion of IP joints was carried out while MP joints were in extension, allowing for full extension of the digits. Blocking exercises began in week 6, passive extension and static corrective splint in week 7 (if required), power exercises in week 8, and unrestricted use of the hand in week 14 (22, 23).
3.6. Data Collection Tools
For data collection, a goniometer, VAS, BBT, PPT, dynamometer, and pinch gauge were used to measure ROM (TAM), pain, dexterity, grip, and pinch strength, respectively (Appendix 1 in the Supplementary File). The COPM, MHQ, and DASH were used as PROs, explained below.
3.6.1. Canadian Occupational Performance Measure
Assessing occupational performance and satisfaction is integral to understanding the holistic impact of flexor tendon repair. The COPM provided a client-centered approach to evaluating self-perceived changes in performance and satisfaction with daily activities. This instrument allowed participants to express their priorities and experiences, adding a qualitative dimension to the overall assessment. The COPM contributed valuable insights into the participants’ perspectives on their functional recovery. In a semi-structured interview, the client identifies up to five occupational issues in the areas of self-care, productivity, and leisure. For each identified issue, the client rates performance and satisfaction on a scale of 1 to 10, where 1 means "not able to do it at all" and 10 means "able to do it extremely well" (31). The psychometric properties have been investigated in the Iranian population. The test-retest reliability was (r = 0.80) for performance and (r = 0.84) for satisfaction (30) in the Iranian elderly population. The content validity of the Persian version demonstrated a high level (80.95 ± 0.222) (35).
3.6.2. Michigan Hand Outcomes Questionnaire
To assess the multifaceted aspects of hand function, the MHQ was employed. This validated instrument offered a structured approach to evaluating hand function, encompassing daily activities, work-related tasks, and overall hand health. The MHQ provided a comprehensive perspective on the functional outcomes of flexor tendon repair, offering insights into the impact on various dimensions of hand performance and quality of life. Five of the six MHQ domains [overall hand function, activities of daily living (ADLs), work performance, aesthetics, and patient satisfaction] are scored from 0 - 100, in which 100 is the best possible ability. The pain domain is scored from 0 - 100, where 0 indicates no pain (25). The questionnaire was translated into Persian, and its psychometric properties were tested. Good internal consistency (Cronbach’s alpha = 0.79) and high test-retest reliability (ICC = 0.84) for the total MHQ were reported among the Persian population with hand and wrist disorders (26).
3.6.3. Disabilities of the Arm, Shoulder, and Hand Outcome Questionnaire
Measuring disability is crucial in understanding the broader implications of flexor tendon injuries. The DASH served as a standardized tool to capture the multifaceted aspects of disability, including physical limitations and the impact on daily activities. By employing the DASH, the study aimed to quantify and compare disability levels among participants, contributing to a nuanced assessment of the effectiveness of different rehabilitation protocols. The DASH is a 30-item self-reported questionnaire scored using 5-point Likert scales. The scoring range is from 0 (no disability) to 100 (most severe disability), determined by a specific formula (36). The Persian version of DASH showed excellent test-retest reliability (ICC = 0.82). Cronbach’s alpha coefficient was reported as 0.96 for Persian-speaking patients with upper extremity disorders (26).
3.7. Statistical Analysis
The normal distribution of data was assessed using the Shapiro-Wilk test. The data for PPT (injured hand, bilateral, and assembly), BBT, power grip, and TAM (based on ASSH and Strickland methods) had a normal distribution. In contrast, the COPM (performance and satisfaction), MHQ (total and all subscales), DASH, VAS, and pinch grip data did not. Therefore, before conducting the statistical analysis, logarithmic transformation was applied to these data. As there were no missing data in the present study, the per-protocol analysis method was used, and the intention-to-treat approach was not applicable.
Occupational performance and satisfaction, hand function, hand disability, and pain were assessed using a 2 × 3 mixed repeated measures analysis of variance with active and passive motion groups as intra-factors and time (before intervention, eight weeks after intervention, and follow-up) as inter-factors. Hand dexterity, TAM, power grip, and pinch were assessed using a 2 × 2 repeated measures analysis of variance with active and passive motion groups as intra-factors and occasion (after therapy and follow-up) as inter-factors. Multiple comparisons were carried out using the Tukey multiple comparison post hoc test. The effect size was determined using partial eta-squared (η2), where values of 0.010, 0.06, and 0.14 indicate small, moderate, and large effect sizes, respectively. A significance level of 0.05 was used.
4. Results
The passive motion group included 15 patients with 27 injured digits, and the active motion group included 15 patients with 21 injured digits. The age range of patients was 15 to 63 years (mean 32.53 ± 12.89) in the passive motion group and 18 to 50 years (mean 32.60 ± 10.04) in the active motion group. The patients’ demographic and clinical details are shown in Table 1. The CONSORT flowchart (Figure 1) visually outlines the study’s progression, providing a comprehensive overview of participant allocation, interventions, follow-up, and data analysis. No significant differences were observed between the two groups (early active and passive motion) in terms of age, gender, dominant hand, injured digit, time between injury and surgery, and injured zone (P > 0.05).
| Variables | Active Group | Passive Group | P-Value |
|---|---|---|---|
| Sex | > 0.99 | ||
| Male | 12 (80) | 12 (80) | |
| Female | 3 (20) | 3 (20) | |
| Dominant hand | > 0.99 | ||
| Right | 15 (100) | 15 (100) | |
| Left | 0 (0) | 0 (0) | |
| Injured hand | > 0.99 | ||
| Right | 9 (60) | 9 (60) | |
| Left | 6 (40) | 6 (40) | |
| Impaired digit | 0.69 | ||
| Index | 7 (33.33) | 8 (29.63) | |
| Middle | 7 (33.33) | 8 (29.63) | |
| Ring | 4 (19.05) | 4 (14.81) | |
| Little | 3 (14.29) | 7 (25.93) | |
| Zone of injury | 0.62 | ||
| I | 3 (20) | 2 (13.33) | |
| II | 12 (80) | 13 (86.67) | |
| Digital nerve injury | 0.44 | ||
| Yes | 4 (26.67) | 6 (60) | |
| No | 11 (73.33) | 9 (40) | |
| Smokers | 0.12 | ||
| Yes | 3 (20) | 7 (46.67) | |
| No | 12 (80) | 8 (53.33) | |
| Age (y) | 32.60 ± 10.04 | 32.53 ± 12.89 | 0.99 |
| Time between injury and surgery (d) | 1.20 ± 0.41 | 1.27 ± 0.59 | 0.94 |
Comparison of Demographic Characteristics in the Study Groups a

The consort flowchart of the trial
According to the statistical analysis results shown in Table 2, the main group effect (early active and passive motion) was not significant for any of the primary outcomes (occupational performance, satisfaction, and hand function). The multiple comparison results showed that scores of occupational performance and satisfaction based on COPM and the subscales of hand function, daily living activities, work, aesthetics, and satisfaction based on MHQ increased in both groups over time.
| Variables and Groups | Mean ± SD | MD (CI) | SMD of Time | SMD of Groups | The Main Effect of Group | The Main Effect of Time | The Main Effect of Group × Time | |||||||||||||
|---|---|---|---|---|---|---|---|---|---|---|---|---|---|---|---|---|---|---|---|---|
| Pre | Post | Follow | Pre-Post | Pre vs Post | Pre | Post | Follow | F | P-Value | η2 | η2 (Level) | F | P-Value b | η2 | η2 (Level) | F | P-Value | η2 | η2 (Level) | |
| COPM (performance) | 0.039 | 0.654 | 0.520 | 2.05 | 0.16 | 0.07 | M | 205.27 | 0.00 | 0.88 | L | 0.35 | 0.71 | 0.01 | S | |||||
| Passive | 3 ± 1.24 | 8.19 ± 2.03 | 9.37 ± 0.91 | -5.19 (-6.35 to -4.03) | 1.668 | |||||||||||||||
| Active | 3.04 ± 0.79 | 9.25 ± 0.86 | 9.75 ± 0.43 | -6.21 (-6.90 to -5.52) | 1.904 | |||||||||||||||
| COPM (satisfaction) | 0.302 | 0.675 | 0.612 | 2.46 | 0.13 | 0.08 | M | 172.07 | 0.00 | 0.86 | L | 0.19 | 0.83 | 0.01 | S | |||||
| Passive | 2.60 ± 1.12 | 8.21 ± 1.93 | 9.29 ± 1.10 | -5.61 (-6.72 to -4.50) | 1.726 | |||||||||||||||
| Active | 2.96 ± 1.27 | 9.27 ± 0.88 | 9.81 ± 0.38 | -6.31 (-7.09 to -5.52) | 1.867 | |||||||||||||||
| MHQ (hand function) | 0.475 | 0.081 | 0.969 | 0.00 | 0.95 | 0.00 | - | 87.84 | 0.00 | 0.76 | L | 0.73 | 0.49 | 0.03 | S | |||||
| Passive | 26.33 ± 12.88 | 76.00 ± 16.39 | 80.33 ± 14.20 | -49.67 (-56.88 to -42.46) | 1.706 | |||||||||||||||
| Active | 21.00 ± 8.90 | 77.33 ± 17.10 | 92.67 ± 7.29 | -56.33 (-64.54 to -48.13) | 1.781 | |||||||||||||||
| MHQ (ADL) | 0.091 | 0.307 | 0.797 | 0.18 | 0.67 | 0.01 | S | 128.81 | 0.00 | 0.82 | L | 0.02 | 0.98 | 0.00 | - | |||||
| Passive | 10.71 ± 16.75 | 80.19 ± 19.82 | 88.09 ± 13.88 | -69.48 (-82.37 to -56.59) | 1.751 | |||||||||||||||
| Active | 9.42 ± 11.50 | 85.32 ± 13.11 | 96.83 ± 3.96 | -75.90 (-85.69 to -66.10) | 1.876 | |||||||||||||||
| MHQ (work) | 0.112 | 0.047 | 0.834 | 0.25 | 0.62 | 0.01 | S | 58.92 | 0.00 | 0.68 | L | 0.34 | 0.71 | 0.01 | S | |||||
| Passive | 18.67 ± 21.00 | 62.67 ± 32.40 | 71.00 ± 27.46 | -44.00 (-59.46 to -28.54) | 1.260 | |||||||||||||||
| Active | 16.33 ± 21.42 | 64.00 ± 24.22 | 90.00 ± 11.34 | -47.67 (-62.31 to -33.02) | 1.442 | |||||||||||||||
| MHQ (pain) | 0.255 | 0.052 | 0.778 | 0.06 | 0.82 | 0.00 | - | 22.30 | 0.00 | 0.44 | L | 4.42 | 0.02 b | 0.13 | M | |||||
| Passive | 38.33 ± 27.36 | 21.67 ± 22.17 | 16.00 ± 16.17 | 16.67 (-3.24 to 36.57) | 0.643 | |||||||||||||||
| Active | 44.00 ± 16.17 | 22.67 ± 16.78 | 5.67 ± 6.78 | 21.33 (11.16 to 31.51) | 1.094 | |||||||||||||||
| MHQ (Aesthetic) | 0.105 | 0.188 | 0.960 | 1.77 | 0.20 | 0.06 | M | 21.82 | 0.00 | 0.44 | L | 0.64 | 0.53 | 0.02 | S | |||||
| Passive | 50.00 ± 20.86 | 72.92 ± 24.40 | 73.72 ± 20.08 | -22.92 (-39.60 to -6.23) | 0.911 | |||||||||||||||
| Active | 52.08 ± 19.43 | 77.50 ± 24.98 | 91.67 ± 12.20 | -25.42 (-38.59 to -12.24) | 0.996 | |||||||||||||||
| MHQ (satisfaction) | 0.086 | 0.542 | 0.990 | 2.15 | 0.15 | 0.07 | M | 37.48 | 0.00 | 0.57 | L | 0.04 | 0.96 | 0.00 | - | |||||
| Passive | 36.12 ± 21.98 | 71.53 ± 16.62 | 76.39 ± 16.64 | -35.41 (-52.16 to -18.65) | 1.347 | |||||||||||||||
| Active | 34.44 ± 17.36 | 80.83 ± 16.95 | 91.67 ± 9.58 | -46.39 (-56.21 to -36.57) | 1.600 | |||||||||||||||
| MHQ (Total) | 0.127 | 0.286 | 1.060 | 1.62 | 0.21 | 0.06 | M | 148.63 | 0.00 | 0.84 | L | 0.69 | 0.51 | 0.02 | S | |||||
| Passive | 33.14 ± 15.86 | 72.12 ± 19.89 | 78.25 ± 15.14 | -38.98 (-50.41 to -27.56) | 1.468 | |||||||||||||||
| Active | 31.54 ± 8.79 | 77.05 ± 14.31 | 92.86 ± 7.07 | -45.51 (-52.34 to -38.68) | 1.756 | |||||||||||||||
The Results of Repeated Measures Analysis of Variance for Primary Outcomes a
Comparisons between the two groups in secondary outcomes are represented in Table 3, followed by detailed explanations and corresponding figures. The hand dexterity level (P = 0.03) and ROM (P < 0.001) were significantly different between groups based on the results of PPT (both-hand subscale) and TAM (ASSH and Strickland methods) (Figure 2). Multiple comparison results of both BBT and PPT showed improvement in dexterity in both groups at follow-up (week 14) compared to after therapy (week 8). No significant differences were observed between the groups in these tests after therapy or at follow-up. Multiple comparison results showed an increase in power grip and pinch, as well as TAM, in both groups at follow-up compared to after therapy. However, the difference between groups was not significant at either time point.
| Assessment in 2 Time Points and Interventions | Mean ± SD | The Main Effect of Group | The Main Effect of Time | The Main Effect of Time × Group | |||||||
|---|---|---|---|---|---|---|---|---|---|---|---|
| Time (Post) | Time (Follow-up) | F | P-Value | η2 | F | P-Value b | η2 | F | P-Value | η2 | |
| PPT (injured hand) | 3.05 | 0.09 | 0.10 | 28.44 | 0.00 | 0.50 | 0.15 | 0.71 | 0.01 | ||
| Modified Duran | 13.27 ± 3.39 | 15.27 ± 3.56 | |||||||||
| Strickland | 15.40 ± 3.09 | 17.13 ± 3.07 | |||||||||
| PPT (bilateral) | 5.24 | 0.03 b | 0.16 | 80.71 | 0.00 | 0.74 | 0.93 | 0.34 | 0.34 | ||
| Modified Duran | 10.80 ± 2.04 | 12.47 ± 1.88 | |||||||||
| Strickland | 12.33 ± 2.38 | 14.40 ± 2.26 | |||||||||
| PPT (assemble) | 0.24 | 0.63 | 0.01 | 29.90 | 0.00 | 0.52 | 0.17 | 0.68 | 0.01 | ||
| Modified Duran | 29.40 ± 5.87 | 34.13 ± 5.60 | |||||||||
| Strickland | 30.67 ± 5.97 | 34.73 ± 5.30 | |||||||||
| BBT (injured hand) | 1.03 | 0.32 | 0.04 | 48.96 | 0.00 | 0.64 | 4.39 | 0.05 b | 0.14 | ||
| Modified Duran | 65.40 ± 8.51 | 75.67 ± 8.77 | |||||||||
| Strickland | 71.00 ± 10.81 | 76.53 ± 8.77 | |||||||||
| Power grip (injured hand) | 3.58 | 0.07 | 0.11 | 129.37 | 0.00 | 0.82 | 1.62 | 0.21 | 0.06 | ||
| Modified Duran | 16.36 ± 8.98 | 22.66 ± 10.16 | |||||||||
| Strickland | 21.91 ± 8.55 | 29.80 ± 9.58 | |||||||||
| Pinch | 0.14 | 0.71 | 0.00 | 72.29 | 0.00 | 0.61 | 0.98 | 0.33 | 0.02 | ||
| Modified Duran | 3.38 ± 2.24 | 4.81 ± 2.89 | |||||||||
| Strickland | 3.09 ± 1.26 | 4.75 ± 1.55 | |||||||||
| TAM (Strickland method) | 22.74 | 0.00 b | 0.33 | 53.78 | 0.00 | 0.54 | 1.39 | 0.25 | 0.03 | ||
| Modified Duran | 86.85 ± 48.72 | 104.07 ± 44.94 | |||||||||
| Strickland | 138.33 ± 34.98 | 162.14 ± 25.72 | |||||||||
| TAM (ASSH method) | 22.89 | 0.00 b | 0.33 | 45.21 | 0.00 | 0.50 | 0.21 | 0.65 | 0.01 | ||
| Modified Duran | 170.56 ± 53.36 | 192.96 ± 45.43 | |||||||||
| Strickland | 228.10 ± 41.61 | 253.81 ± 29.95 | |||||||||
| Assessment in 3 Time Points and Interventions | Pre | Post | Follow-up | F | P-Value | η2 | F | P-Value b | η2 | F | P-Value (η2) |
| DASH | 1.87 | 0.18 | 0.06 | 119.23 | 0.00 | 0.81 | 3.02 | 0.06 (0.10) | |||
| Modified Duran | 73.20 ± 11.21 | 22.99 ± 18.60 | 12.22 ± 12.53 | ||||||||
| Strickland | 70.05 ± 11.80 | 15.92 ± 8.98 | 3.60 ± 3.50 | ||||||||
| VAS | 0.02 | 0.88 | 0.00 | 89.21 | 0.00 | 0.76 | 0.91 | 0.41 (0.03) | |||
| Modified Duran | 4.20 ± 2.31 | 1.67 ± 1.72 | 0.87 ± 1.51 | ||||||||
| Strickland | 2.33 ± 1.40 | 1.53 ± 0.92 | 0.47 ± 0.64 | ||||||||
The Results of Repeated Measures Analysis of Variance for Secondary Outcomes a
")
The main effect of the group illustrated in bar graphs (* P < 0.05, **** P < 0.0001)
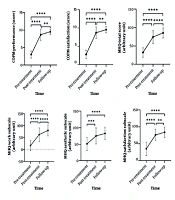
Moreover, reductions in pain based on VAS and MHQ pain subscale and hand disability based on DASH were observed in both groups after therapy and at follow-up compared to before therapy. The main effect of time (before therapy, after therapy, and follow-up for variables with three time-point assessments: Occupational performance and satisfaction, hand function, hand disability, and pain; and after therapy and follow-up for variables with two time-point assessments: Hand dexterity, TAM, power grip, and pinch was significant in all primary and secondary outcomes (P < 0.001) (Figures 3 and 4). The data reveal a consistent pattern of improvement in occupational performance/satisfaction, hand function, disability reduction, and pain relief. Both groups demonstrated enhanced outcomes post-treatment relative to baseline, with these improvements sustained through follow-up, suggesting durable therapeutic effects (Figure 3).
.")
The main effect of time, for variables with 3-time points assessments are illustrated in bar graphs (** P < 0.01, *** P < 0.001 and **** P < 0.0001).
.")
The main effect of time, for variables with 2-time points assessments are illustrated in bar graphs (**** P < 0.0001).
Follow-up measurements demonstrated maintained enhancements in hand dexterity, TAM, grip power, and pinch strength, with both groups exhibiting similar recovery patterns (Figure 4). The interaction effect of group*time was significant only for pain level based on the MHQ pain subscale (P = 0.02) and hand dexterity based on BBT (P = 0.05) (Figure 5). The slope of change in the Strickland/Cannon protocol (early active) was greater than the modified Duran protocol (early passive), indicating that the Strickland/Cannon protocol led to a faster reduction in pain. Conversely, improvement in hand dexterity occurred more rapidly in the modified Duran protocol, as the slope of change was steeper in this group compared to the Strickland/Cannon protocol based on the BBT results (Figure 5).
.")
The interaction effect between time*group is illustrated in the bar graphs (## P < 0.01, #### P < 0.0001 for Strickland group, and **** P < 0.0001 for modified Duran group).
5. Discussion
The present study was conducted to compare early active and passive motion groups in terms of occupational performance and satisfaction, hand function, disability, TAM, dexterity, power, and pinch in patients with flexor tendon injury in zones 1 and 2. This pilot randomized clinical trial is the first study to compare the effects of early active and passive motion methods in zones 1 and 2 on occupational performance and satisfaction. The results showed improvements in occupational performance and satisfaction based on the COPM over time in both groups. Moreover, improvements in hand function and satisfaction based on MHQ were observed after therapy and at follow-up in both groups. The primary and secondary outcomes are discussed in detail below.
5.1. Primary Outcomes
At baseline, diminished occupational performance and satisfaction were expected, given that all participants had recently undergone flexor tendon surgery. After eight weeks, both intervention protocols led to considerable improvements. In a clinical trial, Trumble et al. compared active place-and-hold and passive motion protocols in patients with zone 2 flexor tendon repairs. They used a combination of Duran and Kleinert protocols in the passive group and a hinged splint and DBS in the active group. Their results showed greater satisfaction in the active group (19). No previous studies comparing early active and passive motion groups regarding occupational performance and satisfaction were found. The present results suggest that participants in the active group may have engaged in daily living activities with more confidence and participation, increasing performance and satisfaction (37), although the difference between groups was not statistically significant.
In this study, the active motion group showed improvement in hand function based on MHQ over time, similar to the passive group. Trumble et al. also found no significant difference between active and passive groups in hand function at 52 weeks follow-up using the Jebsen-Taylor hand function test (19), consistent with our findings. This may be due to improved occupational performance and satisfaction in ADLs (COPM), leading to increased hand use and thereby improving function and satisfaction (MHQ).
5.2. Secondary Outcomes
Based on DASH, both groups showed improvement (decreased disability) after therapy and at follow-up, with no significant difference between them. These results align with Chevalley et al. (8) and Trumble et al. (19) but differ from Kitis et al., who found a significant difference between early active (Washington method) and controlled passive motion (38). The discrepancy may be due to differences in protocols and injury zones.
Pain assessed via VAS and MHQ pain subscale significantly decreased in both groups after therapy and at follow-up, with no significant difference between the groups. Elevation, passive movement, and antagonist muscle contraction contribute to the restoration of lymphatic and venous arteries and reduce interstitial pressure. Contraction of antagonist muscles inhibits corresponding agonist muscles, which leads to relaxation and further pain reduction (39).
The present study results showed that the range of active motion of the digits (based on TAM) according to Strickland and ASSH scales after therapy and at follow-up was higher in the active group than in the passive, which agrees with the results in Layeghi and Farzad’s study that was conducted to compare early active and passive motions after flexor tendon repair in zone 2 in 38 patients with 50 injured digits, who were randomly assigned to early active motion and controlled passive motion groups. The Duran method was used in the controlled passive motion group and the Belfast and Sheffield methods in the active group. After eight weeks of intervention, TAM based on the Strickland and Buck-Gramcko criterion was significantly higher in the active group than in the passive (16). The same results were reported in Sundaram et al.’s study (40). Higher TAM in the active motion group compared to the passive motion group in the present study may be because active motion increased skeletal muscle capacity and also improved neural adaptations and motor learning and coordination with increased firing of motor units (39). The present study results showed higher TAM in early active motion, but differences were not statistically significant in comparison with the passive motion group. In Frueh et al.’s retrospective study comparing early passive motion and controlled active motion methods in zones 1 and 2 after flexor tendon repair, no significant difference was found between the two groups after 12 weeks of therapy (7). The difference between the present and Frueh et al.’s study results may be due to differences in the type of injury and participants’ mean age, as in Frueh et al.’s study, complex crushing or fracture injuries were included, and the mean age of participants was higher than that in the present study (7).
In the present study, power grip and pinch significantly improved in both active and passive groups in week 8 (end of intervention) and week 14 (follow-up), with no significant difference between the two groups (P = 0.07). As there was no flexor tendon rupture in either group, it was not contraindicated to measure grip and pinch strength at the eight-week time point. These results concur with those of El Mikkawy et al.’s study comparing early active and passive motions in zone 2. Their results showed higher mean power grip and pinch in the active motion group compared to the passive group after eight weeks, but the difference between groups was not significant (41), as in the present study. Although grip strength improved at 8 and 12 weeks after reconstruction surgery followed by the early intervention protocol, the amount of change was marginally significant in comparison with the traditional protocol group (42). Chevalley et al.’s study results indicated no significant difference between grip and key pinch strength in the comparison of passive motion with place and hold versus early active motion in zones 1 and 2 of flexor tendon injury (8). The present study results disagree with those obtained in Yen et al.’s study (43), investigating the clinical outcomes following the use of early active motion in flexor tendon repair in zone 2, in which the early active motion method was used in the active group (including active extension, progressive active and passive flexion, and holding active flexion), and the Kleinert method in the passive group. The results after four months of follow-up showed a significant difference between the two groups in power grip and pinch, with power grip and pinch significantly higher in the active group compared to the passive group. The difference between the results of the present and Yen et al.’s study may be due to the use of different passive protocols, as in their study, the Kleinert protocol was used, and in the present study, the modified Duran protocol. In the Kleinert protocol, passive flexion motion in the DIP joint is hard to perform, which causes adhesion and limitation in the articular range of the MP, PIP, and DIP joints. On the other hand, stiffness, especially in the DIP joint, leads to a 30% reduction in power grip and 40% in power pinch in normal digits (43). Previous studies have reported that the little digit has the least power in flexion compared to other digits (44), and achievement of ideal outcomes in this digit following flexor tendon repair is difficult (7). In the present study, there were only a few injured little digits (25%), but in the passive group in Yen et al.’s study (43), 50% of participants had injured little digits. Therefore, the percentage of injured little digits in the passive group may be another reason for the difference between the two studies’ results. In another pilot study, grip power was assessed in weeks 4 and 8 after zone 2 tendon flexor repair. Higher grip strength was reported in the early active motion group versus the passive motion group. Time after repair assessment and the lower number of participants may affect the results of the study (40), which is in contrast with the present study.
In the present study, the active group showed greater dexterity than the passive. However, no significant difference was found between them in the scores of the box and block test and other Purdue Pegboard subtests, which agrees with the results obtained by Chevalley et al. (8) and Trumble et al. (19). In the box and block and PPTs used in the present study, the thumb and index digit pinch are required in most parts, and thus, the middle, ring, and little digit injuries have a negligible effect on the outcomes. In the present study, there was a small number of injured index digits in the active and passive groups (active group 33.3% and passive group 29.6%), and this may have caused the lack of a significant difference between the two groups.
While both early passive and early active motion protocols demonstrated equivalent advantages in occupational performance, hand function, and PROs, our findings have significant implications for clinical practice. Firstly, the absence of between-group differences implies that early passive motion protocol can be as effective for zone 1 - 2 flexor tendon injuries in the early rehabilitation process. This is particularly relevant to settings with limited therapist-to-patient ratios, where early passive motion may offer a practical approach without sacrificing therapeutic outcomes. Second, the similar satisfaction scores (COPM/MHQ) reinforce the importance of patient-centered goal setting in rehabilitation planning regardless of motion protocol choice. However, the pilot nature of this investigation study calls for caution.
5.3. Conclusions
The findings illustrated similar effects of the Strickland/Cannon early active motion protocol and the modified Duran passive motion protocol in enhancing occupational performance, satisfaction, and hand function for flexor tendon injuries in zones 1 and 2. Importantly, the findings underscore the potential flexibility in postoperative rehabilitation approaches without compromising hand function or patient satisfaction. However, given the pilot nature of this study and its limited follow-up duration, further research with larger cohorts and longer observation periods is needed to validate these findings and guide more effective clinical decision-making and cost-effective protocol selection.
5.4. Limitations
One limitation of the present study was the follow-up period. The COVID-19 pandemic began when the study ended and thus prevented follow-up beyond 14 weeks. Although this period was protocol-based, extending follow-up to six months is recommended for better evaluation of occupational performance, hand function, and late complications of flexor tendon repair. Moreover, investigating the effects of socio-economic factors and return to work after treatments with early active and passive protocols is recommended for future studies. As a pilot RCT with limited generalizability, future studies with larger sample sizes are needed. Since outcomes were similar in both groups, protocol choice may be best based on the client’s condition and the therapist’s judgment.
