1. Background
Muscle strength is needed for physical activity. Since the test of muscle strength needs a person’s maximum exertion, the objective assessment of muscle size is often measured in sedentary people (1). Muscle volume which, is related to muscle cross-sectional area and thickness, is associated with muscle strength (2, 3). Among the imaging techniques for assessing muscle size, the muscle thickness is the easiest to measure via ultrasonography. Previous reports showed that muscle thickness of the quadriceps femoris, triceps brachii, and forearm might be a predictor of knee and elbow extension, and handgrip strength, respectively (2, 3). However, little is known about the associations between trunk muscle thickness and strength. The abdominal and low back muscles are relevant muscles that contribute to lumbopelvic postural control (4).
2. Objectives
This study aimed to investigate the correlations between trunk muscle thickness and strength in healthy male adults.
3. Methods
3.1. Participants
Seventeen male adults were included in this study. Participants consisted of healthy university student volunteers who were physically active although not athletes. Their mean (± standard deviation) age, height, weight, and body mass index were 20.8 ± 0.6 years, 169.4 ± 5.4 cm, 62.1 ± 6.6 kg, and 21.6 ± 1.9 kg/m2, respectively. Participants were excluded if they had low back pain over the previous year, a history of orthopedic disorders affecting the lumbar spine or neurological disorders. This study was approved by the Ethics Committee at Kawasaki University of Medical Welfare (#18-080). Written informed consent was obtained from all subjects. The protocol for this study is consistent with the ethical guidelines of the 1975 Declaration of Helsinki.
3.2. Procedure
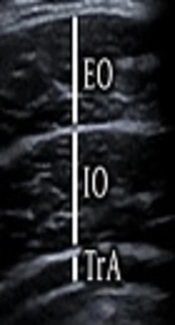
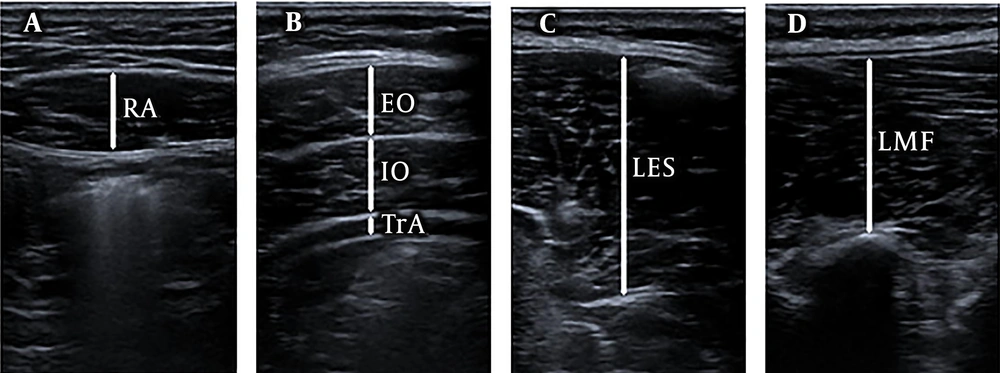
Muscle thickness (cm) of the right and left abdominal (rectus abdominis, external oblique, internal oblique, transverse abdominis) and low back (lumbar erector spinae, lumbar multifidus) muscles, at rest, was measured using B-mode ultrasonography (Noblus; Hitachi Ltd., Tokyo, Japan) with a 7 - 3 MHz linear probe (L34; Hitachi Ltd., Tokyo, Japan). Subjects were positioned in the supine and prone posture in order to perform ultrasonography of the abdominal and low back muscles, respectively. Measurement sites were defined as 3 cm lateral to the umbilicus for the rectus abdominis muscle, 2.5 cm anterior to the midaxillary line and at the midpoint between the inferior rib and iliac crest for the external oblique, internal oblique, and transverse abdominis muscles, and approximately 4 cm and 2 cm lateral to the L3/4 spinous process for the lumbar erector spinae and multifidus, respectively (Figure 1). Measurement location of the lumbar erector spinae and multifidus muscle thickness were at midpoint of the lumbar erector spinae muscle fascia between the transverse processes of the 3rd and 4th lumbar vertebrae and at the intervertebral joint of the L3/4, respectively. Longitudinal image for the lumbar multifidus muscle and transverse image for the other muscles were measured. Measurements were performed by an experienced investigator with 7 years of experience in musculoskeletal ultrasound. The probe was held using the minimum pressure required to achieve a clear image. Measurement of abdominal muscle thicknesses was performed at the end of a relaxed expiration. The muscle images were collected twice. The average values of the two trials were used in this analysis.
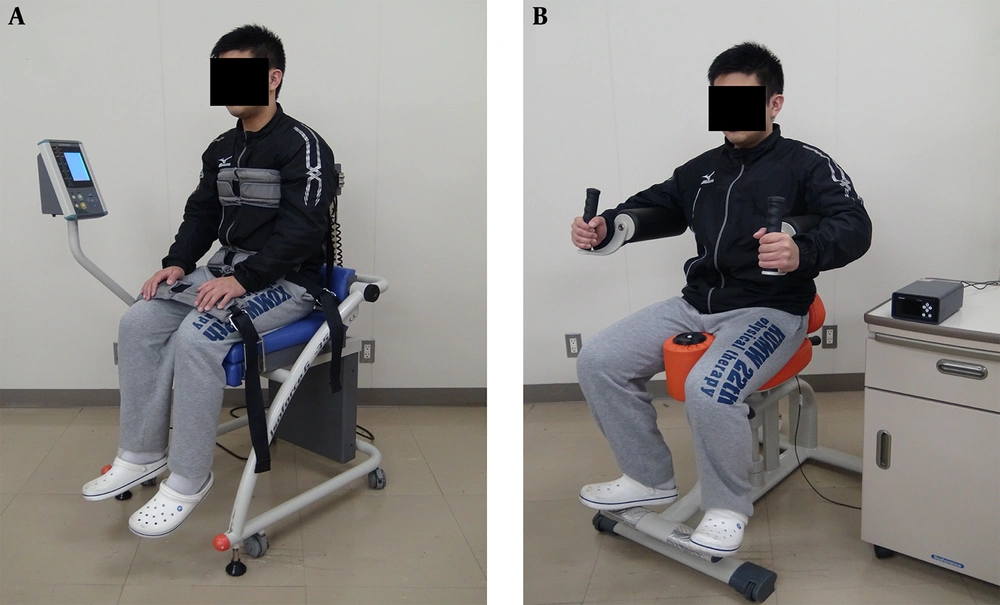
Maximum voluntary isometric trunk flexion and extension torque (Nm) were measured using the trunk flexion/extension dynamometer (Isoforce GT-350; OG Wellness Co., Ltd., Okayama, Japan) (Figure 2). Subjects were positioned in an upright sitting posture with the center of the sensor pad placed at the height of the inferior angulus of the scapula. The subject was fixed at different places (upper trunk, pelvis, anterior thigh) with straps. Maximum voluntary isometric trunk right and left rotation torque (Nm) were measured using the trunk rotation dynamometer (S-18034; Takei Scientific Instruments Co., Ltd., Niigata, Japan) which was custom developed using the trunk rotation training machine (Rotary torso FY-1032; NISHI Athletic Goods Co., Ltd., Tokyo, Japan), tension/compression type load cell (UNCLB-1kN; UNIPULSE Co., Ltd., Niigata, Japan), and strain amplifier (T.K.K.1268b; Takei Scientific Instruments Co., Ltd., Niigata, Japan) (Figure 2). Calibration of the equipment was performed before each test according to the manufacture’s recommendations. Before analysis, subjects performed some sub maximum exertion practice. The test order was randomized. Subjects were tested twice for each measurement. If the second value of torque was more than 110% of the first one, the torque was measured one more time (5). In 2 or 3 torque measurements, the highest value was used for analysis.
3.3. Statistical Analysis
Statistical analyses were performed using SPSS Statistics V.23 (IBM Inc, Chicago, IL). The reliability of the measured values of the muscle thickness and torque between the 1st and 2nd measurements were examined by the intraclass correlation coefficient (ICC) (1, 2) and (1, 1), respectively. The standard error of measurement (
4. Results
The mean ± standard deviation of representative values and the correspondent reliability are listed in Table 1. The correlation coefficients between muscle thickness and torque values are presented in Table 2. There were significant positive correlations with the torque. However, there was no significant correlation between trunk muscle thickness with torque.
| Valuea | 1st | 2nd | ICCb | SEM | MDC | Power | |
|---|---|---|---|---|---|---|---|
| Muscle thickness, cm | |||||||
| RA | |||||||
| Right | 1.17 ± 0.18 | 1.17 ± 0.18 | 1.17 ± 0.18 | 0.98 | 0.02 | 0.06 | 1.000 |
| Left | 1.21 ± 0.16 | 1.21 ± 0.15 | 1.22 ± 0.17 | 0.94 | 0.04 | 0.11 | > 0.999 |
| EO | |||||||
| Right | 0.88 ± 0.16 | 0.88 ± 0.16 | 0.88 ± 0.18 | 0.96 | 0.03 | 0.09 | 1.000 |
| Left | 0.83 ± 0.09 | 0.82 ± 0.10 | 0.84 ± 0.10 | 0.90 | 0.03 | 0.08 | > 0.999 |
| IO | |||||||
| Right | 1.10 ± 0.21 | 1.09 ± 0.23 | 1.12 ± 0.20 | 0.94 | 0.05 | 0.14 | > 0.999 |
| Left | 1.11 ± 0.20 | 1.12 ± 0.21 | 1.10 ± 0.20 | 0.95 | 0.05 | 0.13 | 1.000 |
| TrA | |||||||
| Right | 0.35 ± 0.08 | 0.35 ± 0.09 | 0.34 ± 0.07 | 0.93 | 0.02 | 0.06 | > 0.999 |
| Left | 0.34 ± 0.07 | 0.34 ± 0.08 | 0.34 ± 0.07 | 0.86 | 0.03 | 0.08 | > 0.999 |
| LES | |||||||
| Right | 3.91 ± 0.49 | 3.94 ± 0.48 | 3.89 ± 0.54 | 0.94 | 0.13 | 0.35 | > 0.999 |
| Left | 3.91 ± 0.45 | 3.92 ± 0.49 | 3.91 ± 0.43 | 0.95 | 0.10 | 0.28 | 1.000 |
| LMF | |||||||
| Right | 2.78 ± 0.36 | 2.82 ± 0.35 | 2.77 ± 0.37 | 0.96 | 0.07 | 0.19 | 1.000 |
| Left | 2.91 ± 0.32 | 2.86 ± 0.31 | 2.77 ± 0.34 | 0.94 | 0.08 | 0.22 | > 0.999 |
| Torque, Nm | |||||||
| Flexion | 325.0 ± 64.4 | 318.0 ± 66.1 | 316.3 ± 70.4 | 0.95 | 15.4 | 42.7 | 1.000 |
| Extension | 422.8 ± 178.4 | 403.2 ± 169.3 | 413.2 ± 177.4 | 0.98 | 27.4 | 76.0 | 1.000 |
| Right rotation | 75.7 ± 22.8 | 69.9 ± 22.3 | 74.1 ± 22.3 | 0.90 | 7.1 | 19.6 | > 0.999 |
| Left rotation | 72.4 ± 23.3 | 70.8 ± 24.2 | 67.4 ± 21.8 | 0.93 | 6.3 | 17.4 | > 0.999 |
Abbreviations: EO, external oblique; ICC, intraclass correlation coefficient; IO, internal oblique; LES, lumbar erector spinae; LMF, lumbar multifidus; MDC, minimal detectable change; RA, rectus abdominis; SEM, standard error of measurement; TrA, transversus abdominis.
a Values are presented as average for muscle thickness and highest for torque.
b ICC values are presented as ICC (1, 2) for muscle thickness and ICC (1, 1) for torque.
| Torque | ||||||||||||
|---|---|---|---|---|---|---|---|---|---|---|---|---|
| Flexion | Extension | Right Rotation | Left Rotation | |||||||||
| r | P | Power | r | P | Power | r | P | Power | r | P | Power | |
| Muscle thickness | ||||||||||||
| RA | ||||||||||||
| Right | 0.105 | 0.687 | 0.068 | -0.013 | 0.960 | 0.050 | -0.073 | 0.780 | 0.059 | 0.080 | 0.761 | 0.060 |
| Left | 0.267 | 0.301 | 0.180 | 0.095 | 0.716 | 0.065 | 0.153 | 0.558 | 0.089 | 0.132 | 0.615 | 0.079 |
| EO | ||||||||||||
| Right | 0.348 | 0.171 | 0.283 | 0.057 | 0.828 | 0.055 | 0.135 | 0.606 | 0.080 | 0.240 | 0.354 | 0.153 |
| Left | 0.030 | 0.908 | 0.051 | 0.240 | 0.354 | 0.153 | 0.335 | 0.189 | 0.264 | 0.378 | 0.134 | 0.331 |
| IO | ||||||||||||
| Right | 0.148 | 0.572 | 0.087 | -0.219 | 0.398 | 0.134 | -0.229 | 0.378 | 0.143 | -0.127 | 0.627 | 0.077 |
| Left | -0.061 | 0.817 | 0.056 | 0.059 | 0.823 | 0.056 | -0.186 | 0.475 | 0.110 | -0.077 | 0.769 | 0.060 |
| TrA | ||||||||||||
| Right | -0.151 | 0.563 | 0.088 | -0.314 | 0.220 | 0.236 | -0.084 | 0.750 | 0.062 | -0.134 | 0.609 | 0.080 |
| Left | -0.279 | 0.278 | 0.193 | -0.341 | 0.180 | 0.273 | -0.216 | 0.405 | 0.132 | -0.266 | 0.302 | 0.179 |
| LES | ||||||||||||
| Right | 0.003 | 0.990 | 0.050 | 0.077 | 0.770 | 0.060 | 0.357 | 0.159 | 0.297 | 0.377 | 0.136 | 0.329 |
| Left | 0.246 | 0.341 | 0.158 | 0.189 | 0.468 | 0.112 | 0.411 | 0.101 | 0.387 | 0.462 | 0.062 | 0.484 |
| LMF | ||||||||||||
| Right | 0.098 | 0.707 | 0.066 | 0.001 | 0.998 | 0.050 | 0.168 | 0.520 | 0.098 | 0.387 | 0.125 | 0.346 |
| Left | 0.061 | 0.815 | 0.056 | 0.057 | 0.829 | 0.055 | 0.302 | 0.240 | 0.220 | 0.477 | 0.053 | 0.515 |
| Torque | ||||||||||||
| Flexion | 0.664 | 0.004 | 0.871 | 0.565 | 0.018 | 0.695 | 0.641 | 0.006 | 0.836 | |||
| Extension | 0.664 | 0.004 | 0.870 | 0.844 | < 0.001 | 0.997 | 0.784 | < 0.001 | 0.982 | |||
| Right rotation | 0.565 | 0.018 | 0.695 | 0.844 | < 0.001 | 0.997 | 0.906 | < 0.001 | > 0.999 | |||
| Left rotation | 0.641 | 0.006 | 0.836 | 0.784 | < 0.001 | 0.982 | 0.906 | < 0.001 | > 0.999 | |||
Abbreviations: EO, external oblique; IO, internal oblique; LES, lumbar erector spinae; LMF, lumbar multifidus; RA:, rectus abdominis; TrA, transversus abdominis.
5. Discussion
This study investigated the associations between trunk muscle thickness and strength in healthy male adults. In this study, ICC values between the 1st and 2nd measurements in the muscle thickness were almost perfect. Teyhen et al. (7) found mean rectus abdominis, external oblique, internal oblique, and transverse abdominis muscle thickness of 244 healthy males (21.8 ± 3.9 years) to be 1.41 ± 0.24, 0.80 ± 0.24, 1.04 ± 0.23, and 0.39 ± 0.24 cm, respectively. Masaki et al. (8) reported the mean L4 lumbar multifidus muscle thickness of 8 healthy males and 15 healthy females (34.7 ± 10.2 years) to be 2.86 ± 0.39 cm. Our data showed similar values. Masuda et al. (9) demonstrated the mean L3 lumbar erector spinae muscle thickness of 50 healthy males (30.4 ± 6.6 years) to be 3.45 ± 0.41 cm. Our data showed slightly higher values, which might differ because of the location at which the images were obtained. Our measurement location for the lumbar erector spinae muscle thickness was at the midpoint of the lumbar erector spinae muscle fascia between the transverse processes of the 3rd and 4th lumbar vertebrae, though Masuda et al. (9) measured at the transverse process of the 3rd lumbar vertebrae. These results indicated that measurements of muscle thickness in this study might be valid.
In this study, significant correlations were observed with torque. These results indicated that the differences in muscle strength among subjects could be detected by torque measurements. However, trunk muscle thickness was not associated with torque, which might be due to the compound movement of synergist muscles (10). Whiler et al. (10) could not demonstrate associations between gluteus medius and maximus muscle thickness and strength for the reasons mentioned above. Sasaki et al. (11) detected trunk flexion and extension torque of 16 healthy males (21.1 ± 2.5 years) to be 214.4 ± 63.1 and 345.6 ± 74.3, respectively. Kienbacher et al. (12) reported trunk flexion, extension, and rotation torque of 44 healthy males (34.2 ± 9.3 years) to be 159.4 ± 34.4, 287.6 ± 60.8, and 136.7 ± 41.3 Nm, respectively. Roth et al. (13) showed that trunk flexion, extension, and rotation torque of 7 healthy males (ranging from 21 to 26 years old) to be 122.9 ± 28.9, 260.3 ± 65.1, and 119.3 ± 32.5 Nm, respectively. Our data showed higher values in the trunk flexion and extension, lower values in the trunk rotation. In this study, extremities muscle might contribute to the tasks of trunk flexion and extension. Though the subject was fixed at different places (upper trunk, pelvis, anterior thigh) with straps, the hip flexion and extension could contribute to the testing of trunk flexion and extension torque, respectively. On the other hand, in this study, the contribution of the trunk rotation muscles might not be sufficiently transmitted to the dynamometer, since subjects were not fixed at several places. Therefore, the associations between muscle size and torque might be limited by our measurements, though ICC values between 1st and 2nd measurements in the torque were almost perfect.
The limitation of this study was ambiguity in determining that the subjects generated maximum voluntary force for each measurement. The subjects did not undergo a preliminary leaning, which could have an influence on the reliability of torque values (14). The previous study demonstrated a learning effect on isometric trunk flexion strength between different testing days (15). Other architectural parameters such as cross-sectional area or muscle volume measured by magnetic resonance imaging and computer tomography should be used in future studies. The sex difference remains unclear. Moreover, the sample size might have been a limitation.
This study provides basic information about trunk muscle thickness and muscle strength in healthy male adults. The associations of trunk muscle thickness and muscle strength could not be detected by our measurements.


