


1. Background
Nephrolithiasis is one of the most common health problems in developed countries, affecting 2% - 5% of the population at least once in their lifetime. A significant percentage of these people experience recurrent stone formation accompanied by pain, urinary tract infection, or decreased parenchymal and renal function (1, 2).
Populations with an animal protein-rich diet are at a higher risk for nephrolithiasis than populations with a vegetable-rich diet. Nephrolithiasis can be caused by a variety of etiologic factors, such as family history or poor nutrition, depending on the type of stone and the patient’s condition (3). Calcium oxalate monohydrate is the most common crystal found in the renal matrix. 50% of the patients with nephrolithiasis present with recurrent stone formation within ten years. The high recurrence rate necessitates the application of different approaches for the prevention of recurrent nephrolithiasis (4).
L-carnitine is one of the amino acid derivatives normally produced in the liver and kidney. It is required as a cofactor to pass fatty acids into the mitochondria for energy metabolism. Carnitine facilitates the excretion of excessive amounts of fatty acids or organic acids in patients with impaired fatty acid metabolism or organic acid metabolic disorders (1, 5, 6). These disorders cause the accumulation of acyl-coenzyme and carnitine is rapidly excreted by the formation of acyl carnitine. Carnitine also facilitates the entry of long-chain fatty acids into the mitochondria. Only the L isomer of carnitine is effective in the metabolism of fats and consequently has the ability to affect various metabolites in the blood or urine of the patients (7, 8).
Recently, a hypothesis has been proposed about the interplay between epithelial cells of the renal tubules and urinary crystals. Urinary crystals cause damage to the renal tubule epithelial cells, triggering a chain of reactions such as oxidative stress, inflammatory response, apoptosis, and phagocytosis. These reactions, in turn, cause the aggregation and attachment of the urinary crystals (9). L-carnitine is a specific inhibitor of free oxygen fragments in the mitochondria and thus has beneficial effects in protecting the renal cells against oxidative stress, apoptosis, and inflammatory cytokines in acute and chronic inflammatory injury (2, 7, 10). A limited number of studies have investigated the antioxidant features of L-carnitine and its effects on the urinary metabolites in patients with renal stone formation.
2. Objectives
Therefore, the aim of this study was the evaluation of the effect of L-carnitine on 24-hour urine metabolites in patients with a history of recurrent stone formation.
3. Methods
3.1. Study Population
34 patients with a history of recurrent stone formation were included in the study.
3.2. Measurements
This analytic study was performed to compare the levels of urinary metabolites in 24-hour urine of patients with a history of recurrent stone formation referred to the Urology Clinic of Golestan Hospital in Ahvaz, who were treated with L-carnitine.
After obtaining the ethical approval and clinical trial registry codes, the study protocol were started. The study group included patients referred to the urology clinic of Golestan Hospital, Ahwaz, who fulfilled the inclusion criteria and had given their informed consent to participate in the study Extracorporeal Shock Wave Lithotripsy (ESWL). Therefore, a non-random sampling method was implemented in this study. Patients with a history of renal stone formation and patients undergoing surgical or non-surgical Extracorporeal Shock Wave Lithotripsy (ESWL) therapy for renal or ureteral stone were included. Exclusion criteria were the absence of recurrent condition, anatomical disorders (such as ureteral stenosis, ureteropelvic junction obstruction (UPJO) ureterovesical junction obstruction (UVJO)), endocrine disorders (including hyperparathyroidism, diabetes, metabolic syndrome, cystinuria), and undergoing medication other than L-carnitine for kidney or ureteral stones.
After the selection of the participants, they were provided with necessary information about the study conditions, their treatment status, and the benefits of the participation in the study patients were then asked to complete and sign an informed consent form indicating their acceptance to the study protocol.
Demographic data and 24-hour urine indicators (including calcium, oxalate, uric acid, and citrate) were recorded before treatment. Patients were followed up for two weeks with no drug treatment and a regular diet. Patients were advised on the type of diet (dairy, red meat, calcium supplements, etc.). At the end of the two-week period, 24-hour urine was collected again and the levels of calcium, oxalate, uric acid, and citrate were analyzed. Patients were treated with oral vial of L-carnitine, 1 gr daily for 8 weeks. During the period of treatment with L-carnitine, patients were monitored for similarity to the first two weeks of follow-up. At the end of the eighth week, 24-hour urine was collected and the levels of calcium, oxalate, uric acid, and citrate were evaluated.
3.3. Ethical Considerations
In this study, patients with a history of recurrent nephrolithiasis are considered as the study group. Patients’ information is completely confidential and is presented only as a final report.
3.4. Statistical Analysis
Data was statistically analyzed by SPSS software version 23. Frequency and percentages were presented in tables. In addition, the t-test and chi-square test were used for analysis of the data.
4. Results
The mean age of the 34 participants of the study was 39.5 ± 11.8 years. 11 patients (32.3%) were female and 23 patients (67.6%) were male. The mean value and standard deviation of the patients' weight was 69.7 ± 10.6 kg (Table 1). The mean size of the renal stones before and after treatment was 3.8 ± 3.1 and 3.6 ± 3.2, respectively. There was no statistically significant difference between the mean stone sizes before and after treatment (P = 0.92) (Figure 1).
Table 1.Age and Gender of Evaluated Patients
| Variables | Valuesa |
|---|---|
| Age | 39.5 ± 11.8 |
| Gender | |
| Male | 23 (67.7) |
| Female | 11 (32.3) |
| Weight | 69.7 ± 10.6 |
aValues are expressed as mean ± SD or No. (%).

Figure 1.
Comparison of stone size before and after treatment
The mean levels of calcium at baseline, after diet modification, and after L-carnitine treatment, were 172.2 ± 116.1, 172.2 ± 115.9, and 134.8 ± 103.0, respectively. The decrease in the calcium level was not statistically significant (P = 0.08) (Figure 2). Also, 24-hour uric acid levels at baseline, after diet modification, and after treatment were 748.3 ± 368.8, 747.5 ± 365.5, and 482.0 ± 266.6, respectively showing a statistically significant decrease after treatment (P < 0.0001) (Figure 3). The mean oxalate level, at baseline, after diet modification, and after treatment were 28.9 ± 15.0, 28.9 ± 15.3, and 23.0 ± 13.1, respectively, indicating a statistically significant decrease after treatment (P = 0.03) (Figure 4). The mean citrate levels at baseline, after diet modification, and after treatment were 975.5 ± 751.3, 939.5 ± 739.7, and 837.6 ± 609.9, respectively., showing a significant decrease after treatment with L-carnitine (P = 0.04) (Figure 5).
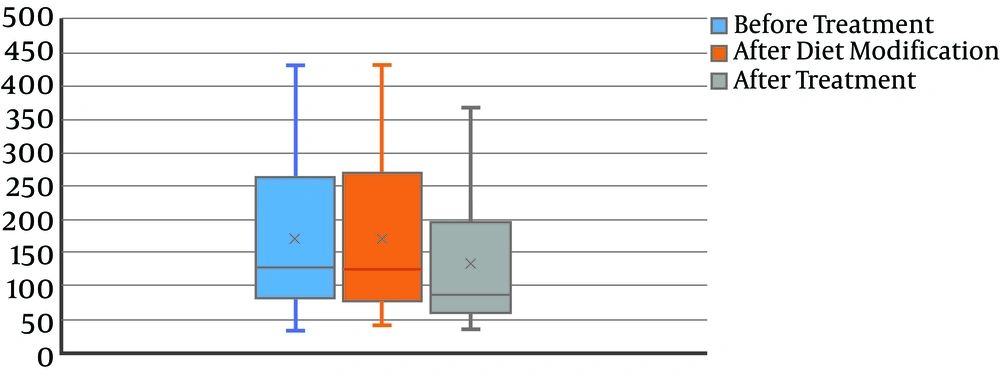
Figure 2.
Comparison of 24-hour urine calcium levels
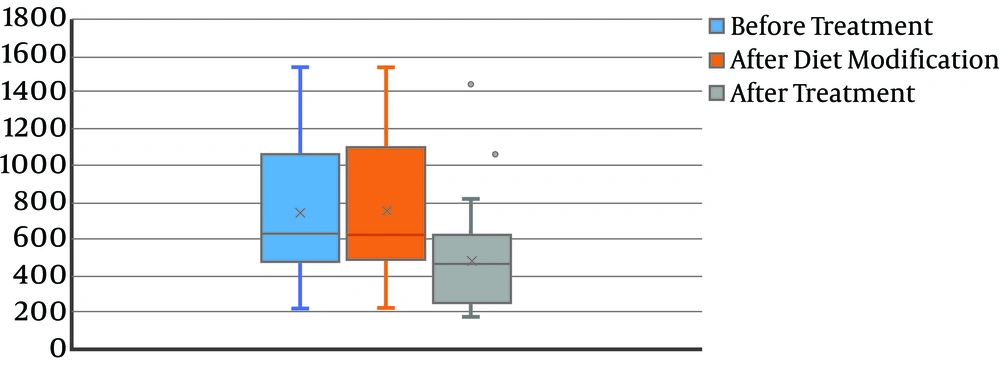
Figure 3.
Comparison of 24-hour uric acid levels

Figure 4.
Comparison of 24-hour Oxalate levels

Figure 5.
Comparison of 24-hour Citrate levels
5. Discussion
Kidney stones are among the most common health problems in developed countries. More than 50 percent of the patients present with recurrence of the stones within ten years. Urinary metabolites play a major role in the development of kidney stones. In recent years, several research studies have been performed on the application of different approaches to reduce the amount of urinary metabolites and thus decrease the risk of stone formation. A limited number of studies have investigated the antioxidant features of L-carnitine and its effects on the urinary metabolites in patients with renal stone formation. Although some studies have investigated the beneficial effects of L-carnitine on reducing the binding of urinary crystals and reducing stone formation, so far, no study has been carried out on 24-hour urinary metabolites in patients with a history of recurrent stone formation. Therefore, the present study evaluated the effects of L-carnitine on the amount of 24-hour urine metabolites in patients with a history of recurrent stone formation. Urinary calcium, uric acid, oxalate, and citrate levels showed no significant difference after the first two weeks of dietary adjustment without L-carnitine treatment. However, after L-carnitine treatment for eight weeks, a significant reduction in the levels of these metabolites was observed, except for calcium, 6 of 34 patients, unlike other patients, showed an increase in the urinary calcium after treatment. Consequently, the reduction in the mean calcium levels after treatment with L-carnitine was not statistically significant. Although, the level of citrate decreased after treatment with L-carnitine, this reduction was limited to the normal range. Also, renal stone size showed a reduction after treatment which was not statistically significant.
In a study, Muñoz et al. evaluated the effect of calcium oxalate on kidney stone formation. They reported that phytate + pyrophosphate and phytate + citrate mixtures had inhibitory effects on calcium oxalate crystallization, causing a decrease in the urinary concentration of calcium oxalate crystals. Their synergistic effect has also been previously presented (10). The results obtained in their study are consistent with the present findings. The study of Muñoz et al. pointed out the importance of related metabolites in patients with recurrent renal stone formation. In another study, Krieger et al. evaluated the effects of potassium citrate on renal stone in rats. The animal models were given 18% of a standard daily calcium share (1.2%) supplemented with potassium citrate or potassium chloride (4 mmol/day). Urine was collected after 6, 12, and 18 weeks. They observed that rats fed with potassium citrate had higher levels of urinary citrate, phosphate, oxalate, and PH and lower levels of urinary calcium. In rats fed with potassium citrate, the levels of calcium oxalate and calcium phosphate were higher and the level of uric acid was lower compared with the other group. The percentage of calcium phosphate type kidney stones was similar in both groups. In conclusion, they stated that potassium citrate effectively raises urinary citrate levels and reduces urinary calcium levels, increasing urinary PH, calcium, and oxalate leading to formation of calcium oxalate and calcium phosphate. These results suggest that potassium citrate can alter the chemical composition of urine and super-suction, but may not be effective in preventing calcium phosphate stones (11). The findings observed in this study were consistent with those obtained in the present one. The study of Krieger et al. indicated the importance of urinary metabolites in patients with renal stone. The present study was interventional and showed the differences in 24-hour urinary metabolites after treatment with L-carnitine.
Lee et al. in a study evaluating the effect of L-carnitine on the binding of calcium oxalate crystals to renal epithelial cells observed that L-carnitine partially destroys cell differentiation and resists adhesion to calcium oxalate monohydrate COM crystals. Accordingly, L-carnitine can be used as a potential treatment for recurrent urinary tract stones (12). Their finding is consistent with the results of the present study and demonstrates the importance of considering this treatment option. Mercadal et al. have also evaluated the effect of L-carnitine on bone mineral parameters in chronic renal failure patients. They reported that L-carnitine supplementation increased plasma calcium and phosphate concentrations, however no significant decrease in parathormone and fibroblast growth factor 23FGF23 was observed. The authors emphasized the importance of L-carnitine for patients undergoing dialysis and its effect on the blood parameters of these patients (7).The methods of this study are different from ours, and thus different results were obtained Frarto et al. have also observed that L-carnitine increases the uptake of osteoblast cells by activating signals related to calcium uptake and thus enhances bone turnover. This effect also reduces the renal excretion of calcium and consequently reduces the rate of stone formation in patients with nephrolithiasis (6). This finding is consistent with the results of the present study. Moreover, Bahani et al. evaluated L-carnitine as a chelator (fork factor) for calcium and suggested that L-carnitine, as a free substance in solution, may reduce free calcium levels. Accordingly, they concluded that since calcium is critical in the biochemical and physiological processes of living cells, L-carnitine can affect calcium-dependent biological systems by limiting calcium levels (2), This study in consistence with the present findings indicate the importance of using L-carnitine in patients with calcium stones. Considering the present findings in light of the results obtained in other studies, L-carnitine can be effective in improving urinary metabolites, thereby reducing recurrences of stone formation.
5.1. Conclusions
Although treatment with L-carnitine did not reduce the size of kidney stones, decreased urinary metabolite levels were observed after treatment. This, in turn may be effective in reducing recurrences of stone formation. Further studies are recommended to evaluate and compare the efficacy of multiple drugs in patients with recurrent nephrolithiasis.

