


1. Background
Diabetes mellitus is a debilitating disease, which is noticeably prevalent. In 2019, 463 million of the adult population were diagnosed with diabetes mellitus, and researchers predict that this number will increase up to 700 million by 2045 (1). It has been estimated that in Iran, the number of diabetic patients will reach 9.24 million by 2030 (2). Diabetic nephropathy is a common disorder in diabetic patients, and it is a cause of end-stage kidney disorder (ESKD) (3). It has been reported in 20 - 30% of diabetic cases worldwide and is more prevalent in type 2 diabetes mellitus (T2DM). Also, 44% of patients who undergo dialysis in the United States are diabetic patients (4). The first sign of diabetic nephropathy is microalbuminuria (MA), which is defined as 30 to 300 mg/g albumin to creatinine ratio (ACR). MA progression leads to macroalbuminuria (or proteinuria: 300 mg/g < ACR) (5). Macroalbuminuria progresses to ESKD, and after the development of ESKD, damages are not correctable (6). Thus, it is crucial to diagnose and cure MA before the development of macroalbuminuria and possibly ESKD.
Magnesium (Mg) is the most abundant intracellular cation and the fourth uttermost abundant mineral in the human body (7). Because of its many essential roles in the human body, including protein synthesis, Mg has been used for the prevention and treatment of many diseases (8). Some studies suggest that there is a relationship between serum Mg level and MA (9-11). However, their inconsideration of serious confounding factors makes their results questionable. Determination of the precise relationship between Mg and MA can help us provide diagnostic and treatment methods.
2. Objectives
Based on the importance of MA and its early diagnosis and treatment and the suggested advantages of Mg, we investigated the association between serum Mg level and MA in T2DM patients.
3. Methods
3.1. Participants
We carried out a cross-sectional study in nephrology and endocrinology clinics of the Imam Reza hospital in Mashhad, Iran from March 21, 2015, to March 20, 2016. One hundred twenty-two patients with T2DM were recruited. Patients were diagnosed based on the 2006 World Health Organization (WHO) diagnostic criteria of diabetes (12). Participants were divided into the microalbuminuria (MA) and non-microalbuminuria (NMA) groups and were matched based on the collected demographic data, including age and sex. Patients with known renal diseases affecting blood creatinine (Cr) levels, liver diseases, heart failure, drug history of taking medications affecting blood glucose, Mg and calcium (Ca) levels (including antiepileptic drugs, Mg and Ca supplements, corticosteroids, diuretics), pregnant and breastfeeding women, patients under the age of 16, febrile patients, patients who had heavy physical activities within the 24 hours before our test and patients who unwilling to participate in the study were excluded.
3.2. Measurements
To diagnose MA by the urine albumin creatinine ratio (UACR), spot midstream morning urine specimens were collected in the hospital. We advised participants not to engage in heavy physical activities within the 24 hours before sampling. The normal range of UACR was determined 30 or less milligram albumin per one gram Cr. We considered a range of 30 to 300 mg/g albumin to Cr as MA (13). Serum Mg levels were measured using a standard kit, and the amount of glomerular filtration rate (GFR) was estimated by the modification of diet in renal disease (MDRD) method (14).
3.3. Ethics
The approval was received from the Ethics Committee of Mashhad University of Medical Sciences. Written consent was obtained from all cases after they were clarified about the study, its aims, and the process details.
3.4. Statistical Analysis
Statistical analysis was carried out utilizing SPSS software (SPSS Inc. Released 2006. SPSS for Windows, Version 15.0, Chicago, SPSS Inc.). The comparison between the Mg level and urine albumin concentration of the MA and NMA groups was done using the independent sample t-test. Pearson or Spearman correlation was applied to assess the association between the Mg level and the urine albumin concentration. P-values below 0.05 were considered significant. Data are presented as mean and standard deviation.
4. Results
Demographic data and general characteristics of all the 122 patients included in our study are presented in Table 1. The proportion of males and females in our study population and the number of participants in the MA and NMA groups were 50.81% vs. 49.19% and 60 vs. 62, respectively. No significant difference was observed between the mean age of the two groups (NMA group = 58.01 ± 10.12; MA group = 59.26 ± 11.12). However, the mean body mass index (BMI) was significantly higher in the NMA group compared with the MA group (29.84 ± 5.64 vs. 27.31 ± 3.14, P-value = 0.003).
| Variables | All Patients (N = 122) | Non-microalbuminuria (N = 62) | Microalbuminuria (N = 60) | P-Values |
|---|---|---|---|---|
| Age (y) | 58.62 ± 10.59 | 58.01 ± 10.12 | 59.26 ± 11.12 | 0.897 |
| Male (%) | 52.45 | 54.83 | 50.00 | 0.96 |
| BMI (kg/m2) | 28.08 ± 4.62 | 29.84 ± 5.64 | 27.31 ± 3.14 | 0.003 |
| Creatinine (mg/dL) | 1.18 ± 0.36 | 1.16 ± 0.31 | 1.21 ± 0.42 | 0.448 |
| Mg (mg/dL) | 2.11 ± 0.42 | 2.10 ± 0.43 | 2.13 ± 0.42 | 0.674 |
| HbA1c (%) | 8.15 ± 1.76 | 7.63 ± 1.56 | 8.69 ± 1.82 | 0.001 |
| FBS (mg/dL) | 156.24 ± 46.70 | 147.00 ± 35.00 | 165.80 ± 55.00 | 0.03 |
| Albumin (mg/g creatinine) | 117.75 ± 251.59 | 15.90 ± 8.20 | 223.00 ± 328.00 | < 0.001 |
General and Clinical Characteristics of the Study Population a
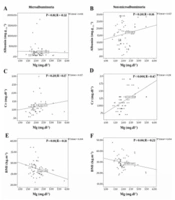
The serum Mg level was reported normal in both MA and NMA groups, and none of the participants were diagnosed with hypomagnesemia (2.13 ± 0.42 vs. 2.10 ± 0.43, respectively; P-value = 0.67). Our analysis showed no significant difference between the Mg level and the urine albumin concentration (P-values = 0.81 and 0.20, respectively). As shown in Figure 1, the Pearson correlation illustrated a weak correlation between the two parameters in each group. The correlation between these two parameters was negative for the MA group and positive for the NMA group (Pearson correlation values = -0.32 and 0.16, respectively).
 in Non-microalbuminuria group.")
Pearson Correlation analysis between; A, Level of magnesium and urine albumin concentration in Microalbuminuria group; B, Level of magnesium and urine albumin concentration in Non-microalbuminuria group; C, Levels of Magnesium and creatinine in Microalbuminuria group; D, Levels of magnsium and creatinine in Non-microalbuminuria group; e, Level of magnesium and BMI in Microalbuminuria group; F, Level of magnesium and body mass index (BMI) in Non-microalbuminuria group.
Furthermore, the Pearson correlation established a moderate correlation between the Mg and Cr levels in the NMA group (P-value < 0.001; R = 0.47) and the Mg level and BMI in the MA group (P-value = 0.01; R = -0.31) (Figure 1). However, the results showed no significant correlation between the urine albumin concentration and the fasting blood sugar (FBS), HbA1c, and Cr level. Similarly, Mg and HbA1c levels and Mg level and age did not have any significant correlation (Appendix 1 in Supplementary File).
5. Discussion
Nephropathy is one of the most common complications of diabetes mellitus. Microalbuminuria (MA) is one of the usual indicators of renal disorders (15, 16). Therefore, evaluating the factors affecting this marker is essential. Mg is a very important element as it is engaged in several mechanisms in the human body (7). The effect of Mg level on MA is still arguable. Thus, investigating the validity of this relation is of great importance.
In contrast to other studies, we found no significant correlation between serum Mg level and MA (9-11). The large sample size of such studies is an important factor, yet it is necessary to restrict many confounding factors. There are many disorders related to serum Mg level, and many drugs affect it directly and indirectly (7, 17). Not considering such confounding factors provides a large sample size. However, the effects of these factors challenge the accuracy of the findings; as Sadeghian et.al, who conducted a relevant study, believe in these confounding factors (11). We excluded confounding factors carefully and avoided cases with febrile diseases, major physical activity within the last 24 hours before the test, cardiac diseases, liver or renal disorders, history of taking drugs affecting blood sugar as well as Mg or Ca (e.g. Mg or Ca supplements, corticosteroids, antiepileptic drugs, and diuretics), pregnant and breastfeeding women and cases under the age of 16. This gave us a reliable sample, making our study narrow and our results precise.
We could not perform all Mg measurement tests due to financial limitation and only used the main and most usual test (serum Mg concentration or SMC) (7). Obtaining other results was possible by conducted an intracellular Mg test (18) because magnesium is one of the most abundant intracellular cations, and more than 90% of it, is intracellular and only 1% is present in serum (7). Ionized serum Mg and urinary Mg repletion are two different tests (7), but we confined our test to SMC as it was more usual.
We also found that BMI is higher in non-microalbuminuria patients. It is quite interesting because many articles have claimed that high BMI and obesity lead to MA and other types of proteinuria (19, 20). Mohammedi et al. have stated that the risk of renal failure increases by 4% with each BMI unit increment (21). It makes the result seems a bit odd at first, but there are other aspects. Some articles did not find a significant association between higher BMI and the increment of albumin in the urine (22). It is important to notice that ethnic and geographic factors, as well as cultural factors, may affect the physiological condition and BMI, as well (23, 24). Sato et al. showed a "U-shaped" relation between BMI and proteinuria (25). It means that not only BMI increments but also it decrements away from the normal extent lead to proteinuria. Accordingly, our data can be explained because our higher mean BMI might be within the normal extent. To give an exact explanation, we need more data about our region, provided by studies the same as Sato’s study (25). To the best of our knowledge, such studies have not been conducted yet. Therefore, to give an exact comment, further studies are needed on BMI and MA, independent of other factors and localized in our region.
Many studies have opposed the association between BMI and MA (19, 25-27) but the idea indicating an association between high BMI and disease prevention or improvement can be easily denied. Nakken et al. showed that higher BMI can decrease the risk of amyotrophic lateral sclerosis (ALS) (28).
Our study had some limitations. First, we had a small sample size, and more studies with larger sample sizes are suggested. Second, we could not use more reliable tests, like intracellular Mg or ionized serum Mg (because of limited resources) and future studies should include such tests in their studies. The most important point of our study was our precise exclusion criteria, which provided a reliable sample for us that increased the accuracy of results.
5.1. Conclusion
We found that there is no significant association between serum Mg level and MA in patients without a history of diseases or medication taking. Since the diabetic patients were not affected with hypomagnesemia, we do not suggest further Mg supplementation.
