


1. Background
Cardiovascular events are the leading global cause of death, accounting for almost half (48.6%) of all deaths alongside cancer each year (1). There is evidence indicating that for patients with coronary artery disease, vascular calcification emerges at the initial course of the disease (before the appearance of symptoms). In this regard, two explanations can be provided: (1) first, calcification in the intima results in calcified atherosclerotic plaques, which can consequently cause ischemic cardiac events; and (2) second, calcification of the media layer of the vessel produces vascular stiffness and eventually leads to left ventricular hypertrophy and heart failure by increasing the afterload (2). At this early stage, evaluation of calcification of the coronary arteries is only possible by imaging techniques (3); for which matter, the Agatston score is the gold standard that not only is highly sensitive and specific but also is applicable for various age groups (4).
Calcification of coronary arteries is a common complication of renal failure (5) and the leading cause of death in this population. However, its multifactorial mechanism is not fully understood. It can be hypothesized that chondrocyte- or osteoblastic-like changes are induced in smooth muscle cells of the vessel wall, and this modification is due to toxic levels of serum calcium and phosphorus, secondary to abnormal bone metabolism and decreased renal excretion (6). In addition, it can be argued that increased calcification observed in this group is due to the complications related to renal failure, including anemia, hypertension, dyslipidemia, oxidative stress, and uremia, or common risk factors such as diabetes and old age, both of which are risk factors for coronary artery calcification (CAC) (7).
Studies intended to evaluate the independent impact of renal failure on CAC have failed to contribute the high prevalence of calcification to the effect of established risk factors, such as hypertension, hyperlipidemia, old age, diabetes, and smoking (8-11). In this sense, renal failure can be considered an independent risk factor for vascular calcification. Although most studies did not consider confounding factors sufficiently; hence, deduction of an independent role for declined renal function in cases that suffer from CAC is not yet possible. Under such an assumption, early diagnosis and early intervention for renal insufficiency may reduce mortality caused by subsequent cardiac events.
Contrary to end-stage renal disease, few studies have investigated the effect of mild kidney dysfunction on vascular calcification. Although most patients suffer from earlier stages of chronic kidney disease, gathering information about this group is of most importance yet (12-16).
2. Objectives
The current study aimed to, firstly, investigate the association between renal dysfunction and the calcification of coronary arteries in patients with severe and milder stages of renal failure and, secondly, to determine the role of this variable by eliminating the effect of established confounding factors.
3. Methods
3.1. Patient Selection
A total of 261 individuals were enrolled in this retrospective study (from September 2019 to October 2020). Most of the patients were asymptomatic with cardiovascular risk factors or manifested atypical symptoms. Exclusion criteria included: (1) previous CABG (coronary artery bypass graft surgery) or history of coronary stent placement; (2) cardiac valve replacement; (3) dialysis-dependent renal failure; and (4) incomplete demographic and lab data.
3.2. CT Scan Protocol
Patients with an initial heart rate greater than 65 bpm received an oral dose of B-blocker (50 mg metoprolol) approximately one hour before imaging. An ECG-gated multidetector CT scan was performed using a 128-slice scanner (Siemens Medical Systems, Forchheim, Germany) without IV contrast injection to quantify CAC. Coronary CT scan images were interpreted by a radiologist experienced in cardiac radiology.
3.3. Data Collection
Demographic information, medical history, and health-related behaviors were recorded by a self-administered questionnaire with the help of a trained employee. Demographic and blood pressure data were recorded by a trained nurse. Laboratory results were collected from the medical records of patients.
Estimated GFR was calculated using the Cockcroft-Gault and MDRD equations based on the lowest serum creatinine level recorded three months before imaging.
3.4. Measurement of CAC
The CAC score was calculated using the method described by Agatston et al., which is based on the area of a calcified plaque and density factor (4). CACS is divided into 5 stages as follow: no calcification (0), minimal calcification (1 - 10), mild calcification (11 - 99), moderate calcification (101 - 400), and extensive calcification (> 400). According to the previous studies, the presence of significant CAC was defined as CACS > 100 (17-19).
3.5. Statistical Analyzes
Independent t-test, Mann-Whitney U test, Pearson correlation, and multivariate logistic regression analysis were used to analyze the data. Continuous variables are described as mean ± standard deviation (SD). The association between dichotomous data was analyzed by the chi-square test. An independent sample t-test was used to compare means of quantitative variables in subgroups of CACS. The significance of the association between demographic and clinical variables with the mean CAC scores was evaluated using the Mann-Whitney U test. Pearson correlation was used to evaluate the correlation between continuous variables and CACS as well as to calculate the correlation coefficients. Univariate analysis in binary logistic regression was also employed to define the association between predictors and outcome using odds ratio and confidence interval. Eventually, logistic regression was used for multivariate analysis. We administered SPSS version 16 for data analysis.
4. Results
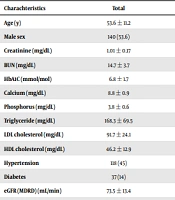
A total of 261 patients were recruited for this study [121 females (44%) and 140 males (56%)], with a mean age of 54.6 ± 11.1 years. Of all participants, 134 cases were diagnosed with CAC, with a mean CAC score of 83.4 ± 18. The association between CAC score and different demographic and laboratory factors was evaluated using Pearson correlation (Table 1). In addition, a comparison of each characteristic separated by the sub-group (CACS ≤ 100 and CACS > 100) is provided in Table 2.
| Predictors | CACS | ||
|---|---|---|---|
| Mean ± SD | r | P Value | |
| Age | 53.6 ± 11.2 | 0.31 | < 0.01 |
| Systolic blood pressure | 129 ± 17.4 | 0.17 | 0.02 |
| Diastolic blood pressure | 82.5 ± 6.8 | 0.17 | 0.03 |
| Cr | 1.01 ± 0.17 | 0.35 | < 0.01 |
| BUN | 14.7 ± 3.7 | 0.26 | < 0.01 |
| HbA1C | 6.7 ± 1.7 | 0.16 | 0.04 |
| Ca | 8.7 ± 0.9 | -0.03 | 0.64 |
| Ph | 3.8 ± 0.6 | 0.01 | 0.89 |
| TG | 168.2 ± 69.5 | 0.23 | < 0.01 |
| LDL | 91.6 ± 24.1 | 0.06 | 0.43 |
| HDL | 46.2 ± 12.9 | 0.03 | 0.69 |
| eGFR (MDRD) | 73.5 ± 13.4 | -0.28 | < 0.01 |
| eGFR (Cockcroft-Gault) | 88.7 ± 21.6 | -0.34 | < 0.01 |
Pearson's Correlation Coefficient for the Relationship between Predictors and the Severity of Coronary Artery Calcification
| Charachteristics | Total | CACS ≤ 100 | CACS > 100 | P Value |
|---|---|---|---|---|
| Age (y) | 53.6 ± 11.2 | 51.5 ± 11 | 61.6 ± 7.9 | < 0.01 |
| Male sex | 140 (53.6) | 104 (50.2) | 36 (66.6) | 0.03 |
| Creatinine (mg/dL) | 1.01 ± 0.17 | 0.99 ± 0.16 | 1.12 ± 0.18 | < 0.01 |
| BUN (mg/dL) | 14.7 ± 3.7 | 14.3 ± 3.4 | 16.1 ± 4.5 | < 0.01 |
| HbA1C (mmol/mol) | 6.8 ± 1.7 | 6.7 ± 1.7 | 6.9 ± 1.7 | 0.54 |
| Calcium (mg/dL) | 8.8 ± 0.9 | 8.8 ± 0.9 | 8.7 ± 0.8 | 0.43 |
| Phosphorus (mg/dL) | 3.8 ± 0.6 | 3.8 ± 0.5 | 3.8 ± 0.9 | 0.87 |
| Triglyceride (mg/dL) | 168.3 ± 69.5 | 163 ± 65.4 | 184.7 ± 79.6 | 0.11 |
| LDL cholesterol (mg/dL) | 91.7 ± 24.1 | 91.8 ± 24.4 | 91.5 ± 23.3 | 0.94 |
| HDL cholesterol (mg/dL) | 46.2 ± 12.9 | 45.7 ± 12.8 | 48 ± 13.5 | 0.3 |
| Hypertension | 118 (45) | 84 (40) | 34 (62) | < 0.01 |
| Diabetes | 37 (14) | 28 (13) | 9 (16) | 0.55 |
| eGFR (MDRD) (mL/min) | 73.5 ± 13.4 | 75.4 ± 13.1 | 66 ± 11.8 | < 0.01 |
| eGFR (Cockgraft-Gault) (mL/min) | 88.7 ± 21.6 | 92.5 ± 21.1 | 74 ± 16.9 | < 0.01 |
Basic Demographic and Medical Information in Relation to CACS, Univariate Analysis a
According to the findings, the older the case, the higher was the degree of CAC. Accordingly, participants in the CACS ≤ 100 subgroup were younger than those in the CACS > 100 subgroups by 10.1 years (51.5 ± 11 vs. 61.6 ± 7.9, respectively; P < 0.01). Men had higher CAC scores than females (113.08 vs 49.05, respectively; P-value = 0.003), and only 18 patients in CACS > 100 subgroup were women (33.3%).
Systolic and diastolic blood pressures were both positively correlated with CAC scores (P-value = 0.02 and P-value = 0.03, respectively). Hypertension was reported in 40 and 62% of patients with CACS ≤ 100 and CACS > 100, respectively (P-value < 0.01). HbA1C showed a weak correlation with the CAC score (P-value = 0.04). This correlation remained significant only in CACS > 100, suggesting no considerable impact on lower grade calcification. In addition, a history of diabetes did not have a significant effect on the degree of coronary calcification (P-value = 0.55). Higher triglyceride levels demonstrated a direct association with the formation of atherosclerotic plaques; however, similar to HbA1C, this effect was non-significant in CAC scores < 100. Not surprisingly, renal insufficiency was associated with increased CAC; while lower eGFR (calculated using both Cockcroft-Gault and MDRD equations) was associated with more calcification (P-value < 0.01). Only 18.5% of patients with moderate and severe CAC had normal kidney function (eGFR ≥ 90) in comparison to 52.7% among those with mild calcification.
Our analysis shows that serum Ca, P, LDL, and HDL levels did not have a significant influence on calcification changes.
The results of multivariate logistic regression analysis are provided in Table 3. After adjusting for confounding factors, male sex, age, triglyceride level, and eGFR were recognized as independent risk factors of CACS ≥ 100, a marker of coronary artery atherosclerosis. However, HbA1C and systolic and diastolic blood pressure were no longer considered effective in adding to the risk of CAC. Even after considering hypertension a categorical variable, similar results were obtained, and still, there was no significant association between CACS and hypertension.
| Predictor | Odds Ratio (95% Confidence Interval) | P-Value in Multivariate Analysis |
|---|---|---|
| Gender | 0.28 (0.11 - 0.77) | 0.01 |
| Age | 1.07 (1.02 - 1.13) | < 0.01 |
| Triglyceride | 1.01 (1 - 1.01) | 0.03 |
| eGFR (MDRD) | 0.94 (0.89 - 0.98) | 0.01 |
| Systolic blood pressure | 0.99 (0.96 - 1.02) | 0.45 |
| Diastolic blood pressure | 1.03 (0.94 - 1.14) | 0.52 |
| HbA1C | 0.91 (0.67 - 1.18) | 0.47 |
Predictors of Increased CACS in Multivariate Analysis by Logistic Regression
5. Discussion
The primary objective of this research was to evaluate the association between renal function decline and CAC. The findings of the present study are consistent with previous studies, which demonstrate a positive correlation between lower eGFR and higher calcification (20-22). Our observation indicates a higher frequency of CAC among older patients and men, which is in accordance with the findings of other studies. For instance, Shemesh reported that CAC is three times more frequent in men, and among those older than 50 years, the frequency increases for both sexes, but the increase is greater for women (23).
According to the findings of the univariate analysis, systolic and diastolic blood pressure were both predictors of a greater degree of calcification of the coronary arteries. However, after applying multivariate logistic regression, the level of their significance was declined. Some studies reported similar results (24), while some proposed an independent role for hypertension. It seems studies that considered hypertension as a strong predictor have either limited their findings to univariate analysis or have not considered eGFR as a confounding factor (25, 26). In this survey, we proposed an important role for impaired kidney function as a confounding factor that determines the outcome. Hence, probably hypertension is an intermediate variable. By increasing the sample size, more strong results can be obtained.
According to our analysis, HbA1C is positively correlated with calcification, although this correlation was confined to higher degrees of calcification. On the other hand, a history of diabetes alone was not considered a major risk factor for the prediction of coronary calcification, which emphasizes the importance of blood sugar control in the long term for the prevention of cardiac events. Although some authors reported a role for diabetes, regardless of the glycemic control (27-29), the Multi-Ethnic Study of Atherosclerosis (MESA) did not confirm this association (30). Other researchers such as Carson et al. considered a greater weight for HbA1C and believed that advanced CAC progression is correlated with higher HbA1C levels, even among non-diabetic patients (31). Similar to previous studies (32, 33), our findings indicate that higher triglyceride levels are associated with an increased probability of CAC. This correlation is stronger in higher CACS and remains positive after adjusting for confounding factors.
Concerning the evaluation of the association between CAC and glomerular filtration rate, we observed a gradual and independent association between lower eGFRs and higher CAC scores. In the present study, patients were classified based on their eGFR (≥ 90, 90 - 60, < 60) in order to evaluate the effect of mild renal insufficiency on clinically significant vascular calcification (CACS > 100). Mild kidney dysfunction was not associated with a significant increase in calcification. In the same vein, Kramer et al. reported (34) that calcification was increased in coronary arteries of patients with eGFR < 60. They also suggested that concurrent diabetes mellitus caused a 9-fold increase in the risk of CAC development. Also, in a cross-sectional study, Hyun et al. (2019) evaluated the independent effect of eGFR on CAC score and demonstrated a positive and independent association between eGFR and CAC (21). On the contrary, some studies reported no significant association between eGFR and vascular calcification (26, 32).
Some researchers mentioned serum phosphorus levels as important predictors of CAC (35, 36). Nevertheless, others questioned this conclusion, which is in line with this study (no significant correlation). Tuttle and Short proposed that baseline CAC score was not related to serum phosphorus level; however, after five years of follow-up, higher phosphorus levels proved to be associated with CAC score progression or development of new calcification (26).
5.1. Conclusion
The present study intended to evaluate the impact of renal failure on CAC. After adjusting for confounding factors, male sex, older age, triglyceride level, and eGFR were recognized as independent risk factors of increased CAC.
