


1. Background
Chemotherapy-induced nausea (CIN) is a debilitating side effect of antineoplastic drugs leading to exacerbated disability and declined adherence to the treatment (1, 2). Nausea is considered as one of the main side effects due to chemotherapy (3). Chemotherapy-induced nausea and vomiting (CINV) may occur up to 120 hours (five days) after initiation of treatment with antineoplastic drugs and can be acute or late. The acute phase occurs within 24 hours after initiation of chemotherapy, and the late phase occurs within 24 - 120 hours (4). Nausea and vomiting occur mainly within the acute phase, adversely affecting the patients' personal and working life (5, 6).
To date, several studies have confirmed the association between certain factors and CIN; these factors include age (7-10), family support (11), lack of food intake (12), type of chemotherapy drug with different emetogenic potential (10, 13), treatment course, and adjuvant radiotherapy (13). However, the association of some factors with CIN is still controversial. While the effects of expecting nausea (7, 14) and female gender (10, 13) on CIN have been confirmed in some studies, some other studies did not report such an association (7, 8). This inconsistency in the findings necessitates further investigation in this regard.
Although, several associated factors have been studied for nausea and vomiting of pregnancy (NVP), and postoperative nausea and vomiting (PONV), these factors were not investigated in the CIN. In this regard, the associations between certain factors such as education level (15), being employed (16), development of nausea after smelling a certain odor, and the satisfaction of social support (17) with NVP were studied. In addition, the effects of body mass index (BMI) (18, 19), smoking (20), narcotics (21), and pain (22) have been investigated for PONV. As far as the researchers investigated, there is no study to evaluate the correlation between CIN and these factors.
2. Objectives
This study aimed to investigate the factors potentially associated with CIN.
3. Methods
A case–control study was conducted in the Hematology-Oncology Ward and the Outpatient Chemotherapy Clinic in Hamedan. After the Ethics Committee of the Hamedan University of Medical Sciences approved the study protocol, 144 cancer patients were selected by convenience sampling. The inclusion criteria were being under chemotherapy, sufficiently conscious and able to speak, and receiving the first dose of the chemotherapy medicines since the initiation of the second cycle onwards within the past 24 hours (acute phase). The patients at acute phase of chemotherapy were assigned to case group (n = 58) if they had nausea and to control group (n = 86) if they did not have nausea.
The data on the patients, both with and without nausea, were collected by a researcher-made questionnaire developed according to the relevant literature. The questionnaire consisted of items on sociodemographic and clinical characteristics. The sociodemographic characteristics included gender (13), age (7-10), BMI (23), education level (15), employment status (16), urbanization, residential type, marital status, having health insurance, and economic status. Information about the food consumption (12), the type of the last food consumption before the chemotherapy, the time interval between the last food consumption and chemotherapy, history of smoking and drug abuse (20), having expectation of nausea following chemotherapy (7, 14), feeling nausea following some factors, and satisfaction of social support (17) were also considered.
The clinical information investigated the type of chemotherapy medicines for emetogenic potential (10), antiemetic agents taken by the patient at acute phase (8), pain (22), the type of cancer, and the number of chemotherapy periods.
The questionnaires were filled out through interviews with the patients and their medical records after completion of the acute phase of chemotherapy.
Data analysis was conducted by SPSS software version 13. Descriptive statistics were expressed as frequency and mean. Chi-square and Fisher's exact tests were used to investigate association between the studied variables and nausea. For all tests, the level of significance was 0.05. Since the dependent variable was binary, the logistic regression was used to conduct data analysis, and the result was expressed as adjusted odds ratio (OR).
4. Results
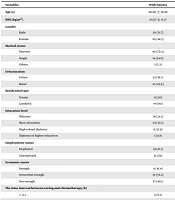
Most of the participants in the two groups were male, married, literate, unemployed, and lived in urban areas. Most patients in the two groups did not report any history of smoking (Tables 1 and 2).
| Variables | With Nausea | Without Nausea | P-Value |
|---|---|---|---|
| Age (y) | 46.66 ± 16.98 | 47.65 ± 16.67 | 0.62 b |
| BMI (kg/m2) | 24.07 ± 9.27 | 22.41 ± 4.01 | 0.24 b |
| Gender | 0.447 c | ||
| Male | 30 (51.7) | 50 (58.1) | |
| Female | 28 (48.3) | 36 (41.9) | |
| Marital status | 0.24 c | ||
| Married | 40 (70.2) | 64 (74.4) | |
| Single | 14 (24.6) | 13 (15.1) | |
| Others | 3 (5.3) | 9 (10.4) | |
| Urbanization | 0.45 c | ||
| Urban | 32 (56.1) | 53 (62.4) | |
| Rural | 25 (43.9) | 32 (37.6) | |
| Residential type | 0.75 c | ||
| Tenant | 11 (20) | 18 (22.2) | |
| Landlord | 44 (80) | 63 (77.8) | |
| Education level | 0.95 c | ||
| Illiterate | 19 (33.3) | 31 (36) | |
| Basic education | 24 (42.1) | 32 (37.2) | |
| High school diploma | 9 (15.8) | 15 (17.4) | |
| Diploma of higher education | 5 (8.8) | 8 (9.3) | |
| Employment status | 0.81 c | ||
| Employed | 23 (41.1) | 37 (43) | |
| Unemployed | 33 (59) | 49 (57) | |
| Economic status | 0.17 c | ||
| Enough | 9 (16.4) | 8 (10) | |
| Somewhat enough | 19 (34.5) | 20 (25) | |
| Not enough | 27 (49.1) | 52 (65) | |
| The time interval between eating and chemotherapy (h) | 0.32 c | ||
| < 0.5 | 4 (8.3) | 10 (13.2) | |
| 0.5 - 1 | 8 (16.7) | 20 (26.3) | |
| 1 - 2 | 8 (16.7) | 14 (18.4) | |
| > 2 | 28 (58.3) | 32 (42.1) | |
| Which one affected your nausea in past 24 hours? | 0.007 c | ||
| Odors | 30 (51.7) | 27 (31.4) | |
| Consuming some foods | 6 (10.3) | 5 (5.8) | |
| Seeing somethings | 0 (0) | 3 (3.5) | |
| Taking some medicines | 12 (20.7) | 14 (16.3) | |
| Nothing | 10 (17.2) | 37 (43) | |
| Type of food consumed before chemotherapy | 0.003 c | ||
| Carbohydrate | 8 (16.3) | 37 (49.3) | |
| Dairy products | 20 (40.8) | 21 (28) | |
| Vegetables | 9 (18.4) | 7 (9.3) | |
| Protein | 10 (20.4) | 6 (8) | |
| Fatty | 2 (4.1) | 4 (5.3) | |
| Food consumption before the chemotherapy | 11 (19) | 8 (9.3) | 0.18 c |
| The satisfaction of social support | 40 (27.77) | 71 (49.3) | 0.05 c |
| Having health insurance | 56 (98.2) | 83 (96.5) | 0.53 c |
| Having history of smoking | 6 (10.5) | 13 (15.1) | 0.40 c |
| Having history of drug abuse | 5 (5.8) | 6 (10.5) | 0.30 c |
| Having nausea expectation | 45 (77.6) | 32 (37.2) | 0.00 c |
Comparison of the Sociodemographic Characteristics Between Groups a
| Variables | With Nausea | Without Nausea | P-Value |
|---|---|---|---|
| Emetogenic potential of chemotherapy drugs | 0.02 c | ||
| High | 10 (18.2) | 3 (3.6) | |
| Moderate | 10 (18.2) | 19 (22.6) | |
| Low | 31 (56.4) | 46 (54.8) | |
| Very low | 4 (7.3) | 15 (17.9) | |
| The type of cancer | 0.26 c | ||
| Gastrointestinal | 41 (70.7) | 66 (76.7) | |
| Non gastrointestinal | 17 (29.3) | 20 (23.3) | |
| Take antiemetic medication during acute phase | 15 (34.1) | 26 (36.1) | 0.49 c |
| Having pain during acute phase | 52 (61.2]) | 21 (41.1) | 0.019 c |
| number of chemotherapy periods | 4.56 ± 3.13 | 5.42 ± 6.00 | 0.009 b |
Comparison of the Clinical Information Between Groups a
To investigate the association of the factors between the two groups with CIN, logistic regression models were used according to the crude and adjusted OR.
Logistic regression analysis and backward method were used to evaluate the important factors affecting the nausea according to previous studies. Out of the variables included in the model (type of food, factors affecting nausea, pain in the acute phase, emetogenic potential of chemotherapy drugs, number of chemotherapy periods, BMI, and expecting nausea), several variables, including expected nausea after chemotherapy, pre-chemotherapy carbohydrate consumption, a specific odor, presence of pain in the acute phase of the chemotherapy, and receiving chemotherapy drugs with high nausea-inducing potential were effective on the outcome of post-chemotherapy nausea. Also, the chance of nausea in patients expecting to be at higher risk of post-chemotherapy nausea was 6.458 higher than those who did not have such an expectation. The chance of nausea in patients who consumed carbohydrates before chemotherapy was 1.288 times higher than those who did not eat any food. Smelling a specific smell during the acute phase of chemotherapy led to 1.559-fold increase in the chance of nausea as compared to those who did not smell any odor. Patients who had pain in the acute phase of chemotherapy had a 2.426-fold increase in having the chance of nausea as compared to patients who did not have pain. The increasing rate of nausea-inducing property of the drug led to an increase in the chance of post-chemotherapy nausea (OR = 2.366) (Table 3).
| Variables | B | S.E. | Wald | df | Sig. | Exp (B) |
|---|---|---|---|---|---|---|
| Having nausea expectation | 1.865 | 0.494 | 14.240 | 1 | 0.000 | 6.458 |
| Type of food; Non (reference) | 7.582 | 3 | 0.055 | |||
| Carbohydrate | 0.253 | 0.730 | 0.121 | 1 | 0.728 | 1.288 |
| Fatty | -1.570 | 0.621 | 6.382 | 1 | 0.012 | 0.208 |
| Others | -0.924 | 1.046 | 0.781 | 1 | 0.377 | 0.397 |
| Factors affecting nausea; Non (reference) | 5.356 | 2 | 0.069 | |||
| Consuming some foods | -1.090 | 0.527 | 4.276 | 1 | 0.039 | 0.336 |
| Smelling odors | 0.444 | 0.904 | 0.241 | 1 | 0.623 | 1.559 |
| Having pain during acute phase | 0.886 | 0.465 | 3.631 | 1 | 0.057 | 2.426 |
| High emetogenic potential of chemotherapy drugs | 0.861 | 0.304 | 8.031 | 1 | 0.005 | 2.366 |
| Number of chemotherapy periods | -0.104 | 0.062 | 2.774 | 1 | 0.096 | 0.902 |
| Constant | -2.642 | 2.023 | 1.706 | 1 | 0.192 | 0.071 |
The Results of Logistic Regression Final Step
5. Discussion
In the current study, most subjects, either with or without nausea, had meal before the chemotherapy. There was no significant difference between the two groups in terms of the time interval between eating and starting chemotherapy. The results also showed that the chance of nausea in patients who consumed carbohydrates before chemotherapy was 1.288 times higher than those who did not eat any food. However, Booth (2007) reported that lack of eating food before chemotherapy was a risk factor for nausea and vomiting (12).
Most patients with nausea reported having history of developing nausea at acute phase of chemotherapy following smelling a specific odor. Also, smelling a specific odor during the acute phase of chemotherapy led to 1.559-fold increase in the chance of nausea as compared to those who were not exposed to any odor. However, it is recommended to avoid using perfume and strong odors in delivering nursing care to patients under chemotherapy to prevent nausea. As far as the researchers of this study investigated, there is no study to examine the association between smelling a specific odor and development of nausea; however, Soltani demonstrated that smelling odor caused pregnancy-induced nausea (17).
In the current study, expecting nausea was found to be significantly associated with development of nausea, such that the likelihood of nausea was 6.458 times higher in patients expecting nausea than in those not expecting nausea. Consistently, some studies have indicated that patients expecting nausea experience CIN more frequently (7, 14). Moreno et al. argued that having history of nausea and vomiting was a risk factor for nausea and vomiting after surgery (24), while Molassiotis et al. study showed that expecting nausea was not a significant factor for CINV (8). The findings of the current study highlight paying greater attention to the patients' expecting nausea and prevention of nausea via pharmacologic and non-pharmacologic approaches.
This study demonstrated that nausea and the type of chemotherapy drug were significantly associated with different emetogenic potential. Fraunholz et al. demonstrated that the emetogenic potential of chemotherapy protocol was the most important risk factor for the development of nausea and vomiting (10).
Our findings showed a significant association between feeling pain and developing CIN such that the likelihood of nausea was 2.426 times higher in patients feeling pain than in those without pain. Consistent with the current study, Gan and Watcha reported that postsurgical pain led to development of nausea and pain after surgery (22, 25). This study further confirms that greater attention should be paid to pain and preventing it in patients under chemotherapy using pharmacologic and non-pharmacologic approaches.
A strength of our study was that CIN-associated factors were investigated in patients with any type, rather than a specific type, of cancer referring for chemotherapy, including lymphoma, leukemia, lung cancer, breast cancer, larynx cancer, skin cancer, bone cancer, and brain cancer. In addition, this study investigated a wide spectrum of variables because nausea occurs most frequently at the acute phase of chemotherapy.
A limitation of the current study was that the results cannot be generalized to the late phase because we investigated the association of the above factors with CIN incidence only in the acute phase. Besides, because the patients were asked questions that required them to recall what happened 24 hours ago, they might not recall everything completely; and this increases the risk of recall bias.
5.1. Conclusion
The final model demonstrated that the likelihood of nausea was 2.426 and 6.458 times higher at the acute phase of chemotherapy in patients feeling pain and expecting nausea than in those without pain and not expecting nausea, respectively.
Chemotherapy consumption of carbohydrates or smelling a specific odor in the acute phase led to 1.288- and 1.559-fold increase in the chance of nausea, respectively, as compared to those who did not eat any food or were not exposed to any odor. The chance of nausea increases with the use of high nausea-inducing chemotherapy drugs. Therefore, nurses and physicians are recommended to pay greater attention to these factors and help to reduce CIN significantly through educating and mediating the factors.
