
1. Background
Coronavirus disease 2019 (COVID-19) is a worldwide pandemic disease. Several risk factors associated with the severity of COVID-19 are explained, such as obesity, older age, hypertension (HTN), diabetes mellitus (DM), and cardiovascular disease (1). Notably, HTN is considered to be one of the most important risk factors associated with COVID-19 mortality (2). One of the common pharmacological treatments in hypertensive patients is angiotensin II type-I receptor blockers (ARB) or angiotensin-converting enzyme inhibitors (ACEI). It has been hypothesized that treating patients with ACEI/ARB may increase the ACE2 expression on the cells, thereby facilitating the virus binding to the epithelial cells (3).
2. Objectives
Since there are conflicting results about the effect of ACEI/ARB on the outcomes and severity of the disease, this study aimed to evaluate hypertensive patients’ outcomesby comparing ACEI/ARB and non-ACEI/ARB users.
3. Methods
This retrospective study was conducted from March 2021 to June 2021. Totally, 138 hypertensive patients (81 ACEI/ARB users) with positive COVID-19 PCR test or a compatible lung CT-scan who referred to Imam Hossein and Loghman Hakim hospital were enrolled. Patients under 18 and with a history of cancer and ESRD patients were excluded. The blood pressure of all the patients was kept under 140/90 mmHg with antihypertension treatment. The hospital electronic health records were the data source.
Baseline data included gender, age, underlying disease (cardiovascular, renal disease, and diabetes mellitus), drug history (ASA, statin, etc.), and COVID-19 testing one week after admission. The data at discharge time included the data of the last medical record within one week before the discharge, including the drugs used for COVID-19 treatment and clinical outcomes. The institutional Ethics Committee of the Research Institute affiliated with Shahid Beheshti University of Medical Sciences (IR.SBMU.MSP.REC.1399.23806) approved the research. This study was confronted with Declaration of Helsinki. All participants signed a written informed consent form.
3.1. Statistical Analysis
Continuous variables are shown as mean ± standard deviation (SD) or, in case of non-normal, as median and interquartile range (IQR). Categorical variables are represented as frequency and percentage. The normality assumption was tested using Kolmogorov-Smirnov test. To assess the baseline characteristics differences between the two groups of ACEI and non-ACEI users, t-test or Mann-Whitney U test was used for normal and non-normal variables, respectively. For qualitative variables, chi-square test was used. In addition, COX regression model was used at the univariate and multivariable levels to investigate the effect of using ACEI on COVID-19 death with controlling other possible confounding variables. First, a univariate model was fitted to find out important factors that have an effect on mortality. In the next step, a stepwise selection model was applied, which included a backward approach to find a final model. Besides, the proportional hazards assumption of cox analysis was assessed using Schoenfeld residual test. The Schoenfeld residual test applies the assumption that the risks are proportional to variables that have a p-value of more than 0.05. A p-value of less than 0.5 was considered statistically significant using SPSSv software version 25.
4. Results
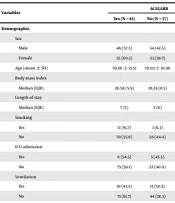
Of the 138 hospitalized whose COVID-19 was confirmed, 80 (57.9%) were male. Moreover, the mean ± SD age of the subjects was 70.3 ± 12.4 years, and the median time of COVID-19-related hospitalization was seven days (interquartile: 6). Of all the hospitalized patients studied, 38 (27.5%) expired in the hospital. All baseline information, including the groups of ACEI/ARB and non-ACEI/ARB users, is presented in Table 1. No significant differences were seen among all variables regarding demographic, comorbidities, treatments for the disease, and symptoms between the two groups except for smoking status, which was significantly higher in ACEI/ARB users (P-value = 0.015). After investigating the important variables and using them in final model, multivariate final adjusted cox regression model, by considering the effect of other variables, showed that increased age (HR = 1.04, 95% CI = 1.01 - 1.07, P = 0.003) and non- ACEI/ARB users (HR = 2.12 95% CI = 1.12 - 4.13, P = 0.021) were associated with increased risk of in-hospital mortality. All results of crud (univariate) and adjusted (multivariate) models are shown in Table 2.
Table 1.
Comparison of the Baseline Characteristics of Hospitalized COVID-19 Patients Between ACEI/ARB and Non-ACEI/ARB Groups a
| Variables | ACEI/ARB | P-Value | ||
|---|---|---|---|---|
| Yes (N = 81) | No (N = 57) | Total (N = 138) | ||
| Demographic | ||||
| Sex | 0.738 | |||
| Male | 46 (57.5) | 34 (42.5) | 80 (100) | |
| Female | 35 (60.3) | 23 (39.7) | 58 (100) | |
| Age (mean ± SD) | 70.66 ± 13.51 | 70.03 ± 10.96 | 70.39 ± 12.47 | 0.764 |
| Body mass index | 0.089 | |||
| Median (IQR) | 26.56 (5.9) | 28.28 (6.5) | 26.99 (6.2) | |
| Length of stay | 0.172 | |||
| Median (IQR) | 7 (5) | 5 (6) | 7 (6) | |
| Smoking | 0.015 | |||
| Yes | 11 (91.7) | 1 (8.3) | 12 (100) | |
| No | 70 (55.6) | 56 (44.4) | 126 (100) | |
| ICU admission | 0.761 | |||
| Yes | 6 (54.5) | 5 (45.5) | 11 (100) | |
| No | 75 (59.1) | 52 (40.9) | 127 (100) | |
| Ventilation | 0.104 | |||
| Yes | 10 (43.5) | 13 (56.5) | 23 (100) | |
| No | 71 (61.7) | 44 (38.3) | 115 (100) | |
| Underling diseases | ||||
| Cardiovascular disease | 0.606 | |||
| Yes | 29 (61.7) | 18 (38.3) | 47 (100) | |
| No | 52 (57.1) | 39 (42.9) | 91 (100) | |
| Diabetes mellitus | 0.219 | |||
| Yes | 36 (54.5) | 30 (45.5) | 66 (100) | |
| No | 45 (62.5) | 27 (37.5) | 72 (100) | |
| Chronic kidney disease | 0.140 | |||
| Yes | 13 (46.4) | 15 (53.6) | 28 (100) | |
| No | 68 (61.8) | 42 (38.2) | 110 (100) | |
| Medicine for COVID-19 | ||||
| Hydroxychloroquine | 0.884 | |||
| Yes | 66 (58.4) | 47 (41.6) | 113 (100) | |
| No | 15 (60) | 10 (40) | 25 (100) | |
| Hydroxychloroquine and azithromycin | 0.552 | |||
| Yes | 31 (62) | 19 (38) | 50 (100) | |
| No | 50 (56.8) | 38 (43.2) | 88 (100) | |
| Interferon | 0.318 | |||
| Yes | 13 (50) | 13 (50) | 26 (100) | |
| No | 68 (60.7) | 44 (39.3) | 112 (100) | |
| Naproxen | 0.823 | |||
| Yes | 11 (61.1) | 7 (38.9) | 18 (100) | |
| No | 70 (58.3) | 50 (41.7) | 120 (100) | |
| AntibioticsIV | 0.772 | |||
| Yes | 71 (59.2) | 49 (40.8) | 120 (100) | |
| No | 10 (55.6) | 8 (44.4) | 18 (100) | |
| Kaletra | 0.914 | |||
| Yes | 32 (59.3) | 22 (40.7) | 54 (100) | |
| No | 49 (58.3) | 35 (41.7) | 84 (100) | |
| Symptoms | ||||
| Dyspnea | 0.614 | |||
| Yes | 60 (60) | 40 (40) | 100 (100) | |
| No | 21 (55.3) | 17 (44.7) | 38 (100) | |
| Cough | 0.779 | |||
| Yes | 46 (59.7) | 31 (40.3) | 77 (100) | |
| No | 35 (57.4) | 26 (42.6) | 61 (100) | |
| Phlegm | 0.104 | |||
| Yes | 17 (73.9) | 6 (26.1) | 23 (100) | |
| No | 64 (5.7) | 51 (44.3) | 115 (100) | |
| Fever | 0.144 | |||
| Yes | 41 (53.2) | 36 (46.8) | 77 (100) | |
| No | 40 (65.6) | 21 (34.4) | 61 (100) | |
| Chills | 0.069 | |||
| Yes | 27 (71.1) | 11 (28.9) | 38 (100) | |
| No | 54 (54) | 46 (46) | 100 (100) | |
| Fatigue | 0.714 | |||
| Yes | 28 (60.9) | 18 (39.1) | 46 (100) | |
| No | 53 (57.6) | 39 (42.4) | 92 (100) | |
| Nausea | 0.881 | |||
| Yes | 19 (57.6) | 14 (42.4) | 33 (100) | |
| No | 62 (59) | 43 (41) | 105 (100) | |
| Vomiting | 0.500 | |||
| Yes | 16 (53.3) | 14 (46.7) | 30 (100) | |
| No | 65 (60.2) | 43 (39.8) | 108 (100) | |
| Myalgia | 0.153 | |||
| Yes | 14 (73.7) | 5 (26.3) | 19 (100) | |
| No | 67 (56.3) | 52 (43.7) | 119 (100) | |
a Values are expressed as No. (%) unless otherwise indicated.
Table 2.
Factors Related to In-hospital Mortality Based on Univariate and Multivariable Cox Proportional Hazards Regression Model
| Variables | Crude HR, a 95% CI | P-Value | Adjusted HR, 95% CI | P-Value |
|---|---|---|---|---|
| Age (y) | 1.04 (1.01 - 1.07) | 0.003 | 1.04 (1.01 - 1.07) | 0.003 |
| Sex | 0.340 | 0.242 | ||
| Female | Ref | - | Ref | |
| Male | 1.39 (0.70 - 2.73) | 1.50 (0.76 - 2.96) | ||
| ACEI/ARB | 0.019 | 0.021 | ||
| Yes | Ref | - | Ref | |
| No | 2.18 (1.13 - 4.20) | 2.15 (1.12 - 4.13) | ||
| ASA | 0.053 | 0.052 | ||
| Yes | Ref | - | Ref | |
| No | 2.79 (0.98 - 7.92) | 2.81 (0.99 - 7.99) |
a Hazard ratio: The model was fitted based on Schoenfeld residual test to evaluate proportional hazards assumption with P = 0.806.
5. Discussion
In this retrospective study, we found in-hospital mortality hazard ratio was higher in non-ACEI/ARB group and older ages compared to ACEI/ARB users. HTN is one of the most common comorbidities among COVID-19 patients. Other common comorbidities are diabetes and coronary heart disease. Previous reports showed that most of the dead patients were elderly subjects with multiple risk factors such as HTN. Thus, HTN is an important risk factor that may increase the disease mortality and severity (6, 7).
ACEI/ARB drugs are widely used for the treatment of hypertensive patients. Renin-angiotensin system (RAS) plays an important role in HTN pathogenesis and ACEI/ARB drugs inhibit the RAS. Some studies were reported that the expression of ACE2 on alveolar epithelial cells was associated with acute lung injury. It is considered that ACE2 is one of the COVID-19 cellular receptors. Previous studies demonstrated that using ACEI/ARB might influence the ACE2 expression but whether it could clinically affect its activity is under debate yet (3, 8). On the other hand, ACE2 may have protective roles by counterbalancing the over-activated ACE-AngII-AT1R axis in the pathogenesis of cardiovascular disease and lung injury (9). Thus, ACEI/ARB may have a protective role against severe COVID-19 (10).
Our results showed that in-hospital mortality hazard ratio was higher in older ages and non-ACEI/ARB group compared to ACEI/ARB users. However, a recent metanalysis revealed that there was no association between prior use of ACEI/ARB and risk of COVID-19 infection among a total of 49 studies. The mortality risk and severe outcomes also remained unchanged among ACEI/ARB users (11). In line with our results, a meta-analysis showed that using ACEI/ARB reduced the risk of critical disease and mortality risk by 23% (2). However, whether ACEI/ARB may reduce the disease severity or may be considered an effective therapeutic strategy for COVID-19 is not clear yet (11, 12).
In contrast to our results, Alrashed et al. concluded that ACEI/ARB were associated with more severe and critical disease and intensive care unit (ICU) care among hypertensive patients (5). These controversies may be explained by different definitions of the severity of COVID-19 infection and different populations in previous studies. Furthermore, more COVID-19 severity and mortality are expected in these high-risk participants with several comorbidities such as HTN, DM, and renal disease (2, 5).
Our study has several limitations and strengths. First, the study design was retrospective, and we could not randomize the patients in the two groups (ACEI/ARB and non-ACEI/ARB). Thus, it is recommended to conduct further clinical trials to understand the effect of ACEI/ARB on the patients’ outcomes. Second, we could not differentiate between ACEI and ARB users. The third was our small sample size and short follow-up period. On the other hand, one of our main study strengths was comparing the outcomes of COVID-19 in ACEI/ARB and non-ACEI/ARB users in Iranian hypertensive patients.
5.1. Conclusions
We found that in-hospital mortality in COVID-19 was higher in non-ACEI/ARB users and older ages than ACEI/ARB user patients. This may demonstrate the positive effects of ACEI/ARB treatment on the outcomes of the patients.
References