


1. Background
End-stage renal disease is a significant public health problem worldwide (1). As one of the renal replacement therapeutic methods, hemodialysis (HD) plays an essential role in the mortality rate of patients with kidney failure (2, 3). The efficacy and quality of HD are closely related to the treatment modality, dialyzer, and membrane type (4). Cellulose membranes affected immune components, especially the complement system, and induced an inflammatory reaction as one of the bio-incompatibility indices (5). Chemically developed synthetic polymers appeared to mitigate this activation (6). The bio-incompatibility concerning complement and leukocytes is not so strong when synthetic and modified cellulosic membranes are used (7). In recent years, dialyzers have been explicitly changed according to the dialysis technique. High cut-off, medium cut-off (MCO), internal hemodiafiltration, online hemodiafiltration (OL-HDF), and poly (methyl methacrylate) (PMMA) are some of these dialysis techniques. Improvements in dialysis filters make HD more efficient and effective (8). Therefore, these changes lead to a better quality of life in chronic HD patients.
Bashiri et al. compared the contamination of the hepatitis C virus passing through two types of filters, PS10 (Mediatex, Iran) and Lups (Bio brand, Germany), to each other. It was shown that both types of filters have the same characteristics (9). Donati et al. compared three different types of hemodialyzers for free light chain removal. No significant difference was observed between HFR17 (Bellco, Mirandola, Italy) and PMMA (Toray Filtryzer BK-F, Tokyo, Japan) filters. Furthermore, both filters were similar and more effective than the F7 filter (Fresenius F7HPS, Bad Homburg, Germany) in removing light chains in chronic dialysis patients (10). The type and design of filters and materials used in the structure of filters determine the health status of patients, their quality of life, and the occurrence of complications during HD.
2. Objectives
This study, aimed to determine the efficacy and complications of modified polyethersulfone (m-PES)-1.5 hollow fiber filters in comparison to conventional filters (i.e., PS16 and PS160).
3. Methods
This non-inferiority crossover 2 × 2 randomized clinical trial was performed in adult dialysis units at three HD centers in Isfahan, Iran, within May 2019 to March 2020. The inclusion criteria were patients on HD three times per week for more than 3 months, older than 20 and younger than 75 years, with stable physical and biochemical status (corrected calcium > 8 mg/dL, potassium ≤ 5.5 mEq/L, and hematocrit > 20%), with stable vascular access, with hemodynamic stability (90 mmHg < systolic blood pressure (SBP) < 180 mmHg), without cardio-cerebrovascular event and active infection in the last 3 months, and without a history of malignancy. The exclusion criteria were patients with hospitalization for any cause, blood transfusion, and refusal to give consent.
The participants were randomly selected from eligible individuals and randomly assigned to two control and intervention groups. The random block randomization method was followed using www.sealedenvelope.com. In this study, blinding for the physician, patients, and nurses responsible for inserting the filter and measuring the factors related to dialysis adequacy could not be performed; nevertheless, the person responsible for analyzing the data was not aware of the filter type received by each patient. A study conducted by Shigematsu et al. was used to determine the sample size (11). Group A was put on HD for 2 weeks (six sessions of HD) at first with low or high flux smart flux filter (m-PES-1.5 hollow fiber), which was made in Italy by Medica S.P.A. Group (Mahan Med Mayme Kish Company, Iran) with a surface size of 1.5 m2. This type of filter was made of PES and sterilized with beta irradiation. Group B was hemodialyzed with a corresponding low flux (PS16) or high flux (PS160) filter made in Iran by Meditechsys Company with a surface size of 1.6 m2. It was made of polysulfone (PS) and was sterilized with ethylene oxide. The reason for choosing these filters was that the surface area was the most similar to the studied filters available in Iran. After 2 weeks of HD with these filters, the patients were hemodialyzed with the previous filters used as usual. This phase is known as the washout period. As the last stage of the study, the patients were dialyzed for 2 weeks (six sessions) with the opposite filter of the first 2 weeks.
In other words, group A was dialyzed with a low flux (PS16) or high flux (PS160) filter, and group B was dialyzed with a low or high flux smart flux filter (m-PES-1.5 hollow fiber). If there were any complications with using the new filter, a commission consisting of team physicians, a company representative, and a representative of the Isfahan Kidney Diseases Research Center, Isfahan University of Medical Sciences, Isfahan, Iran would decide whether the patient should be excluded from the study or the study should be completed out of turn.
Blood sampling to assess laboratory variables was performed before the first session of HD (session 0) and then repeated during the sixth session of HD with each m-PES and PS filter (session 6). Laboratory variables included pre-and post-dialysis blood urea nitrogen (BUN), pre-dialysis creatinine, hemoglobin, calcium, phosphorus, and potassium. Kt/V and urea reduction ratio (URR) as indicators of dialysis adequacy were calculated based on laboratory and clinical parameters. The arterial line of the dialysis circuit was sampled at the beginning of the dialysis session to measure the biochemical parameters before dialysis. At the end of dialysis, the blood pump speed was reduced to 50 ccs per minute for 30 to 40 seconds, and then the blood sample was drawn again to measure BUN. Patients’ body weights were measured before and after each dialysis session.
Blood pressure is one of the clinical variables measured before dialysis and then at the first, second, third-, and fourth-hours during dialysis. Complications during dialysis related to the patients included allergy (pruritus), shortness of breath, drop in blood pressure, cramps during dialysis, and complications related to the filters, including packaging problems, leakage from the flange connection, leakage from the connection to the set, leakage from the inlet port of the dialysis solution, rupture and breakage of the fiber, and blood clotting in the fibers. These complications were evaluated and recorded by the nurses and physicians in charge.
The blood clotting parameter was divided into mild, moderate, and severe subgroups. Mild means less than 10% clot formation and greater than or equal to 10%. Moderate means less than or equal to 50% clot formation. Severe means more than 50% clot formation. Pruritus was also divided into mild, moderate, and severe subgroups. In the mild form, there was mild pruritus without any agitation; in the moderate type, there was pruritus plus agitation; however, dialysis continued; in the severe type, the onset of the symptoms was less than 30 minutes after the beginning of dialysis, and there was severe agitation with dialysis discontinuation (12).
The data collection tool was a checklist that consisted of two parts. The first part was related to demographic information and the results of the patient’s clinical examinations, including age, gender, height, weight, and duration of dialysis. The second part of the checklist was related to the results of paraclinical tests, including the determinants of the patient’s clinical condition before the beginning and at the end of the study, the desired outcome of the study, adequacy of dialysis, side effects, and control parameters.
3.1. Ethical Approval
This study was approved by the Research Ethics Committee of Isfahan University of Medical Sciences, Isfahan, Iran (No: IR.MUI.RESEARCH.REC.1398.298) and was registered in the Iranian Registry of Clinical Trials (IRCT20090127001598N5). The study has been independently reviewed and approved by this Research Ethics Committee. Details of the study were explained to the participants prior to joining the study, and written informed consent was obtained from all patients.
3.2. Statistical Analysis
Descriptive statistics for all recorded variables, including mean and standard deviations of quantitative variables reported before and after each period, were prepared separately for the two filter groups. Additionally, frequency and percentage were reported for qualitative variables related to complications. An independent t-test was performed to investigate the statistically significant differences between baseline variables and dialysis adequacy in the two groups. The Chi-square test was also performed to compare the frequency of complications in the two groups of filters. Furthermore, a multinomial logistic regression model was used to investigate the differences in the filter type in coagulation intensity.
To compare the changes in mean blood pressure at different hours, due to the lack of hypothesis of normality and homogeneity of the distribution of blood pressure variables, the linear model generalized estimating equation (GEE) was used. Then, a linear mixed-effects model was considered using the random effect to examine the individual effect, treatment sequence, treatment period, and type of filter on dialysis adequacy parameters. All statistical analyses were performed using SPSS software (version 20.0 for Windows). A P-value less than 0.05 was considered statistically significant.
4. Results
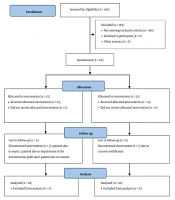
Among 240 patients on HD in three HD centers, 46 patients meeting the inclusion criteria entered the study. Six patients were excluded from the study. Finally, 40 patients were entered into the final analysis (Figure 1). The mean values of pre-dialysis weight in hemodialyzed patients with m-PES and PS filters were reported as 71.04 ± 21.66 and 70.47 ± 15.08 kg (P = 0.6), respectively. After six dialysis sessions, the mean weights of these two groups were 68.68 ± 23.79 and 67.91 ± 23.79 kg (P = 0.5), respectively. Patients’ laboratory variables and blood pressure profiles are summarized in Table 1. As shown in this table, no statistically significant differences were observed in laboratory parameters between these two groups. In the second hour, the lower levels of SBP and diastolic blood pressure (DBP) were recorded in both groups, statistically significant but not within the hypotensive ranges. Due to the abnormal and heterogeneous distribution between measured blood pressure at different hours of dialysis, the GEE linear model was used to study the changes in measured blood pressure at different times during dialysis between two filter types. The results showed no statistically significant difference between the changes in blood pressure at different times during dialysis in the two groups (SBP: P = 0.50, DBP: P = 0.80).

Consort flow diagram
| Variables | Mean ± SD | P-Value | |
|---|---|---|---|
| M-PES | PS | ||
| BUN (mg/dL) | |||
| Session 0 | 55.31 ± 11.28 | 48.71 ± 13.86 | 0.88 |
| Session 6 | 48.51 ± 13.16 | 48.33 ± 13.69 | 0.95 |
| Cr (mg/dL) | |||
| Session 0 | 7.80 ± 2.02 | 7.70 ± 2.17 | 0.83 |
| Session 6 | 7.77 ± 2.12 | 7.66 ± 2.11 | 0.81 |
| URR | |||
| Session 0 | 0.70 ± 0.06 | 0.69 ± 0.08 | 0.42 |
| Session 6 | 0.69 ± 0.08 | 0.69 ± 0.07 | 0.99 |
| Kt/V | |||
| Session 0 | 1.54 ± 0.30 | 1.58 ± 0.36 | 0.62 |
| Session 6 | 1.42 ± 0.32 | 1.48 ± 0.28 | 0.36 |
| Ca (mg/dL) | |||
| Session 0 | 8.48 ± 0.63 | 8.52 ± 0.57 | 0.75 |
| Session 6 | 8.48 ± 0.78 | 8.32 ± 0.79 | 0.36 |
| Ph (mg/dL) | |||
| Session 0 | 4.9 2 ± 1.45 | 4.62 ± 1.13 | 0.31 |
| Session 6 | 4.59 ± 0.88 | 4.74 ± 1.53 | 0.58 |
| K (mEq/L) | |||
| Session 0 | 4.97 ± 0.79 | 4.95 ± 0.89 | 0.90 |
| Session 6 | 4.96 ± 0.89 | 4.89 ± 0.66 | 0.65 |
| Hb (g/dL) | |||
| Session 0 | 11.12 ± 1.79 | 11.23 ± 1.68 | 0.78 |
| Session 6 | 11.19 ± 1.64 | 11.05 ± 1.73 | 0.71 |
| SBP before (mmHg) | 123 ± 20 | 127 ± 21 | 0.07 |
| SBP first hour (mmHg) | 123 ± 19 | 125 ± 20 | 0.19 |
| SBP second hour (mmHg) | 124 ± 20 | 128 ± 21 | 0.05 |
| SBP third hour (mmHg) | 123 ± 19 | 126 ± 20 | 0.11 |
| SBP fourth hour (mmHg) | 124 ± 21 | 124 ± 18 | 0.82 |
| SBP after (mmHg) | 123 ± 22 | 124 ± 20 | 0.44 |
| DBP before (mmHg) | 71 ± 16 | 72 ± 14 | 0.12 |
| DBP first hour (mmHg) | 71 ± 12 | 70 ± 11 | 0.81 |
| DBP second hour (mmHg) | 70 ± 11 | 72 ± 10 | 0.03 |
| DBP third hour (mmHg) | 70 ± 12 | 71 ± 10 | 0.26 |
| DBP fourth hour (mmHg) | 72 ± 11 | 70 ± 11 | 0.24 |
| DBP after (mmHg) | 73 ± 13 | 71 ± 10 | 0.11 |
. Laboratory Variables and Blood Pressure Profiles in Two Groups of Patients Dialyzed with Two Types of Filters (Modified Polyethersulfone and Polysulfone)
Complications associated with the patients and the types of filters are shown in Table 2. Packaging problems and blood clotting were two significantly different complications between these two groups of filters. More blood clotting occurred in the Medica S.P.A. Group filter (Mahan Med Mayme Kish Company). In addition, the multinomial logistic regression model showed higher odds of the occurrence of medium-level clotting in Medica S.P.A. Group filter (Mahan Med Mayme Kish Company) than the control group filters. The average odds of blood clotting in Mahan Med filters were 3.58 times higher than in control filters.
| Variables | M-PES (No. %) | PS (No. %) | P-Value |
|---|---|---|---|
| Complications related to patients | |||
| Pruritus a | 0.50 | ||
| Mild | 2 (0.8) | 2 (0.8) | |
| Moderate | 0 | 1 (0.4) | |
| Severe | 0 | 0 | |
| Shortness of breath | 1 (0.4) | 0 | 0.99 |
| Drop in blood pressure | 28 (11.4) | 18 (7.6) | 0.14 |
| Cramps | 6 (2.5) | 3 (1.3) | 0.50 |
| Complications related to the type of filters | |||
| Packaging problems | 35 (14.3) | 3 (1.2) | < 0.001 |
| Leakage from the flange connection | 1 (0.4) | 1 (0.4) | 0.99 |
| Leakage from the connection to the set | 0 | 1 (0.4) | 0.49 |
| Leakage from the inlet port of the dialysis solution | 0 | 1 (0.4) | 0.49 |
| Rupture and breakage of the fiber | 0 | 0 | 0.99 |
| Blood clotting b | 0.009 | ||
| Mild | 65 (26.6) | 53 (22.5) | |
| Moderate | 25 (10.2) | 8 (3.4) | |
| Severe | 3 (1.2) | 2 (0.8) |
Comparison of Complications Related to Patients and Types of Dialysis Filters Between Two Groups (Modified Polyethersulfone and Polysulfone)
Linear mixed-effect regression model for all variables, including URR, BUN, Kt/V, creatinine, and hemoglobin, was fitted by considering the individual effect as the random effect. Additionally, the treatment effect, carry-over effect, and sequence effect were investigated in the model. As observed, there was no significant difference between the two groups for none of the variables. Moreover, the carry-over effect and the sequence effect of treatment were not significant.
In subgroup analysis, the effect of high flux in comparison to low flux filters was evaluated. Patient-related complications included pruritus, shortness of breath, drop in blood pressure, and cramps during dialysis. Furthermore, filter-related parameters, including leakage from the flange connection, leakage from the connection to the set, leakage from the inlet port of the dialysis solution, rupture, and breakage of the fiber and blood clotting, were analyzed. There was no statistical difference in the high flux in comparison to low flux subgroups except for blood clotting, which showed a significant difference between the two types of filters only in high flux subgroups (Table 3). In subgroup analysis, the packaging problem was also a complication related to filters, which was significantly different in the high flux filters (P < 0.001). However, the packaging problem had no significant difference between low flux filters (P < 0.11).
| Variables | Blood Clotting; No. (%) | P-Value | |||
|---|---|---|---|---|---|
| No | Mild | Moderate | Severe | ||
| Low flux | 0.153 | ||||
| M-PES1.5 | 96 (76.8) | 20 (16.0) | 9 (7.2) | 0 (0) | |
| PS16 | 104 (84.6) | 16 (13.0) | 3 (2.4) | 0 (0) | |
| High flux | 0.043 | ||||
| M-PES1.5 | 55 (46.2) | 45 (37.8) | 16 (13.4) | 3 (2.5) | |
| PS160 | 69 (61.1) | 37 (32.7) | 5 (4.4) | 2 (1.8) | |
Subgroup Analysis Comparing Blood Clotting in High and Low Flux Filters
5. Discussion
This study was performed to compare two groups of filters, low or high flux smart flux filter (m-PES-1.5 hollow fiber) made in Italy by Medica S.P.A. Group (Mahan Med Mayme Kish Company) and low flux (PS16) or high flux (PS160) filter made in Iran by Meditechsys Company. Although the studied filters had a lower surface area than the filters of the control group, they were not inferior in terms of dialysis adequacy factors, such as URR, Kt/V, BUN, and creatinine, and were similar to conventional filters. In addition, other laboratory parameters, including calcium, phosphorus, potassium, and hemoglobin, were compared that indicated no significant difference.
A study was conducted in Taiwan in 2017 to evaluate the effect of dialyzer membranes on the survival of patients undergoing chronic HD. Seven types of filters were compared based on basic factors, dialysis-related factors, and nutrition factors. The PS membranes were considered control group filters. The PES was the other group of these filters. The mortality rate was higher in all groups except for the PES group. Additionally, similar to the results of this study, between the PS and PES groups, there was no significant difference in terms of basic and dialysis-related factors (13).
According to another study in 2020 in Sweden that compared an MCO dialyzer with hemodiafiltration, two groups of patients underwent 4-hour HD. The first group was dialyzed with post-dilution OL-HDF (Polyflux 210H), and the second group was dialyzed with an MCO dialyzer (Theranova 500) in an HD mode. As in the current study, to reach the patients’ steady state, patients had at least 2 weeks as the washout period and underwent ordinary HDF in this period. Cystatin C, as a small middle molecule, had a higher reduction ratio with HDF. However, no other difference was observed (14). Kreusser et al. compared mortality and morbidity between two types of synthetic filters (i.e., PS and PMMA) regardless of whether they are high or low flux. This study evaluated mortality and morbidity due to laboratory parameters, such as anemia, inflammation, and nutrition, in dialysis patients. Mortality had no significant difference between these two groups of filters. However, significant improvements were noticed in anemia, malnutrition, and inflammation with PMMA filters, compared to PS filters (15).
One of the patients’ complications evaluated in this study was pruritus. This complication is categorized into three subgroups (i.e., mild, moderate, and severe). Although pruritus is one of the most common complications in chronic HD patients, the intensity of pruritus had no significant differences between the present study’s two groups. According to a 5-year cohort study in Taiwan in 2013, the relationship between uremic pruritus and dialysis adequacy was measured. It was shown that higher Kt/V and high-flux dialyzer reduce pruritus intensity (16). Another study was conducted in 2014 in Poland. The aforementioned study showed that despite the massive effect of pruritus on the quality of life, no association was observed between demographic factors (e.g., gender, age, comorbidities, and underlying renal disease) and the presence or intensity of pruritus (17).
Fazendeiro Matos et al. showed that the cleaner the filters were at the end of dialysis, the greater the dialysis adequacy with that type of filter. The aforementioned study also concluded that the more unfractionated heparin (UFH) was used, the less likely it was to form clots (18). According to this relationship, it might be concluded that a higher amount of UFH is required to reduce the possibility of blood clotting in new filters. Additionally, there was a significant difference in blood clotting between Meditechsys and m-PES filters in the present study. This difference existed in the moderate clotting subgroup. Despite this difference, the rate of clot formation was within the expected range and did not cause a reduction in dialysis efficacy between the groups (19, 20).
The packaging problem was one of the complications associated with filters, which differed significantly between the two groups of filters. Nevertheless, this difference might be related to the manufacturer. Another reason for this difference could be their long-distance transport to their destination. Therefore, the local production of these filters might solve this problem. Each of these hypotheses is the reason for this difference; it is crucial to inform the manufacturer about this problem.
In the second hour of dialysis, SBP and DBP were significantly lower in the m-PES filter group, mostly due to increased blood pressure in the PS group. Additionally, more stable blood pressures were observed in the m-PES group. This difference was evaluated by other statistical tests, which were not significant.
The limitations of this study include the small sample size and the restriction of access to filters due to sanctions that affected Iran. Therefore, the local production of these filters could be a beneficial solution. The lack of blindness in patients is another limitation of this study. However, most of the study outcomes were objective and measured by the relevant parameters, and patients’ opinions did not affect the measurement of the study outcomes.
5.1. Conclusions
The present study showed that smart flux HD filters manufactured by Medica S.P.A. Group (Mahan Med Mayme Kish Company) with halo fiber model m-PES made of PES with a surface size of 1.5 m2 with high and low flux permeability have approximately the same quality as 1.6 m2 Meditechsys Company filters. In addition, due to the packaging problems, it is recommended to modify the packing method. It might be resolved if these filters are manufactured in Iran to decrease filter damage during long-distance transport.
