1. Background
With the continuous rise of chronic kidney disease (CKD) among the list of causes of death, it is estimated that CKD will become the fifth highest cause of years of life lost globally by 2040 (1). Compared to the healthy population, the risk of stroke is 5 - 30 times higher in CKD patients on maintenance hemodialysis, with corresponding case fatality rates as high as 90%. Cerebral small vessel disease (CSVD) is a chronic disorder of small vessels with a diameter between 50 - 400 µm within the brain and results in a more than threefold independent increase in the risk of stroke (2). Cerebral small vessel disease in the brain is diagnosed through a routine MRI scan using the STRIVE protocol (Standards for Reporting Vascular Changes on Neuroimaging). Diffusion tensor imaging (DTI) is a relatively newer MRI imaging modality of the brain that focuses on evaluating restrictions in the direction of Brownian motion of water molecules as an early surrogate marker of white matter tract integrity in the brain (3).
Fractional anisotropy (FA), axial diffusivity (AD), radial diffusivity (RD), and mean diffusivity (MD) are four parameters of DTI investigation. In recent studies, white matter tracts have shown decreased FA in CKD patients (4-7) because of CSVD. Additionally, few studies have correlated these changes depicted by DTI analysis with clinical parameters of neurocognition (5, 8). Therefore, DTI is a new quantitative imaging modality that can potentially be used for the early detection of white matter disease due to CSVD in CKD patients. However, most recent studies on DTI are conducted using the tract-based spatial statistics (TBSS) method, which is an excellent research tool for group analysis of DTI patients but is complicated and cannot be tested on a single patient. We attempted to calculate DTI parameters using commercially available software using the volume of interest (VOI) method (9). We investigated the null hypothesis that the DTI parameters - FA, MD, RD, AD in white matter tracts of CKD patients on (CKD-maintenance hemodialysis [MHD]) are not significantly different from those in the control population with normal renal function (NC) in the Indian population.
2. Objectives
Our additional objective was to correlate these DTI parameters with each other to gain insights into the pathogenesis of CSVD in the brain in dialysis patients in the Indian population. Moreover, numerous studies have found DTI to be a better marker for CSVD than conventional MRI findings (10-12). In a subgroup of CKD-MHD patients with normal routine MRI, we attempted to find if DTI parameters in the brain are significantly different from healthy controls.
3. Methods
3.1. Case and Control Selection
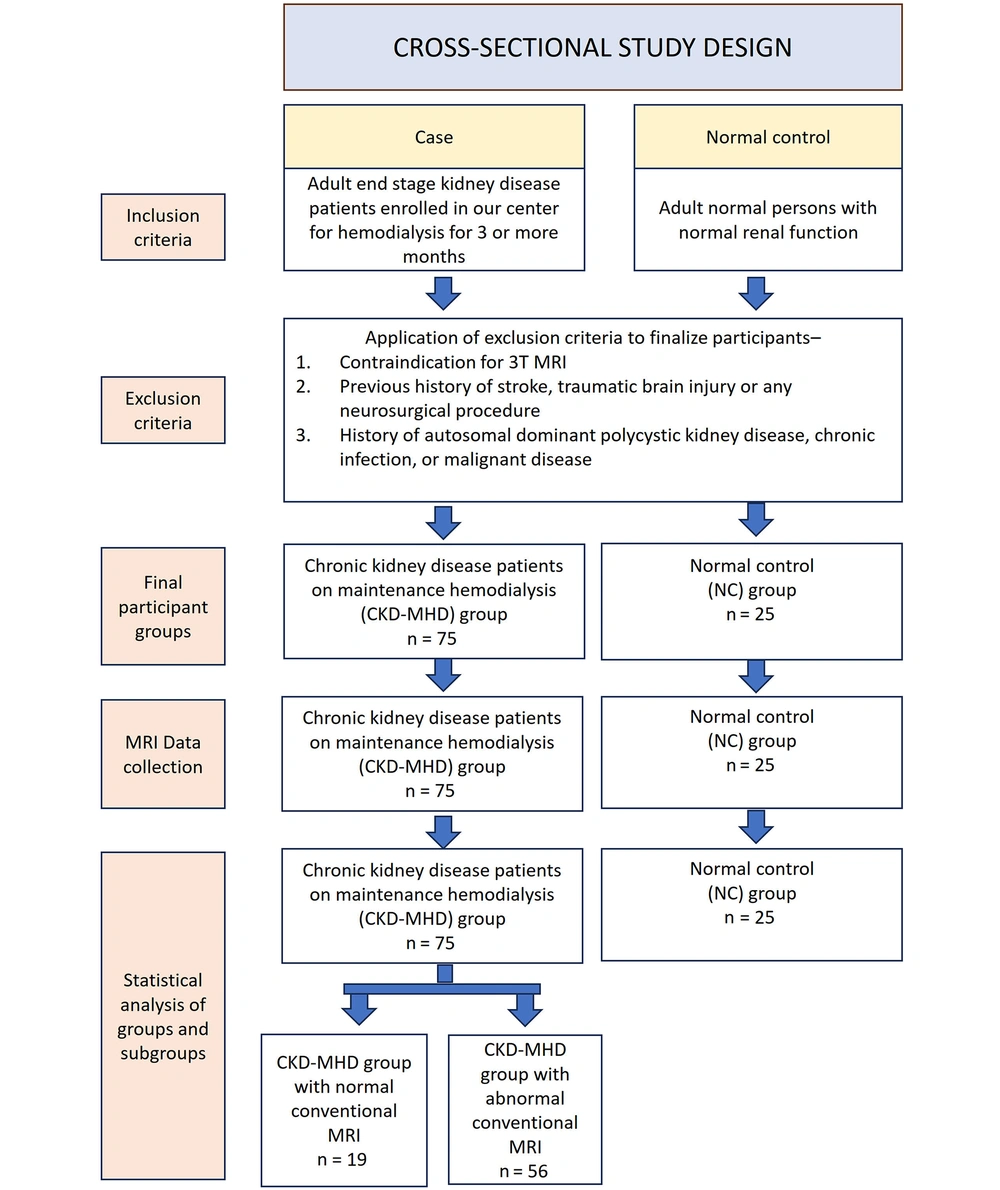
After securing institutional ethics approval (IESC/S.SP/2019/02 dated 25.05.21), a cross-sectional study with a study design illustrated in Figure 1 was conducted in a tertiary care hospital for a period of one year (June 2022 to May 2023) based on the well-known strengthening the reporting of observational studies in epidemiology (STROBE) guidelines. During this period, consecutive adult patients with chronic end-stage renal disease who were enrolled for hemodialysis at our center were included in the study as cases if they provided informed consent, were on maintenance hemodialysis for more than three months, and did not have the following exclusion criteria: Contraindication for 3T MRI, a previous history of stroke, traumatic brain injury, or any neurosurgical procedure, autosomal dominant polycystic kidney disease, chronic infection, or malignant disease. Controls were recruited from hospital visitors aged between 18 and 75 years with normal renal function and normal urine analysis. The exclusion criteria for controls were the same as those for cases.
3.2. Sample Size
In a previous study (7), the mean and standard deviation of FA values at the genu of the corpus callosum in healthy controls and end-stage chronic kidney patients were 0.67 ± 0.04 and 0.6 ± 0.06, respectively. To achieve 80% power with a 5% level of significance and a design ratio of 2.5:1 for sample to control, a minimum sample size of thirteen patients and five controls was required. We set a sample size of 75 patients and 25 controls, exceeding the minimum required sample size.
3.3. Methodology
The clinical history, physical examination, and biochemical studies were recorded in a predetermined format. All patients underwent an MRI Brain examination on a 3 Tesla MRI scanner (MAGNETOM Vida, Siemens Healthineers, Erlangen, Germany) immediately before the scheduled hemodialysis session.
3.4. Technique of MRI Examination
MRI Brain routine and DTI sequences were acquired in the same setting using the standard Siemens head coil with 32 channels. MRI brain routine sequences included T1 axial, T2 axial, fluid-attenuated inversion recovery (FLAIR) axial, susceptibility-weighted imaging (SWI), diffusion-weighted imaging (DWI), and apparent diffusion coefficient (ADC) sequences. Diffusion tensor imaging acquisition was performed using multidirectional diffusion-weighted sequences (MDDW) echo planar imaging with 20 tensor directions and two diffusion B values (0, 1 000) with 12 and 3 averages for each of the two B values, respectively.
3.5. Data Postprocessing and Image Analysis
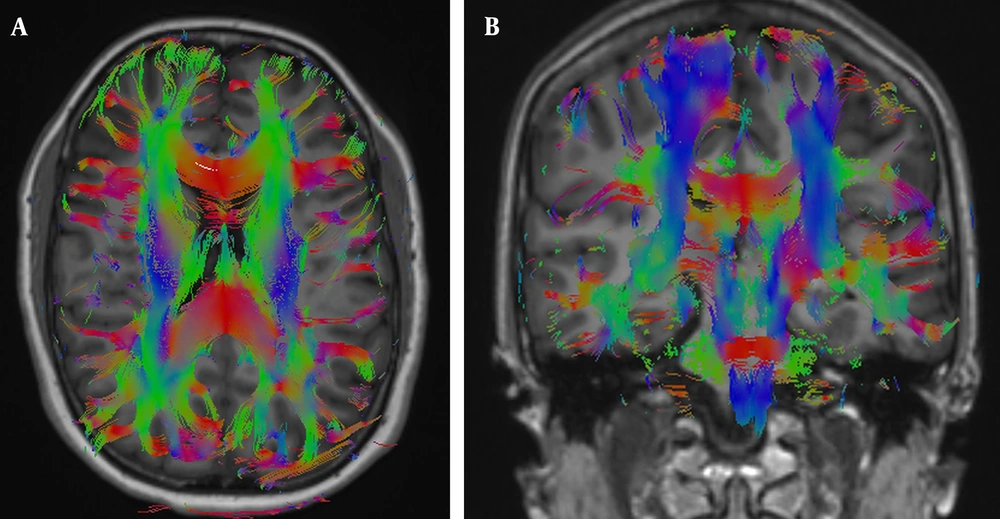
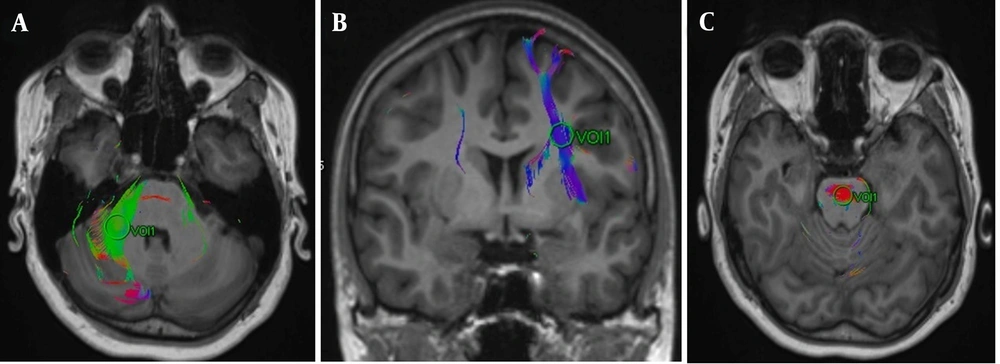
The DTI data were transferred to the workstation (Syngo MR XA31, Erlangen, Germany). First, the multidirectional diffusion series was visually analyzed for artifacts. Then, any distortions detected by the software were corrected using the align option provided by the Syngo MR XA31 software. Subsequently, color-coded FA maps were created and fused with structural T1-weighted images (Figure 2). Volumes of interest were placed on these fusion images, centering on the anterior corona radiata, posterior corona radiata, genu of the corpus callosum, splenium of the corpus callosum, pons, and middle cerebellar peduncle using color-coding of fusion images (9) (Figure 3). Bilateral measurements were taken for the anterior and posterior corona radiata and middle cerebellar peduncles. Therefore, nine white matter tracts were evaluated in total. We reviewed slice-by-slice the FLAIR sequence and FA, ADC, AD, RD, and b0 maps, ensuring that VOIs were not placed on areas of artifact, white matter hyperintensity, SWI blooming, or lacunar infarct. Additionally, border areas such as those adjoining ventricles, partial volume effects, and neighboring tracts were avoided as much as possible. Two blinded radiologists independently calculated the DTI parameters for each acquisition to minimize researcher bias. Fractional anisotropy, MD, RD, and AD parameters were recorded for white matter fibers at a total of nine locations by each radiologist after averaging two readings.
Figure showing volumes of interest (VOI) placed on A, the right cerebellar peduncle; B, the left anterior corona radiata; and C, transverse pontine fibers. In the VOI approach for diffusion tensor imaging (DTI) estimation, the DTI parameters of white matter tracts are computed using circular regions known as Volumes of Interest, which are designated by the MRI operator to pinpoint and localize these specific white matter tracts.
3.6. Statistical Analysis
Demographic and patient characteristics for the CKD-MHD group and NC group were reported as means with standard deviations for quantitative variables and as percentages for categorical variables. Comparisons of DTI parameters between the CKD-MHD and NC groups were made using unpaired Student's t-tests after each variable was appropriately scaled so that each variable had unit variability. A significance level of P < 0.05 was considered for comparison. However, Bonferroni correction was applied to account for multiple comparisons. Correlations between the DTI parameters for each location of the brain were calculated using the Pearson correlation coefficient.
Means, standard deviations, percentages, and intraclass correlation were calculated using Microsoft Excel for Microsoft 365 MSO (Version 2308 Build 16.0.16731.20052). All other statistical analyses were performed using R Statistical Software (version 4.12.0; R Foundation for Statistical Computing, Vienna, Austria).
4. Results
4.1. Demographic Results and Patient Characteristics
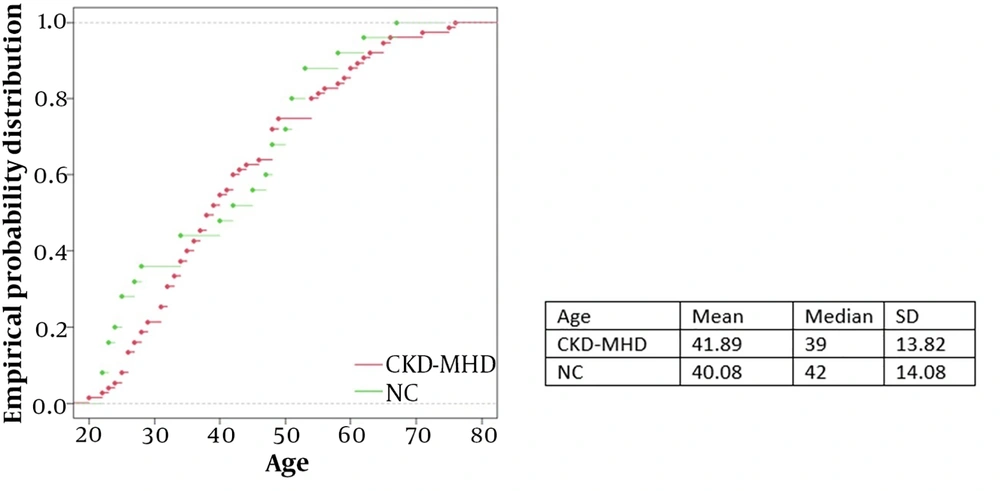
Our study included seventy-five patients in the CKD-MHD group and twenty-five controls in the NC group. The mean age was similar (42 years and 40 years for the CKD-MHD and NC groups, respectively), while the NC group had more women (27% and 60% for the CKD-MHD and NC groups, respectively). The age distribution is depicted in Figure 4.
The mean dialysis vintage (time since initiation of hemodialysis) in the CKD-MHD group was 27 months, ranging from 3 months to 103 months.
4.2. Conventional MRI Findings
Thirteen patients (17%) within the CKD-MH group and 15 normal controls (60%) within the NC group had normal MRI brain features using the routine sequences. The prevalence of various MRI abnormalities in the two groups is depicted in Table 1.
| Parameters | CKD -MHD | NC |
|---|---|---|
| White matter hyperintensities | 53 (70.6%) | 8 (32%) |
| Microhemorrhages | 11 (14.6) | 0 (0%) |
| Lacunar infarcts | 15 (20%) | 2 (8%) |
| Brain atrophy | 20 (26%) | 5 (20%) |
4.3. Comparison of DTI Parameters between CKD-MHD and NC
The four DTI parameters (FA, MD, RD, AD) were compared between CKD-MHD and NC groups at nine locations of the brain - right anterior corona radiata (RACR), corpus callosum genu (CCG), left anterior corona radiata (LACR), right posterior corona radiata (RPCR), corpus callosum splenium (CCS), left posterior corona radiata (LPCR), transverse pontine fibers (TP), right middle cerebellar peduncle (RMCP), left middle cerebellar peduncle (LMCP). Fractional anisotropy was significantly decreased at CCG, RACR, and LACR. MD was significantly increased at CCG, CCS, RACR, LACR, RPCR, LPCR, and LMCP. Radial diffusivity was significantly increased at CCG, CCS, RACR, LACR, RPCR, and LPCR. AD was significantly increased at CCS and LPCR. The results of these 36 comparisons with their statistical significance after Bonferroni correction are depicted in Tables 2, 3, and 4.
| DTI Parameter | Scaled Mean NC | Scaled Mean CKD-MHD | Difference in Scaled Mean | P-Value | Significance After Bonferroni Correction |
|---|---|---|---|---|---|
| CCG FA | 1.08022425 | 0.958506638 | Decreased | 3.57E-08 | Significant |
| CCG MD | 0.95787717 | 1.003936461 | Increased | 0.00025827 | Significant |
| CCG RD | 0.89343578 | 1.017975314 | Increased | 5.29E-07 | Significant |
| CCG AD | 0.9964807 | 0.992460603 | Decreased | 0.74233652 | Not significant |
| RACR FA | 1.05372518 | 0.964508917 | Decreased | 0.001007518 | Significant |
| RACR MD | 0.94866917 | 1.006305887 | Increased | 9.99E-05 | Significant |
| RACR RD | 0.91634818 | 1.01064799 | Increased | 0.000216952 | Significant |
| RACR AD | 0.96551552 | 1.002088074 | Increased | 0.011297148 | Not significant |
| LACR FA | 1.08059666 | 0.949367977 | Decreased | 4.50E-06 | Significant |
| LACR MD | 0.93965054 | 1.00855825 | Increased | 0.000136995 | Significant |
| LACR RD | 0.87860948 | 1.017876254 | Increased | 9.83E-06 | Significant |
| LACR AD | 0.96051414 | 1.003695146 | Increased | 0.003252213 | Not significant |
Abbreviations: CKD-MHD, chronic kidney disease-maintenance hemodialysis; DTI, diffusion tensor imaging; RACR, right anterior corona radiate; CCG, corpus callosum genu; LACR, left anterior corona radiate; FA, fractional anisotropy; MD, mean diffusivity; RD, radial diffusivity; AD, axial diffusivity.
| DTI Parameter | Scaled Mean NC | Scaled Mean CKD-MHD | Difference in Scaled Mean | P-Value | Significance After Bonferroni Correction |
|---|---|---|---|---|---|
| CCS FA | 0.00188728 | 0.134446406 | Increased | 0.32086503 | Not significant |
| CCS MD | 0.88767887 | 1.016730977 | Increased | 1.22E-08 | Significant |
| CCS RD | 0.87316532 | 1.010249293 | Increased | 8.79E-06 | Significant |
| CCS AD | 0.9119682 | 1.014057591 | Increased | 1.08E-06 | Significant |
| RPCR FA | 1.02686276 | 0.973774522 | Decreased | 0.034476347 | Not significant |
| RPCR MD | 0.92644725 | 1.012485469 | Increased | 1.37E-07 | Significant |
| RPCR RD | 0.91744416 | 1.011856755 | Increased | 0.000146352 | Significant |
| RPCR AD | 0.95068874 | 1.003001774 | Increased | 0.003857807 | Not significant |
| LPCR FA | 0.00068067 | 0.188272121 | Increased | 0.158703772 | Not significant |
| LPCR MD | 0.90871853 | 1.015353862 | Increased | 6.72E-07 | Significant |
| LPCR RD | 0.92239235 | 1.009645682 | Increased | 9.35E-05 | Significant |
| LPCR AD | 0.92000966 | 1.011490851 | Increased | 2.44E-06 | Significant |
Abbreviations: CKD-MHD, chronic kidney disease-maintenance hemodialysis; DTI, diffusion tensor imaging; RPCR, right posterior corona radiate; CCS, corpus callosum splenium; LPCR, left posterior corona radiate; FA, fractional anisotropy; MD, mean diffusivity; RD, radial diffusivity; AD, axial diffusivity.
| DTI Parameter | Scaled Mean NC | Scaled Mean CKD-MHD | Difference in Scaled Mean | P Value | Significance After Bonferroni Correction |
|---|---|---|---|---|---|
| TP FA | 1.03934422 | 0.97407626 | Decreased | 0.002346215 | Not significant |
| TP MD | 0.97495922 | 0.996296709 | Increased | 0.237357769 | Not significant |
| TP RD | 0.92252514 | 1.005991699 | Increased | 0.007627487 | Not significant |
| TP AD | 0.98404665 | 0.995017071 | Increased | 0.398248839 | Not significant |
| RMCP FA | 0.00069632 | 0.187297211 | Increased | 0.160943988 | Not significant |
| RMCP MD | 0.95877764 | 1.001076648 | Increased | 0.046995326 | Not significant |
| RMCP RD | 0.97534909 | 0.990321555 | Increased | 0.58764979 | Not significant |
| RMCP AD | 1.00009128 | 0.989641009 | Decreased | 0.563599048 | Not significant |
| LMCP FA | 1.0302902 | 0.97420812 | Decreased | 0.014112099 | Not significant |
| LMCP MD | 0.94939491 | 1.005145211 | Increased | 0.000576917 | Significant |
| LMCP RD | 0.94035147 | 1.005280504 | Increased | 0.007242027 | Not significant |
| LMCP AD | 0.97260608 | 0.999533158 | Increased | 0.115924825 | Not Significant |
Abbreviations: CKD-MHD, chronic kidney disease-maintenance hemodialysis; DTI, diffusion tensor imaging; TP, transverse pontine fibres; RMCP, right middle cerebellar peduncle; LMCP, left middle cerebellar peduncle; FA, fractional anisotropy; MD, mean diffusivity; RD, radial diffusivity; AD; axial diffusivity.
4.4. Comparison of DTI Parameters between CKD-MHD and NC When Conventional MRI is Normal
There was no statistically significant difference among the DTI parameters of CKD-MHD and NC groups for the subset of cases where conventional MRI was normal. The results of these 36 comparisons after the Bonferroni correction are depicted in Appendix 1.
4.5. Comparison of DTI Parameters Between CKD-MHD and NC When Conventional MRI is Abnormal
Significant statistical differences were observed between the DTI parameters of CKD-MHD and NC groups for the subset of cases where conventional MRI was abnormal. The results of these comparisons are shown in Appendix 2.
4.6. Correlation of DTI Parameters with Each Other in Specific Locations and Between Various Locations
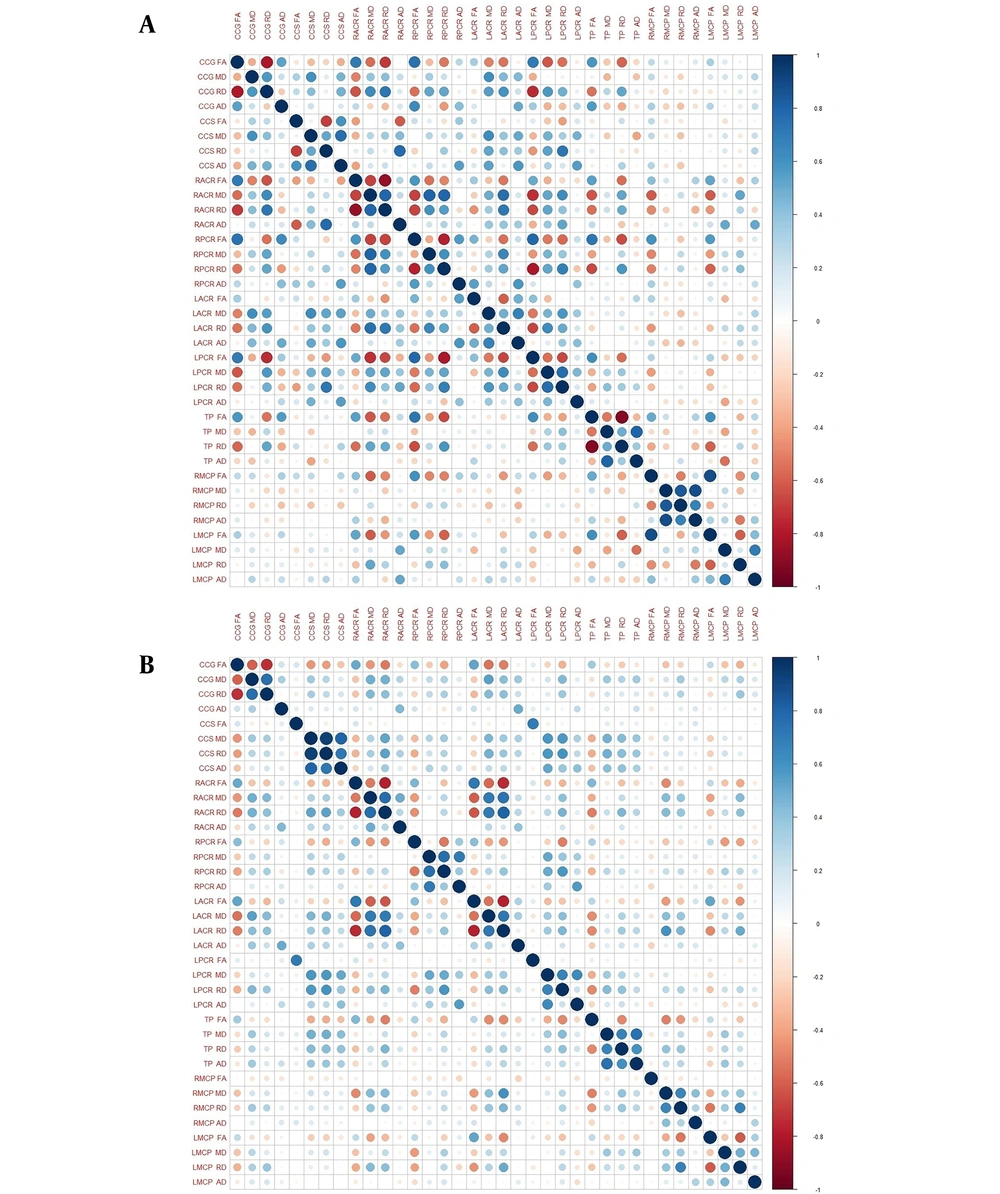
Pearson's correlation coefficient was calculated between the four DTI parameters (FA, MD, RD, AD) in the nine areas of the brain - RACR, CCG, LACR, RPCR, CCS, LPCR, TP, RMCP, LMCP. The results are depicted in heat maps separately for both CKD-MHD and NC groups in Figure 5. It is observed that correlations among different locations are stronger among controls (NC group) compared to hemodialysis patients (CKD-MHD group).
Fractional anisotropy and RD are highly and negatively correlated (R = -0.7904, P = 0.00001) in anterior locations where FA has significantly decreased in the CKD-MHD group (CCG, RACR, LACR). In posterior locations of the brain (CCS, LPCR) where AD has significantly increased, AD and MD are strongly positively correlated (R = 0.7734, P = 0.00001).
4.7. Intraclass Correlations Between DTI Parameters Obtained by Two Radiologists
The intraclass correlation coefficients (ICCs) were very high for FA (CKD-MHD: 0.85 and NC: 0.89), high for MD (CKD-MHD: 0.84 and NC: 0.87), RD (CKD-MHD: 0.78 and NC: 0.85), and AD (CKD-MHD: 0.80 and NC: 0.82) (Appendix 3).
5. Discussion
5.1. Significant Differences in DTI Parameters in CKD-MHD Population
In six out of the nine investigated white matter tracts, two or more DTI parameters exhibited significant differences after Bonferroni correction between the CKD-MHD and NC groups. However, when comparing the same DTI parameters between these groups in cases where routine brain MRI yielded normal results, none of the DTI parameters showed significant differences after Bonferroni correction. Previous studies have demonstrated that DTI parameters can detect the loss of white matter structural integrity in the brain (13-16). However, our study contributes by highlighting that in patients with chronic kidney disease undergoing hemodialysis, if a routine brain MRI scan is normal, then there are no significant differences in DTI parameters compared with normal.
5.2. Physiological and Pathological Correlation of the Diffusion Parameters
Correlation studies involving mouse models, examining the relationship between radiology and histology, have shown that radial diffusivity correlates with demyelination, indicating an increase in the loss of myelin (17, 18). Conversely, axial diffusivity is associated with axonal damage in animal models to varying degrees (19).
In our study, we found a strong negative correlation between FA and RD in the CKD-MHD group in anterior locations (RACR, LACR, CCG), where FA is significantly decreased. In these locations, AD has not significantly changed, and its correlation with other DTI parameters is poor. Given the established association of radial diffusivity with demyelination, our findings support the hypothesis that demyelination likely underlies the compromised white matter integrity observed in chronic kidney disease patients undergoing maintenance hemodialysis, particularly in the anterior regions of the brain.
In two posterior locations (CCS, LPCR) in our study, there was a significant increase in axial diffusivity in the CKD-MHD group compared to the NC group. In these locations, FA was neither significantly increased nor correlated with other DTI parameters. However, increased AD in these locations positively correlated with both MD and RD, which were significantly increased. Therefore, our study indicates a variance in the pathogenesis of white matter tracts between anterior and posterior locations. This is consistent with prior research that has identified differences in DTI parameters among white matter fibers situated in the anterior and posterior regions of the brain (7, 20).
5.3. Intraclass Correlations between DTI Parameters Obtained by Two Radiologists
Tract-based spatial statistics is the most advanced technique for calculating DTI parameters, preferred over the VOI method due to its high sensitivity, objectivity, and interpretability in the analysis of multi-patient diffusion studies. However, the VOI method offers two notable advantages over TBSS. Firstly, it can be used in the majority of MRI centers with readily available, commercially approved software, without requiring advanced programming or statistical expertise from the user. Secondly, unlike TBSS, the VOI method allows for the calculation of DTI parameters for individual patients rather than necessitating a group of patients.
Although the VOI method is observer-dependent, our study demonstrates high interobserver agreement for all DTI parameters (FA, MD, RD, AD). This finding aligns with previous observations of adequate inter-observer repeatability using the quantitative freehand method for calculating DTI parameters (9).
5.4. Limitations
Our study has a few limitations. Firstly, our study design precludes us from making interpretations about whether hemodialysis or other potential confounding risk factors linked to chronic kidney disease are responsible for these changes in DTI parameters. Secondly, our study lacks the ability to determine the prevalence of these DTI changes in individuals with mild and severe chronic kidney disease who are not undergoing dialysis. Thirdly, as a single-center study utilizing a single MRI vendor software, our research does not address the potential inter-vendor variability in the calculation of DTI parameters.
5.5. Conclusions
In our study on the Indian population of chronic kidney disease patients undergoing maintenance hemodialysis, we observed significant differences in certain DTI parameters across widespread white matter tracts of the brain using the VOI method, with an acceptable to excellent interobserver agreement. However, when compared to individuals with normal renal function, we were unable to detect any significant alterations in DTI brain parameters within a subgroup of hemodialysis patients whose routine brain MRI results were normal. The outcomes of our study suggest opportunities for future research to explore the onset of DTI changes in the natural progression of chronic kidney disease using the same VOI method. Longitudinal studies may be conducted involving various cohorts of CKD patients in different stages of the disease and in post-transplant CKD patients to understand if white matter changes begin early in CKD, progress with declining eGFR, and potentially reverse after renal transplantation. Our study also calls for future studies aiming to establish DTI as a diagnostic investigation using the VOI method. Multicenter studies involving different commercial MRI vendor software are essential for conducting receiver operating characteristic analysis to determine the normal range of DTI parameters and establish vendor-independent cutoff values for diagnosing CSVD. After classifying CKD patients based on DTI into those with or without CSVD, these patients may be followed to develop a model for stratifying the risk of stroke in CKD patients based on DTI values.

