1. Background
Kidney reduction or enlargement can be a symptom of various disorders, making knowledge of kidney dimensions important for diagnosing and treating kidney diseases (1). Conditions such as chronic hypertension (HTN), diabetes mellitus (DM), vasculopathies, congenital anomalies, urinary tract diseases, and certain renal disorders—including nephrolithiasis, hydronephrosis, chronic kidney disease (CKD), and renal tumors—can alter renal size (2). It has been shown that decreased renal parameters are associated with decreased kidney function in CKD (3, 4). Typically, renal size estimation includes parameters like renal length, width, and cortex size. However, some studies have shown that renal volume is a more reliable indicator for monitoring kidney pathologies, as it has a stronger correlation with both renal function and anthropometric indices (5-8).
The most common imaging techniques for measuring renal size are MRI, computed tomography (CT) scans, and ultrasonography. Renal length and volume measurements obtained by MRI in patients without known intrinsic renal disease tend to be greater than the reference values obtained via ultrasonography. Studies have reported that MRI-derived kidney dimensions are often higher than those measured by ultrasound (9). Due to higher potential for human error in ultrasound and the high cost and limited availability of MRI, CT scans offer a more reliable and precise technique than the other two methods (8, 10, 11). Research has also demonstrated significant differences in normal kidney size estimates across different populations and ethnic groups (12).
2. Objectives
To date, no studies in Iran have examined the relationship between renal dimensions measured by CT scans and anthropometric parameters in adults. Furthermore, CT scan-based studies in this area have largely focused on children. Given that anthropometric data may facilitate the early detection and assessment of renal disease severity, this study aimed to elucidate the relationship between renal dimensions and anthropometric parameters in northern Iran (Reviewer 1 - Comment 2).
3. Methods
This analytical cross-sectional study was conducted in Rasht, Guilan, Iran, between February 2018 and July 2018. All CT scans were performed at Sepehr Imaging Center. The study received approval from the Ethics Committee of Guilan University of Medical Sciences (IR.GUMS.REC.1397.324). Informed consent was obtained from all participants at the outset of the study.
A total of 634 patients, aged 18 years and older, underwent contrast-enhanced abdominal CT scans for reasons unrelated to renal pathology. Only patients presenting with common clinical complaints, such as abdominal pain, weight loss, constipation, or vomiting, and without kidney involvement, were included in the study.
Patients with underlying conditions affecting the kidneys—such as chronic HTN, DM, acute or chronic renal failure, kidney stones, renal masses, kidney surgery, kidney transplantation, congenital kidney disease, kidney cancer, urological cancers, prolonged benign prostatic hyperplasia (BPH), renal cysts, or hydronephrosis—were excluded. Pregnant women and patients with incomplete medical records were also excluded from the study.
Demographic data, including age, gender, weight, and height, were obtained from the medical profiles. Renal dimensions measured included renal length, width, depth, volume, and cortex length within six months of each patient’s renal CT scan. Renal length was defined as the maximum longitudinal dimension of the kidney on a coronal slice parallel to the kidney’s long axis. Renal width was the maximum width perpendicular to renal length on the same CT slice, while renal depth was the maximum depth perpendicular to renal length in a sagittal slice of the CT scan image. Renal volume was calculated using the formula:
The sample size of 634 patients was determined based on a study by Paul et al. (7), aiming to assess the correlation between anthropometric indices [weight, height, Body Mass Index (BMI)] and kidney dimensions (length, width, depth, volume, and cortex length) with a power of 90% and a 95% confidence level, assuming an anticipated correlation of 75%.
Statistical analysis was conducted using SPSS software (version 22). The frequency of variables was compared using the chi-Square test, while Pearson’s correlation coefficient was used to assess relationships between various parameters. The coefficient of determination (R²) was applied to identify any significant relationships between parameters and to derive equations. Scatter plots were generated to visually represent significant relationships between parameters. A significance level (P-value) of less than 0.05 was considered statistically significant.
4. Results
Data from 634 cases were analyzed, with 308 (48.6%) men and 326 (51.4%) women. The mean age of the patients was 53.5 ± 13.7 years (range: 18 - 86 years). Additionally, the mean weight, height, and BMI were 71.73 ± 24.37 kg, 167.51 ± 9.35 cm, and 25.6 ± 3.6 kg/m², respectively.
Table 1 shows that, on average, kidney dimensions are larger in men than in women. Furthermore, the left kidney has larger dimensions than the right kidney in both genders. However, these gender differences were statistically significant only in left renal width (P = 0.02) and in both right and left renal volume (P = 0.04 and P = 0.01, respectively).
| Variables | Male | Female | P-Value b |
|---|---|---|---|
| RR width | 47.75 ± 5.62 | 47.22 ± 5.40 | 0.23 |
| LR width | 50.03 ± 6.47 | 48.87 ± 6.34 | 0.02 |
| RR depth | 45.05 ± 5.09 | 45.06 ± 4.91 | 0.99 |
| LR depth | 46.95 ± 4.94 | 46.53 ± 4.82 | 0.27 |
| RR length | 105.06 ± 8.22 | 103.76 ± 8.95 | 0.06 |
| LR length | 106.61 ± 8.89 | 106.11 ± 9.04 | 0.48 |
| RR cortex | 6.26 ± 1.140 | 6.31 ± 1.15 | 0.55 |
| LR cortex | 6.20 ± 1.19 | 6.20 ± 1.20 | 0.99 |
| RR volume | 118.46 ± 22.70 | 115.13 ± 18.44 | 0.04 |
| LR volume | 131.14 ± 25.84 | 126.20 ± 23.17 | 0.01 |
Abbreviations: RR, right renal; LR, left renal; BMI, Body Mass Index.
a Values are reported as mean ± SD.
b Independent samples t-test.
Changes in kidney dimensions by age are detailed in Table 2. These changes were not statistically significant for any parameters of the right kidney. However, in the left kidney, depth, length, and volume showed statistically significant differences across age groups (P = 0.01, P = 0.001, and P = 0.01, respectively). Depth and volume of the kidney increased until the age of 60 and then decreased, while kidney width began to decrease after the age of 40.
| Variables | Under 30 | 31 - 40 | 41 - 50 | 51 - 60 | 61 - 70 | Over 70 | F | P-Value b |
|---|---|---|---|---|---|---|---|---|
| RR width | 46.67 ± 6.38 | 47.50 ± 5.62 | 46.60 ± 5.06 | 48.00 ± 5.58 | 48.33 ± 5.43 | 47.00 ± 5.71 | 1.92 | 0.08 |
| LR width | 48.50 ± 6.56 | 50.08 ± 6.72 | 48.76 ± 6.34 | 49.27 ± 6.68 | 50.53 ± 6.08 | 48.78 ± 6.14 | 1.59 | 0.16 |
| RR depth | 43.48 ± 5.14 | 44.75 ± 5.00 | 45.29 ± 4.81 | 45.53 ± 5.02 | 45.10 ± 5.13 | 44.56 ± 4.96 | 1.13 | 0.34 |
| LR depth | 45.01 ± 4.36 | 46.65 ± 4.88 | 46.94 ± 4.61 | 47.66 ± 5.19 | 46.68 ± 4.78 | 45.40 ± 4.81 | 3.04 | 0.01 |
| RR length | 104.62 ± 8.55 | 105.54 ± 8.61 | 104.66 ± 8.39 | 104.96 ± 8.65 | 103.59 ± 8.85 | 102.70 ± 8.56 | 1.31 | 0.25 |
| LR length | 108.16 ± 10.91 | 108.49 ± 7.47 | 107.74 ± 8.59 | 106.69 ± 8.91 | 104.18 ± 9.14 | 103.46 ± 9.10 | 5.39 | 0.001 |
| RR cortex | 6.34 ± 1.02 | 6.54 ± 1.26 | 6.34 ± 1.08 | 6.33 ± 1.11 | 6.14 ± 1.12 | 6.04 ± 1.19 | 2.19 | 0.053 |
| LR cortex | 6.39 ± 1.31 | 6.39 ± 1.21 | 6.17 ± 1.13 | 6.31 ± 1.33 | 6.11 ± 1.08 | 5.90 ± 1.11 | 2.02 | 0.07 |
| RR volume | 110.90 ± 20.13 | 117.24 ± 20.85 | 115.48 ± 19.19 | 119.90 ± 21.09 | 118.00 ± 21.29 | 112.56 ± 20.93 | 2.03 | 0.07 |
| LR volume | 123.43 ± 23.21 | 132.89 ± 26.19 | 129.10 ± 24.32 | 130.76 ± 23.55 | 128.71 ± 25.10 | 120.03 ± 23.28 | 2.97 | 0.01 |
Abbreviations: RR, right renal; LR, left renal; BMI, Body Mass Index.
a Values are reported as mean ± SD unless otherwise indicated.
b One-way ANOVA.
Table 3 demonstrates that, with an increase in BMI, all kidney dimensions increased except for length. However, only the difference between right renal depth and BMI was statistically significant (P = 0.01).
| Variables | Normal | Overweight | Obese | F | P-Value b |
|---|---|---|---|---|---|
| RR width | 47.23 ± 5.57 | 47.46 ± 5.31 | 48.62 ± 6.29 | 1.66 | 0.18 |
| LR width | 49.40 ± 6.45 | 49.22 ± 6.37 | 50.41 ± 6.80 | 0.93 | 0.39 |
| RR depth | 44.65 ± 4.71 | 45.08 ± 5.21 | 46.66 ± 4.76 | 4.30 | 0.01 |
| LR depth | 46.60 ± 4.67 | 46.73 ± 5.15 | 47.53 ± 4.44 | 0.95 | 0.38 |
| RR length | 105.29 ± 8.15 | 104.01 ± 8.98 | 103.21 ± 8.48 | 2.27 | 0.10 |
| LR length | 106.79 ± 9.31 | 106.44 ± 8.56 | 105.07 ± 9.83 | 0.96 | 0.38 |
| RR cortex | 6.17 ± 1.10 | 6.38 ± 1.18 | 6.40 ± 1.06 | 2.66 | 0.07 |
| LR cortex | 6.09 ± 1.14 | 6.26 ± 1.22 | 6.38 ± 1.25 | 2.20 | 0.11 |
| RR volume | 116.10 ± 20.01 | 116.37 ± 21.14 | 122.11 ± 20.72 | 2.42 | 0.09 |
| LR volume | 128.63 ± 23.92 | 128.14 ± 24.91 | 131.94 ± 26.75 | 0.65 | 0.52 |
Abbreviations: RR, right renal; LR, left renal.
a Values are reported as mean ± SD unless otherwise indicated.
b One-way ANOVA.
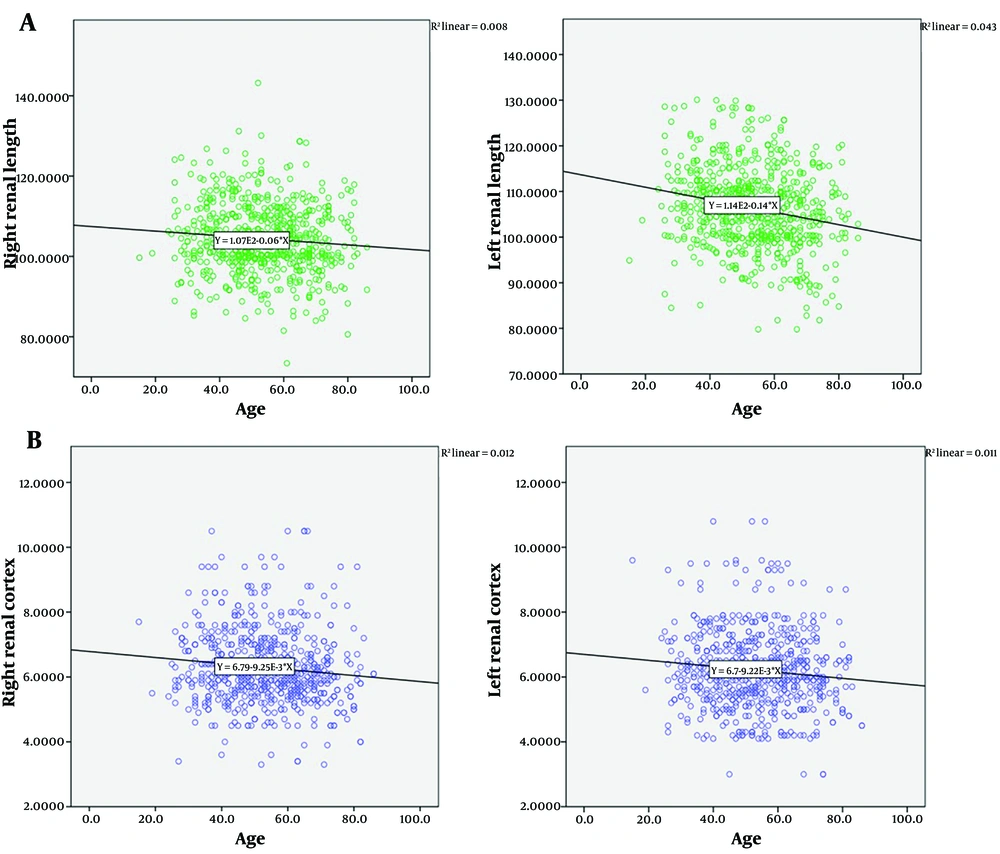
Results from the Spearman’s rho correlation test showed a significant negative correlation between age and both sides of renal length, cortex, and left renal volume, indicating that these parameters decrease with increasing age. Age had a statistically insignificant positive correlation with other parameters (P > 0.05) (Table 4 and Figure 1).
| Renal Dimensions | Age (y) | Weight (kg) | Height (cm) | BMI (kg/m2) |
|---|---|---|---|---|
| RR width | ||||
| r | 0.051 | 0.049 | 0.010 | 0.048 |
| P | 0.199 | 0.219 | 0.795 | 0.227 |
| LR width | ||||
| r | 0.035 | 0.053 | 0.050 | 0.022 |
| P | 0.375 | 0.180 | 0.207 | 0.588 |
| RR depth | ||||
| r | 0.022 | 0.108 | 0.004 | 0.114 |
| P | 0.589 | 0.007 | 0.927 | 0.004 |
| LR depth | ||||
| r | -0.021 | 0.124 | 0.061 | 0.078 |
| P | 0.591 | 0.002 | 0.125 | 0.049 |
| RR length | ||||
| r | -0.091 | 0.094 | 0.160 | -0.031 |
| P | 0.022 | 0.018 | 0.000 | 0.438 |
| LR length | ||||
| r | -0.208 | 0.097 | 0.120 | 0.008 |
| P | 0.000 | 0.014 | 0.002 | 0.847 |
| RR cortex | ||||
| r | -0.110 | 0.062 | -0.021 | 0.080 |
| P | 0.005 | 0.117 | 0.596 | 0.044 |
| LR cortex | ||||
| r | -0.105 | 0.110 | 0.037 | 0.088 |
| P | 0.008 | 0.005 | 0.348 | 0.026 |
| RR volume | ||||
| r | 0.005 | 0.149 | 0.093 | 0.087 |
| P | 0.898 | 0.000 | 0.019 | 0.029 |
| LR volume | ||||
| r | -0.079 | 0.154 | 0.125 | 0.064 |
| P | 0.046 | 0.000 | 0.002 | 0.105 |
Abbreviations: RR, right renal; LR, left renal; BMI, Body Mass Index.
a Spearman's rho correlation.
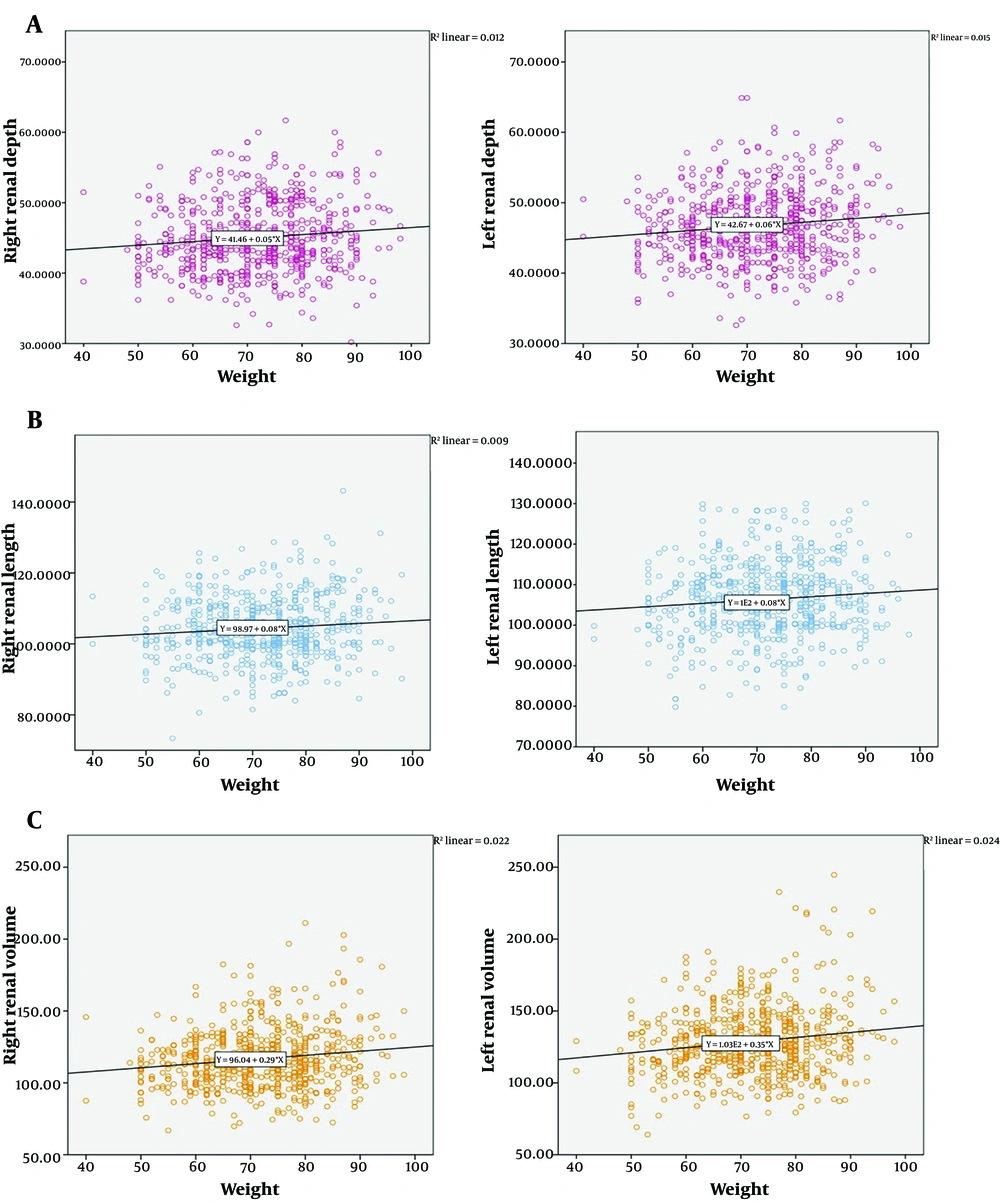
There was a significant positive correlation between weight and both sides of renal depth, length, volume, and left renal cortex, indicating that these parameters increase with weight. Weight showed a statistically insignificant positive correlation with other parameters (P > 0.05) (Table 4 and Figure 2).
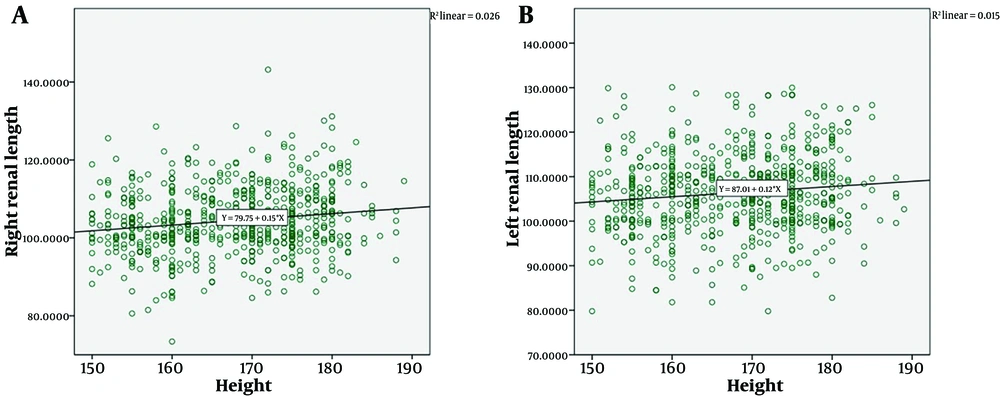
Height showed a significant positive correlation with both sides of renal length and volume, indicating that these parameters increase with height. Height had a statistically insignificant positive correlation with other parameters (P > 0.05) (Table 4 and Figure 3).
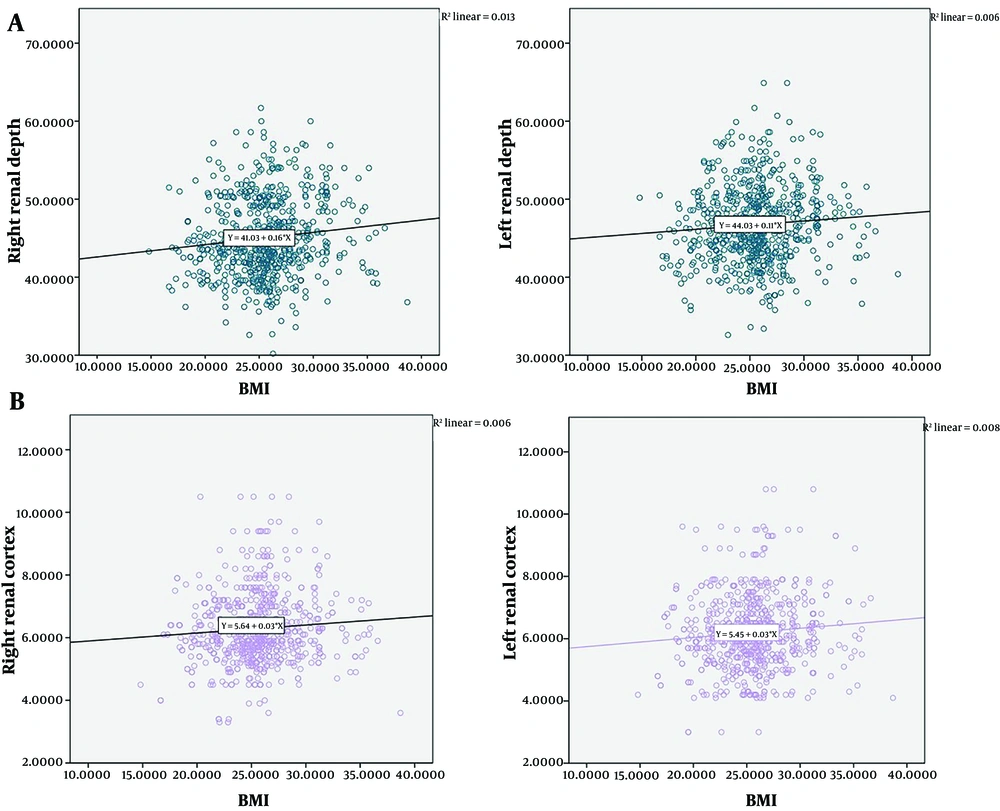
Finally, correlation coefficients between BMI and both sides of renal depth, cortex, and right renal volume were significantly positive, indicating that these parameters increase with BMI. Body Mass Index had a statistically insignificant positive correlation with other parameters (P > 0.05) (Table 4 and Figure 4).
Figures 1 to 4 illustrate that the scatter plots for age, weight, height, and BMI against kidney dimensions closely align with the diagonal, indicating that the predicted values of the equations closely match the actual values. This strong alignment suggests that the equations have a very good fit, while the fit for RAD was relatively poor.
5. Discussion
Renal size estimation typically includes renal length, volume, and cortical thickness. Several studies have shown that renal volume is the most sensitive parameter for diagnosing renal diseases. Renal volume is considered a valuable predictor of renal function and has a strong correlation with anthropometric measurements (13).
The results of this study indicate that as age increased, renal dimensions initially expanded, then declined after the sixth decade of life, though these changes were not statistically significant for the right kidney. Moreover, only the correlations between age and both renal length and cortex, as well as left kidney volume, were statistically significant.
Most previous studies (5, 12, 14) have found a relationship between age and renal size, with kidney size decreasing with age, likely due to factors such as parenchymal loss or reduced blood flow, estimated to decrease by about 1% per year after the third decade of life (15). Similar to our findings, Raza et al. (16) reported a significant correlation between age and renal length for both kidneys and left kidney volume. However, conflicting reports exist. For instance, El-Reshaid and Abdul-Fattah (17) found no significant relationship between renal length, cortical thickness, and age, while a study by Karim et al. (15) showed a positive correlation between age and kidney size.
Our study also found differences in renal dimensions between men and women, with all kidney dimensions being larger in males than in females. However, only the differences in left renal width and volume by gender were statistically significant, consistent with findings from other studies (1, 8, 12, 18).
In agreement with other studies (1, 8, 19), the left kidney was larger than the right kidney. This difference may be attributed to the presence of the liver in the upper right quadrant of the body, which limits the space available for the growth of the right kidney.
We observed a positive correlation between right kidney volume and body weight. Similarly, Pezeshki Rad et al. (19) found a strong association between weight and kidney size using ultrasound in Mashhad, another city in western Iran. In 2014, Okur et al. (13) reported that kidney width and body weight were the most significant factors correlated with kidney volume in the Turkish population.
Our findings showed a positive correlation between kidney length and volume and individuals’ height. While some studies report a positive correlation between height and kidney measurements (13, 14), Alyami et al. (1) and El-Reshaid and Abdul-Fattah (17) did not find any statistically significant correlation between height and kidney length. Furthermore, Pezeshki Rad et al. (19) found that the correlation between height and kidney size was resolved after adjusting for confounding factors. A 2023 study in Taiwan on type 1 diabetic patients revealed that renal lengths were longer with increasing body height and weight but shorter with increasing age (14).
Our results showed that while the width, depth, cortex, and volume of the kidney increase with BMI, kidney length has an inverse correlation with BMI. This suggests that BMI may be an important factor for estimating kidney depth and cortex, as these correlations were statistically significant. Su et al. also reported a strong correlation between renal size and BMI (12). Additionally, El-Reshaid and Abdul-Fattah found renal length to be correlated with patients’ BMI (17).
While most studies confirm a relationship between kidney size and anthropometric factors, Alyami et al. (1) found no significant correlation between renal dimensions and demographic factors such as age, height, weight, and gender. Similarly, Jovanovic et al. reported that a correlation between anthropometric parameters and kidney size exists only in healthy individuals, with no significant correlation observed in patients with CKD (3).
There are some limitations to our study. First, factors related to kidney function were not investigated. Second, only certain anthropometric factors (age, weight, height, BMI) were identified in this study, and other relevant factors, such as total body area and waist circumference, were not measured. Despite these limitations, the use of CT scan measurements likely makes our findings more reliable compared to previous studies using ultrasonography.
To the best of our knowledge, this is the first CT assessment of renal dimensions and their correlation with anthropometric parameters in Iranian adults.
The findings of this study indicate a significant correlation between kidney dimensions and various anthropometric factors such as age, weight, height, and BMI. Therefore, renal dimensions measured using CT can be predicted by anthropometric measurements in adults without known renal disease, which may be useful in the diagnosis and treatment of kidney diseases. Future multicenter studies with larger sample sizes are needed to investigate the generalizability of these results.
