


1. Background
Chronic kidney disease (CKD) leads to the gradual loss of kidney function and eventually progresses to end-stage renal disease (ESRD) (1). For patients with ESRD, chronic hemodialysis (HD) is a life-saving procedure (2). One of the most significant complications of CKD is mineral and bone disorders (MBD-CKD). The pathophysiology of MBD-CKD affects the serum levels of several biomarkers, including phosphorus, calcium, and parathyroid hormone (PTH) (3, 4). Hypocalcemia, hyperphosphatemia, increased secretion of PTH from the parathyroid glands, and low serum levels of vitamin D are major variations in CKD-MBD (5). These abnormalities cause profound changes in bone and mineral metabolism, renal osteodystrophy, and extraskeletal calcification (5).
Recent studies have implicated mineral metabolism, such as calcium, phosphorus, and PTH, as a risk factor for vascular calcification, cardiovascular disease, and mortality in patients with kidney failure undergoing dialysis (6-8). Parathyroid hormone plays an important role in the pathogenesis of CKD (9). The relationship between PTH and mortality as a biomarker of CKD has been investigated for decades. Most epidemiological studies report that high levels of serum intact PTH (iPTH) are related to increased mortality in dialysis patients (10-12).
Over time, in patients undergoing HD, the regulated sodium concentration of dialysis gradually increased from 126.5 mEq/L in the 1940s to about 140 mEq/L in the 1990s. However, due to the lack of definitive evidence on safety and efficacy, there is currently no consensus on the optimal concentration of sodium for dialysis. Although evidence is conflicting, many studies have shown that higher sodium levels in the dialysis fluid are associated with an increased risk of heart failure and death (13, 14). The inconsistency regarding sodium levels in dialysis fluids for patients undergoing HD is due to its varying effects on patient health. Studies indicate that sodium levels should be maintained between 135 to 140 mmol/L to preserve electrolyte balance and prevent complications such as hyponatremia or hypernatremia. Elevated sodium levels can lead to increased blood pressure and cardiovascular risks, while precise regulation should be tailored to the individual needs of patients. Additionally, appropriate sodium levels can enhance the quality of life for patients (15). Therefore, further research is needed to determine the best management practices for this condition.
The reason for choosing sodium concentrations of 135 and 140 mmol/L is that the main sodium concentration in the dialysis solution is 140 mmol/L, and the lowest acceptable and desirable limit for sodium is 135 mmol/L. For this reason, the lowest limit of sodium reduction was considered within the normal range so that the maximum effect of sodium reduction, if effective, could be observed.
2. Objectives
Considering the limited global studies and the lack of studies in Iran, we decided to conduct a study aimed at comparing the effect of low and normal levels of sodium in the dialysis fluid on the levels of calcium, phosphorus, and PTH in patients undergoing chronic HD.
3. Methods
3.1. Study Design and Participants
The current study is a double-blind, randomized controlled clinical trial. Eighty-four patients who were referred to the dialysis centers of Golestan and Imam Khomeini Hospitals in Ahvaz, Iran, in 2023 were enrolled. Inclusion criteria included adults aged 18 to 70 years undergoing chronic HD and having been on HD for more than three months. Patients with active infection, cardiovascular diseases, ascites, uncontrolled underlying disease, frequent muscle cramps that could not be attributed to causes other than low sodium, and patients with sodium levels less than 130 mmol/L were excluded. Patients with cardiovascular diseases are at risk of hyponatremia due to their condition, and this risk was excluded from the study due to the possibility of increasing the incidence or severity of hyponatremia with reduced dialysis sodium. Additionally, to ensure the stability of the patients' conditions, a minimum dialysis history of three months was established.
The consolidated standards of reporting trials (CONSORT) flow diagram is shown in Figure 1, documenting the flow of participants through the different stages of the study. Eligible patients were divided into two equal groups. One group was treated with HD using a liquid sodium concentration of 140 mmol/L, and the second group was treated with a liquid sodium concentration of 135 mmol/L. The number of HD sessions for the patients was three times a week, each lasting 3 to 4 hours. During the study, one type of strainer was used in all sessions. At the beginning of the study (before the start of HD), one month after the start of dialysis, and three months after the start of dialysis, the patients' serum calcium, phosphorus, and PTH levels were checked. The effects of low and normal sodium levels in the dialysis fluid on calcium, phosphorus, and PTH levels were then compared.
 flow diagram")
Consolidated standards of reporting trials (CONSORT) flow diagram
All patients were followed up by the same nephrologist at predetermined times: Prior to treatment initiation, and subsequently one and three months after treatment initiation. Calcium, phosphorus, and PTH levels were measured at all three times in a laboratory, accurately and using available standard kits. The spectrophotometric method was used to measure serum calcium and phosphorus levels. An enzyme-linked immunosorbent assay (ELISA) kit was used to measure PTH. Notably, all members of the research team and patients were blinded to the treatment groups. A simple randomization method was utilized in this research. Each participant had the same chance to join any group. A random number generator or random number table was employed. Numbers were selected from the random number chart. Group one (liquid sodium 140 mmol/L) was labeled 1 - 42, while group two (liquid sodium 135 mmol/L) was assigned numbers 43 - 84. We began at a certain spot in the random number chart, placing participants in the first group if the number fell within 1 - 42 and in the second group if it fell within 43 - 84. Any numbers outside of these ranges were disregarded as we continued assigning all participants.
3.2. Ethical Considerations
The study was approved by the Medical Ethical Committee of Ahvaz Jundishapur University of Medical Sciences (ethics code: IR.AJUMS.REC.1402.470), and this trial was registered in the Iranian clinical trial system with the registration number IRCT20230704058662N1.
3.3. Statistical Analysis
Statistical analysis was performed using SPSS software, version 22 (IBM, Chicago, USA). Quantitative variables were expressed as mean ± SD, and qualitative variables were presented as number (percentage). The Kolmogorov-Smirnov and Shapiro-Wilk tests were used to assess the distribution of data. Changes in variables over time were analyzed using repeated measures analysis with Greenhouse-Geisser correction. A P-value of less than 0.05 was considered statistically significant.
4. Results
The mean age of the 84 patients was 53.99 ± 14.61 years. Of all patients, 64% were female (54 patients). The mean duration of dialysis was 7.95 ± 3.45 years (Table 1).
| Variables | Result |
|---|---|
| Age (y) | 53.99 ± 14.61 |
| Gender | |
| Female | 54 (64) |
| Male | 30 (36) |
| Dialysis duration (y) | 7.95 ± 3.45 |
a Values are expressed as mean ± SD or No. (%).
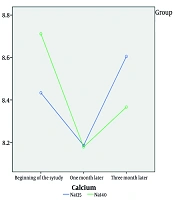
According to the results shown in Table 2, at the study's onset, patients who received a therapeutic dose of sodium at 135 mmol/L had lower calcium levels compared to those given a dose of 140 mmol/L. Calcium levels were not significantly different between the 135 mmol/L and 140 mmol/L sodium doses after 3 months of intervention (8.60 ± 0.92 vs. 8.36 ± 0.96, P = 0.94). Patients who received the 135 mmol/L sodium dose had higher calcium levels after one and three months than those who received the 140 mmol/L dose. Although both groups showed a decrease from the starting point, this decline was not deemed statistically significant. However, noticeable variances were observed at various time intervals (P < 0.001).
| Variables and Groups | Before Intervention | 1 Month After Intervention | 3 Months After Intervention | P-Value b | P-Value c |
|---|---|---|---|---|---|
| Calcium | 0.94 | < 0.001 | |||
| Sodium with dose 135 mmol/L | 8.43 ± 0.82 | 8.18 ± 1.01 | 8.60 ± 0.92 | ||
| Sodium with dose 140 mmol/L | 8.71 ± 0.73 | 8.17 ± 0.91 | 8.36 ± 0.96 | ||
| Phosphorus | 0.98 | 0.06 | |||
| Sodium with dose 135 mmol/L | 5.01 ± 1.63 | 5.28 ± 1.81 | 5.77 ± 1.49 | ||
| Sodium with dose 140 mmol/L | 5.44 ± 1.56 | 5.26 ± 1.43 | 5.37 ± 1.28 | ||
| PTH | 0.02 | 0.28 | |||
| Sodium with dose 135 mmol/L | 485.83 ± 349.65 | 483.24 ± 333.76 | 559.09 ± 372.85 | ||
| Sodium with dose 140 mmol/L | 483.24 ± 38.86 | 624.40 ± 403.72 | 759.23 ± 1497.65 |
Abbreviation: PTH, parathyroid hormone.
a Values are expressed as mean ± SD.
b P-value related to repeated measure analysis shows group comparison.
c P-value related to repeated measure analysis shows time comparison.
Regarding phosphorus levels, at the beginning of the study, patients who received the 135 mmol/L sodium dose had higher phosphorus levels than those with the 140 mmol/L sodium dose. Although an increasing trend was observed after one and three months, it was not statistically significant over time (P = 0.06). Parathyroid hormone levels differed between groups (P = 0.02), but there was no substantial disparity in efficacy between the two sodium dosages at varying time intervals (P = 0.28). In other words, although the difference in PTH levels was statistically significant between the two groups, there was no clinical difference, which may be due to the short follow-up period.
Figure 2 illustrates the changes in calcium levels in the sodium 135 mmol/L and 140 mmol/L dose groups over one- and three-month periods. Additionally, Figure 3 depicts the changes in phosphorus levels in the two sodium groups over one- and three-month periods.

Calcium changes in the sodium 135 and 140 treatment groups over a period of one and three months

Phosphorus changes in the sodium 135 and 140 treatment groups over a period of one and three months
5. Discussion
The aim of this study was to investigate the effect of low and normal sodium levels in dialysis fluid on calcium, phosphorus, and PTH levels in chronic HD patients. Calcium levels were not significantly different between the sodium 135 mmol/L dose and the 140 mmol/L dose after 3 months of intervention (8.60 ± 0.92 vs. 8.36 ± 0.96, P = 0.94). Parathyroid hormone levels differed between the two groups (P = 0.02). Phosphorus levels in the sodium groups with doses of 135 mmol/L and 140 mmol/L were 5.77 ± 1.49 and 5.37 ± 1.28, respectively, with no significant difference after 3 months of intervention (P = 0.98). To our knowledge, there is no report on the effect of different sodium levels on calcium, phosphorus, and PTH levels in HD patients. As the results showed, different doses of sodium did not change the levels of phosphorus and calcium, but the higher dose of sodium increased the level of PTH.
The distinction between statistical significance and clinical significance is of great importance in medical studies, especially in the context of HD patients. Although the changes in PTH levels between the two groups of patients may have been statistically significant, the difference was not large enough to have a significant impact on the clinical status of the patients. Reasons for this phenomenon may include small effect sizes, individual variability in response to changes, short follow-up, confounding factors, and compensatory mechanisms of the body. Additionally, a longer follow-up period could help identify clinical complications associated with PTH changes and better demonstrate temporal patterns in these changes, ultimately contributing to a better understanding of clinical effects.
An increase in the serum level of PTH is one of the first disorders in CKD-MBD in patients with CKD. Parathyroid hormone plays an important role in the urinary excretion of phosphates and the release of calcium and phosphate from bone (16-18). Hypercalcemia is observed in most HD patients, often caused by the use of phosphate-binding drugs that contain calcium. Moreover, hyperphosphatemia is caused by the effects of PTH on osteoclasts in bone. In response to these hormonal effects, serum calcium levels also increase (19, 20).
Several epidemiologic studies have reported that high serum PTH levels are associated with increased mortality in dialysis patients (10, 21). However, the impact of PTH levels on infection-related outcomes and mortality in dialysis patients is debated (11, 22, 23). Considering the effect of PTH on calcium and phosphorus levels, it is necessary to adjust the sodium dose in such a way that it does not increase PTH levels. According to our findings, a lower sodium dose (135 mmol/L) is more appropriate, although more studies are necessary.
Sodium accumulation is the dominant factor in the pathogenesis of hypertension and left ventricular hypertrophy in HD patients. Excess elimination of sodium during HD is fundamentally important in improving the adverse cardiovascular risk profile of HD patients (24-26). From this perspective, it seems necessary to choose the optimal dose of sodium in HD patients.
The differences in PTH levels in dialysis patients receiving different sodium doses (135 and 140 mmol/L) can be attributed to several mechanisms. Increased sodium levels may lead to increased calcium excretion through urine and a subsequent decrease in serum calcium levels, which in turn stimulates PTH production. Additionally, varying sodium doses can influence the secretion of other hormones, such as insulin and aldosterone, while changes in body fluid volume may also impact kidney function and PTH production. The effect of changes in sodium levels on aldosterone can lead to metabolic disorders, including decreased calcium absorption and increased risk of osteoporosis. Moreover, the sensitivity of the parathyroid glands to serum calcium levels might be affected by different sodium doses, where higher doses could lead to reduced sensitivity and increased PTH production. Metabolic changes resulting from dialysis itself can also influence PTH secretion (27).
Overall, these complex relationships between sodium, calcium, and PTH require further research to fully understand the physiological mechanisms and long-term effects. Limitations of the present study include the small sample size, single-center design, short follow-up period, and lack of data on other relevant biomarkers such as vitamin D levels.
5.1. Conclusions
Reducing the sodium concentration of dialysis had no effect on calcium and phosphorus levels. Moreover, PTH levels differed between the two sodium dose groups, but there was no substantial disparity in efficacy between the two sodium dosages at varying time intervals. Since PTH plays a major role in determining the rate of bone regeneration and blood circulation in HD patients with ESRD, it is necessary to regulate its level. Therefore, due to the effect of sodium level on PTH, estimating the appropriate concentration of sodium is very important. Given the effect of vitamin D on calcium and phosphorus levels, patients' vitamin D levels can also be measured. Future multicenter studies with larger sample sizes are suggested to confirm these results and examine the long-term effects of different sodium concentrations on cardiovascular outcomes or mortality in HD patients.
