1. Context
Chronic renal failure (CRF) is a set of pathologic processes, characterized by loss of renal function including reduction in glomerular filtration rate (GFR) and the formation of uremic syndrome (1). End stage renal disease (ESRD) is the final stage of renal failure, with a GFR of < 15 mL/minute (2). Globally, approximately 600 million people have CRF, with an annual mortality rate of 60,000 people (3). The development and prevalence of ESRD in Iran is higher than that of the global rate, with an estimated prevalence rate of 1,200 to 1,600 per annum (4, 5).
Although hemodialysis, as a substitute for the kidney, increases the survival and life expectancy in patients, it causes several problems such as psychological stress and social isolation of the patients (6); therefore, increasing the longevity and quality-of-life should always be considered in the treatment of such patients (7). Although patients with ESRD have been successfully treated with hemodialysis over the past four decades, the dialysis community is looking for a valid and simple criterion to evaluate the adequacy and effectiveness of treatment (8). Kalender and Tosun believes that the adequacy of dialysis can reduce mortality, increase longevity, and improve the quality-of-life in patients undergoing hemodialysis (9). On the other hand, poor and inadequate dialysis means higher disability and mortality rate (10, 11). Effectiveness and adequacy of dialysis depend on many factors including type of filter, dialysis pump rate, dialysis time and speed, the application of high-flux dialyzer, blood flow rate, patient education, diet, and underlying diseases (4, 10).
In general, urea reduction ratio (URR) and urea kinetic modeling (Kt/V) are used to evaluate the adequacy of dialysis (12). The urea kinetic modeling represents a fractional volume cleared of urea per dialysis. The urea reduction ratio measures the difference in urea levels before and after the dialysis (13). Achievement of a URR of about 65% (equivalent to a single pool Kt/V of 1.2) indicates an effective dialysis (14). Data from different studies show that for every 0.1 increase in Kt/V, the mortality rate decreases by about 7%, and for every 5% increase in URR, the mortality rate decreases by 11% (3). However, evidence from Iranian studies reported wide variation ranging from Kt/V index values of 0.58 to 1.6 (15, 16) and URR index values of 47.84% to 69.83% (17, 18).
Due to the importance of adequacy of dialysis in patients undergoing hemodialysis, evaluating the effectiveness and adequacy of dialysis in the current study would help policymakers and healthcare professionals to review and revise, if necessary, their current practice toward more effective dialysis. Various studies were conducted in different regions of Iran to evaluate the adequacy of dialysis in patients undergoing hemodialysis, but there is still no general estimate of the adequacy of dialysis in such patients in Iran. Moreover, the overall adequacy of dialysis in Iran is not clear in recent years.
2. Objectives
The current study aimed at evaluating the adequacy of dialysis in patients undergoing hemodialysis in Iran through a systematic review and meta-analysis.
3. Evidence Acquisition
3.1. Data Resources and Search Strategy
The current systematic review and meta-analysis included observational studies that were published in domestic and international journals which reported the mean and standard deviation (SD) of dialysis adequacy indices (Kt/V and URR) based on the PRISMA (preferred reporting items for systematic reviews and meta-analyses) guidelines. Two researchers independently searched several domestic and international databases, including MagIran, ISI/Web of Science, PubMed, and Scopus, using the keywords “Adequacy of Dialysis” and “Hemodialysis Adequacy”. In addition, references of the selected articles were also reviewed to gain access to other articles.
3.2. Quality Assessment, Study Selection, and Data Extraction
First, all observational articles with reference to “adequacy of dialysis” in their title were collected. Duplicates, interventional studies, the ones lacking essential data, methodologically low-quality articles, and the articles that lacked full-text were excluded. Data extraction was performed using a checklist containing author's first name, language of the article, year of publication, the context, the methodological quality score, the sample size, the mean age of the sample size, history of dialysis and mean body mss index (BMI), and Kt/V and URR indices. To reduce bias, each article was independently reviewed by two researchers and in case of controversies, they were reviewed again by a third researcher. The methodological quality of the articles was evaluated based on the strengthening the reporting of observational studies in epidemiology (STROBE) checklist used in various studies to evaluate the methodological quality of observational studies (19).
3.3. Statistical Analysis
Considering the fact that the quality-of-life score had a normal distribution, the variance of each study was calculated by the variance of normal distribution:

The weight assigned to each study was proportional to the inverse variance. The mean score of dialysis adequacy indices was estimated and presented with 95% confidence interval (CI). I2 index and Cochran Q test were used to analyze the heterogeneity of the data. If the I2 index was higher than 50%, or the probability distribution of the Cochran Q test was lower than 0.05 (P < 0.05), the random effects model was used and otherwise, the fixed effects model was used to estimate the adequacy of dialysis scores. Sensitivity analysis was performed to ensure the stability of the results. Meta-regression model was used to assess the relationship between the adequacy of dialysis and mean age, year of publication, methodological quality, and sample size of studies. The probability of publication bias in the results was investigated by Begg funnel plot. Data analysis was performed with STATA version 14, considering the significance level of 0.05.
4. Results
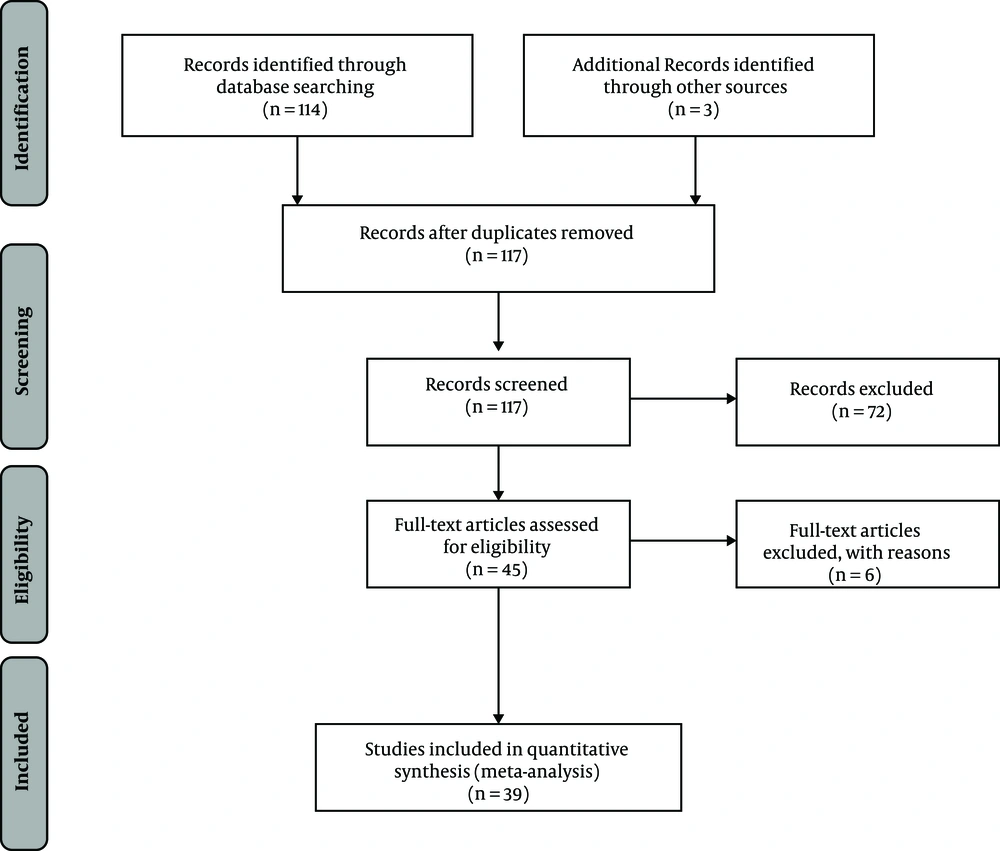
Overall, 117 articles were identified in the initial search, 78 of which were excluded based on our exclusion and inclusion criteria. Finally, 39 articles in Persian and English languages met the includion criteria and were selected for the study. The oldest and newest studies were conducted in 2001 and 2017, respectively (Figure 1), of which 37 were considered eligible to evaluate Kt/V index and 22 eligible to evaluate URR index.
The total sample size included 9408 patients with a mean of 242 patient per study; the characteristics of the selected articles are presented in Table 1. The smallest and largest sample sizes were associated with the studies of Kaviannezhad et al. (11) and Moslem et al. (20), respectively.
| First Author | Year | Place | Sample Size, N | Kt/V | URR |
|---|---|---|---|---|---|
| Nemati (21) | 2017 | Nationwide | 1271 | 0.92 ± 0.31 | - |
| Abedi-Samakoosh (15) | 2017 | Qaemshahr | 60 | 1.60 ± 0.20 | 60.81 ± 10.73 |
| Kaviannezhad (11) | 2016 | Hamadan | 40 | 1.10 ± 0.32 | 61.00 ± 0.14 |
| Zafar Mohtashami (22) | 2016 | Khorramabad | 79 | 1.20 ± 0.45 | - |
| Ghorbane Moghaddam (13) | 2016 | Bushehr | 93 | 1.35 ± 0.53 | 66.15 ± 12.48 |
| Hemayati (23) | 2015 | Tehran | 46 | 1.30 ± 0.32 | - |
| Farhadi (24) | 2015 | Tehran | 44 | 1.08 ± 0.30 | 58.36 ± 9.43 |
| Dadgari (25) | 2015 | Shahroud | 43 | 1.10 ± 0.60 | - |
| Habibzadeh (26) | 2015 | Kermanshah | 151 | 1.26 ± 0.34 | 58.46 ± 20.13 |
| Saeedi (4) | 2015 | Arak | 159 | 0.84 ± 0.39 | 58.29 ± 11.99 |
| Ebrahimi (27) | 2015 | Shahroud | 99 | 1.12 ± 0.89 | - |
| Nasri (28) | 2013 | Shahrekord | 60 | - | 57.40 ± 9.00 |
| Khorgami (29) | 2013 | Tehran | 98 | 1.19 ± 0.40 | - |
| Abedi Samakoosh (30) | 2013 | Qaemshahr | 60 | 1.15 ± 0.31 | 60.81 ± 10.73 |
| Edalat-Nejad (31) | 2013 | Arak | 81 | 1.10 ± 0.40 | - |
| Shariati (32) | 2012 | Golestan province | 389 | 1.33 ± 35.00 | 63.62 ± 16.00 |
| Tayyebi (33) | 2012 | Tehran | 100 | 1.23 ± 0.38 | 63.14 ± 11.40 |
| Oshvandi (34) | 2012 | Hamadan | 40 | 1.27 ± 0.28 | 65.00 ± 0.09 |
| Sanavi (35) | 2012 | Tehran | 120 | 1.09 ± 0.26 | - |
| Amini (36) | 2011 | Nationwide | 4004 | 1.20 ± 0.40 | 61.00 ± 11.80 |
| Mohseni (17) | 2011 | Sari | 50 | 0.92 ± 0.26 | 47.84 |
| Shasti (10) | 2011 | Tehran | 100 | 1.23 ± 0.38 | 63.14 ± 11.04 |
| Roozitalab (37) | 2010 | Yasuj | 41 | 0.94 ± 0.40 | 50.00 ± 0.69 |
| Shariati (38) | 2010 | Gorgan | 113 | 1.51 ± 35.00 | - |
| Malekmakan (39) | 2010 | Nationwide | 632 | 0.97 ± 0.42 | - |
| Raeisifar (40) | 2009 | Abadan | 43 | 0.90 ± 0.21 | 53.00 ± 10.00 |
| Hojjat (41) | 2009 | Jahrom | 68 | 0.96 ± 0.75 | 51.60 ± 87.90 |
| Zeraati (42) | 2008 | Mashhad | 48 | 1.05 ± 0.36 | - |
| Monfared (18) | 2008 | Rasht | 139 | 1.43 ± 0.33 | 69.83 ± 9.86 |
| Moslem (20) | 2008 | Gonabad | 30 | 1.39 ± 0.37 | - |
| Pourfarziani (43) | 2008 | Nationwide | 338 | 1.17 ± 0.31 | 62.60 ± 12.80 |
| Zand (16) | 2007 | Arak | 103 | 0.58 ± 0.14 | - |
| Mousavi Movahed (44) | 2007 | Qom | 238 | 1.03 ± 0.23 | 57.46 ± 8.42 |
| Afshar (45) | 2006 | Tehran | 54 | 1.11 ± 0.19 | 55.33 ± 7.05 |
| Borzou (46) | 2006 | Hamadan | 42 | - | 60.17 ± 10.74 |
| Taziki (47) | 2006 | Tehran | 100 | 0.97 ± 0.54 | - |
| Mozaffari (48) | 2005 | Ardabil | 70 | 0.68 ± 0.39 | - |
| Nadi (49) | 2003 | Hamadan | 100 | 1.32 ± 0.51 | 52.66 ± 17.20 |
| Delavari (50) | 2001 | Kurdistan province | 62 | 0.94 ± 0.37 | - |
Characteristics of the Selected Articlesa
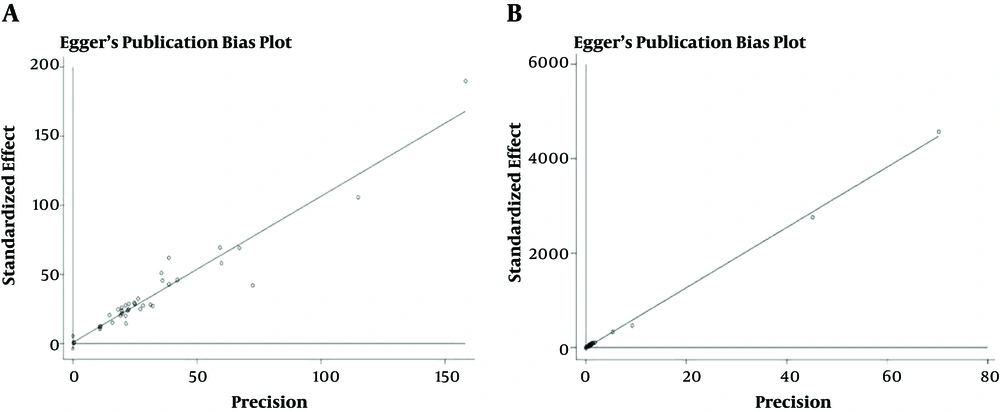
Sensitivity analysis showed that the results of no single article affected the total mean score of Kt/V and URR. A biased graph was used to evaluate whether or not all articles associated with adequacy of dialysis were included in the study, which demonstrated that publication bias was not significant for Kt/V (P = 0.713) and URR (P = 0.265) indices.
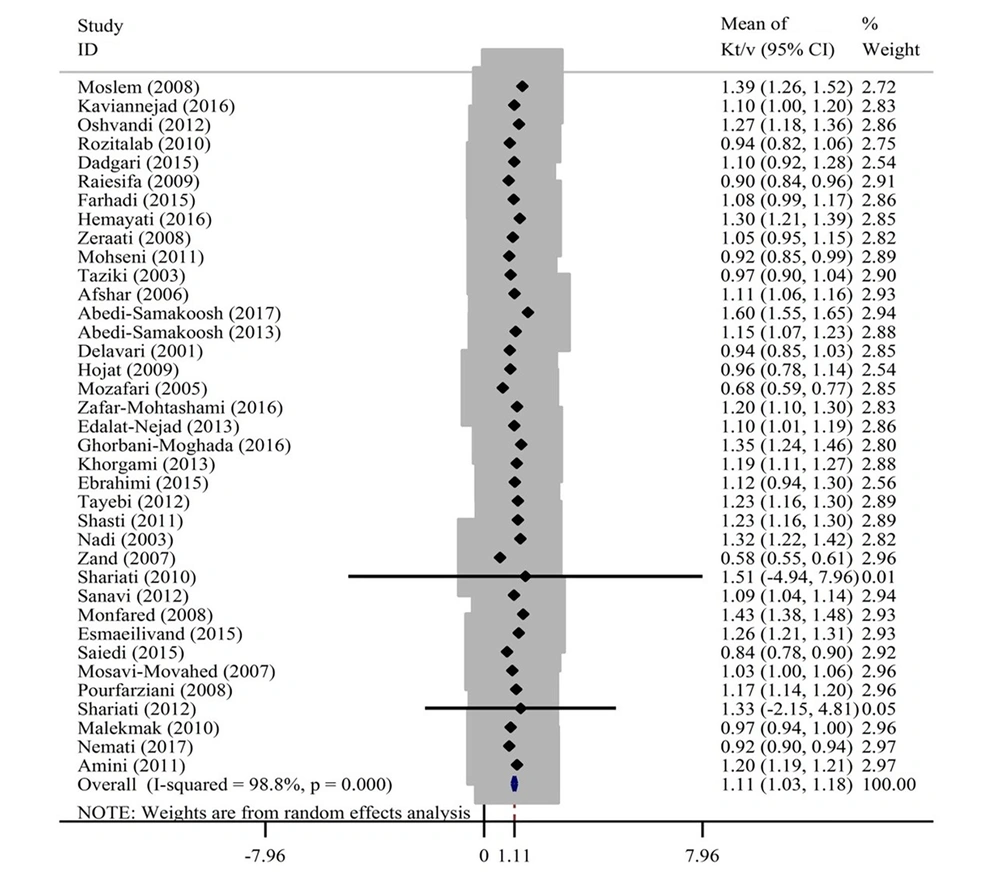
Of the 37 included studies that analyzed mean Kt/V index, the results showed that the mean Kt/V index in Iranian patients undergoing hemodialysis was 1.11 (95% CI: 1.03 - 1.18).
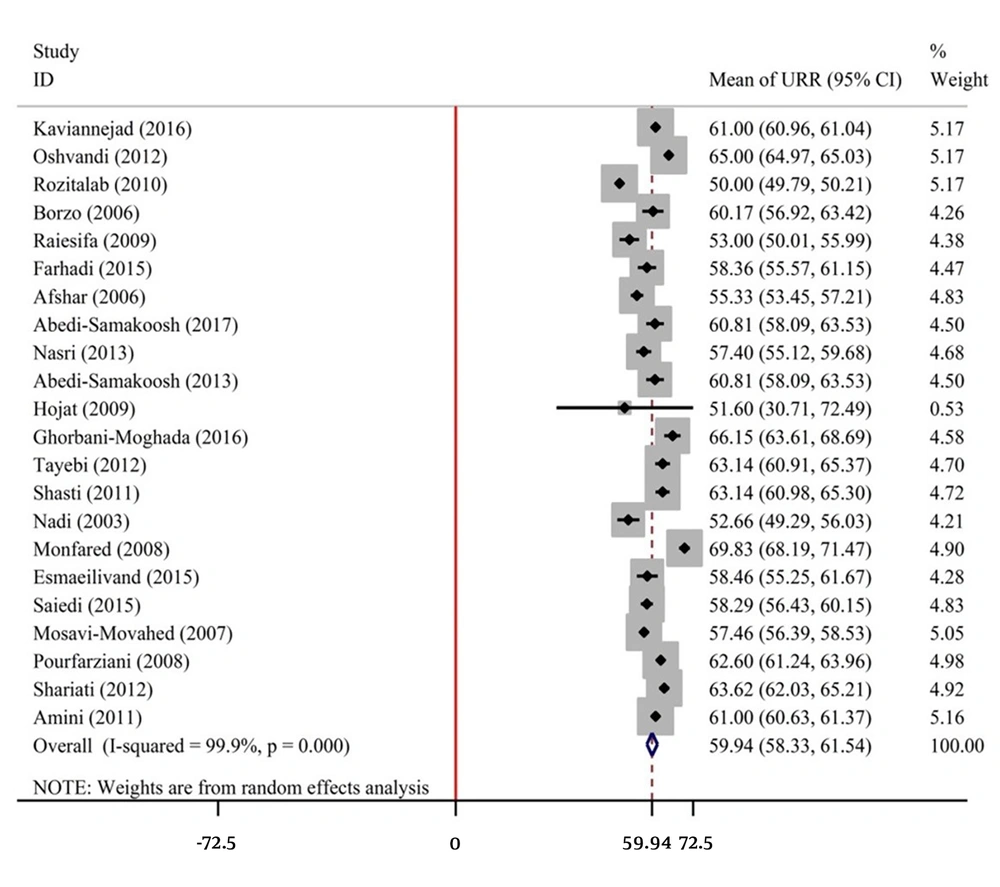
On the other hand, of the 22 included studies that analyzed URR, the results showed that the URR in Iranian patients undergoing hemodialysis was 59.94% (95% CI: 58.33 - 61.54).
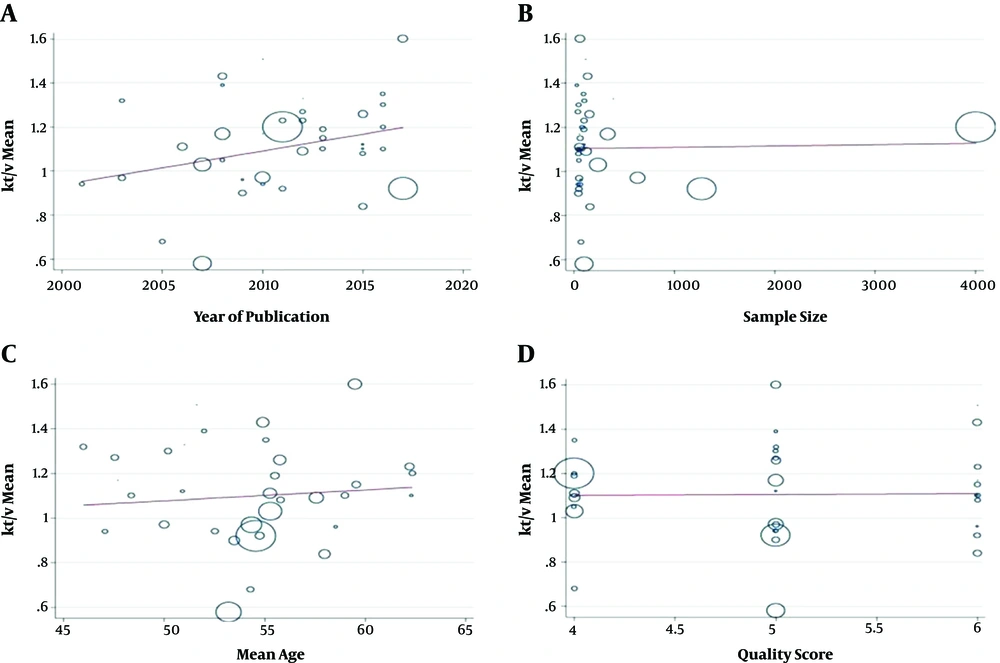
The results of meta-regression showed no correlation between Kt/V and sample size (P = 0.914), mean age of samples (P = 0.587), and methodological quality score of articles (P = 0.07). However, the mean Kt/V index increased with an increase in the year of publication (P = 0.063), but the change was not significant.
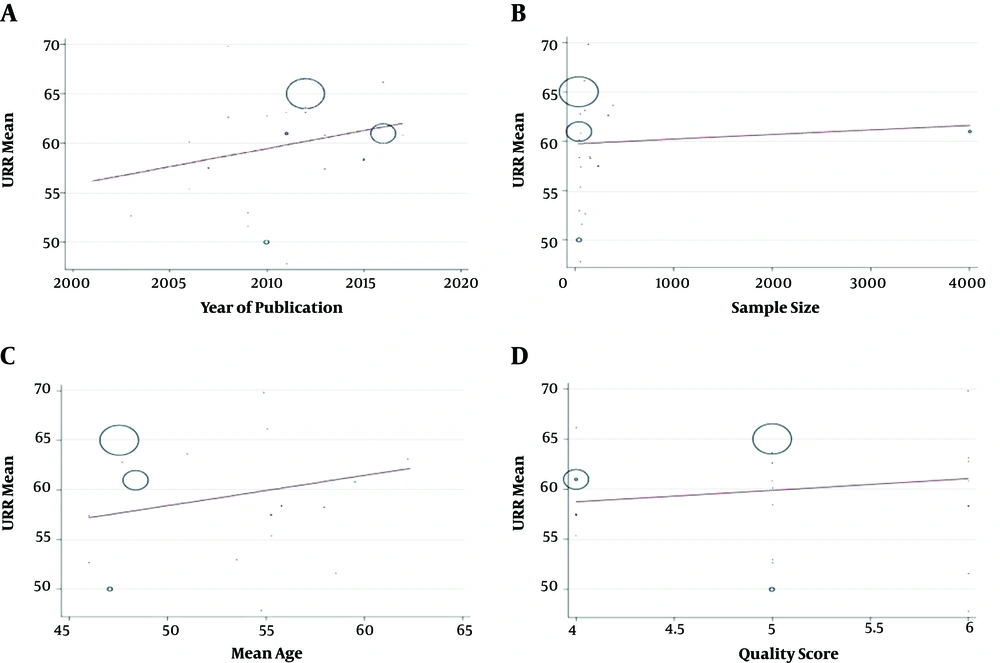
Furthermore, the meta-regression results showed no correlation between URR index and the year of study publication (P = 0.198), sample size (P = 0.712), mean age of samples (P = 0.192) and methodological quality score of articles (P = 0.406).
The findings on Kt/V and URR indices showed that the lowest level of Kt/V (0.96%; 95% CI: 0.71 - 1.21) and URR (57.42%, 95% CI: 50.41 - 64.43) belonged to the region 2 of the country. Moreover, the Kt/V in articles published in English was higher than that of the Persian articles (1.16 versus 1.08), and Kt/V in high quality articles was higher than that of the average quality articles (1.11 versus 1.10). The URR was also higher in high quality articles than average quality articles (61.99 versus 59) (Table 2).
| Number of Studies | Average Dialysis Adequacy | Confidence Interval (95%) | Heterogeneity | |||
|---|---|---|---|---|---|---|
| Indicators | Lower | Upper | % | P Value | ||
| Area | ||||||
| 1 | ||||||
| Kt/V | 18 | 1.14 | 1.05 | 1.23 | 98 | 0.001 |
| URR | 9 | 60.58 | 58.45 | 62.72 | 91.7 | 0.001 |
| 2 | ||||||
| Kt/V | 6 | 0.96 | 0.71 | 1.21 | 98.5 | 0.001 |
| URR | 5 | 57.42 | 50.41 | 64.43 | 98.5 | 0.001 |
| 3 | ||||||
| Kt/V | 3 | 1.02 | 0.54 | 1.49 | 99.1 | 0.001 |
| URR | 1 | 69.83 | 68.19 | 71.47 | - | - |
| 4 | ||||||
| Kt/V | 6 | 1.17 | 1.03 | 1.32 | 94.8 | 0.001 |
| URR | 6 | 58.84 | 56.35 | 61.32 | 100 | 0.001 |
| 5 | ||||||
| Kt/V | 2 | 1.22 | 0.88 | 1.55 | 93.7 | 0.001 |
| URR | - | - | - | - | - | - |
| Nationwide | ||||||
| Kt/V | 2 | 1.09 | 0.86 | 1.31 | 99.4 | 0.001 |
| URR | 1 | 61 | 60.63 | 61.37 | - | - |
| Language | ||||||
| Persian | ||||||
| Kt/V | 26 | 1.08 | 0.97 | 1.19 | 98.4 | 0.001 |
| URR | 17 | 60.08 | 58.24 | 61.93 | 100 | 0.001 |
| English | ||||||
| Kt/V | 11 | 1.16 | 1.05 | 1.27 | 99.1 | 0.001 |
| URR | 5 | 59.51 | 57.28 | 61.74 | 91.8 | 0.001 |
| Quality | ||||||
| High | ||||||
| Kt/V | 11 | 1.11 | 0.97 | 1.24 | 96.1 | 0.001 |
| URR | 7 | 61.99 | 58.04 | 65.94 | 94.3 | 0.001 |
| Moderate | ||||||
| Kt/V | 26 | 1.10 | 1.02 | 1.19 | 99.1 | 0.001 |
| URR | 15 | 59.05 | 57.15 | 60.95 | 100 | 0.001 |
Mean Score of Indices of Dialysis Adequacy Based on Subgroupsa
5. Discussion
The current study aimed at evaluating the adequacy of dialysis (measured using Kt/V and URR as a proxy measure) in patients undergoing hemodialysis, in which 39 eligible articles with a sample size of 9408 were reviewed. The results showed that mean Kt/V index in the Iranian patients undergoing hemodialysis was 1.11, which was lower than the accepted ≥ 1.2 value as the optimal dialysis adequacy in Iran (21). Accordingly, this indicated sub-optimal and poor adequacy of dialysis in patients undergoing hemodialysis. The minimum acceptable Kt/V is 1.5 in Egypt, 1.8 in Thailand , and 1.9 in Spain , all of which were higher than that of Iran (8, 51, 52). The reason for this difference can be attributed to low-level equipment of dialysis units and the application of inappropriate filters, lack of adequate vascular access, lack of time for dialysis, and poor skills of the personnel. The Kt/V index is so important that an increase of 0.1 in this index is associated with reduced risk of mortality from cardiovascular, cerebrovascular, and infectious diseases (7). Dialysis inadequacy is associated with an increase in hospitalization, longer hospital stay, and higher medical costs (53).
The pooled URR index was 59.94% in the current study, which was again lower than the ≥ 65% value defined by the Iran Ministry of Health as the minimum value for adequate dialysis (54); thus, it can be said that the dialysis adequacy index for patients undergoing hemodialysis (based on URR) is also suboptimal. Owen et al. (55), showed that URR lower than 60% was associated with increased mortality rate. The results of different studies show that for every 0.1 increase in Kt/V, the mortality rate decreases by about 7%, and for every 5% increase in URR, the mortality rate decreases by 11% (3).
Meta-regression results showed no correlation between Kt/V and URR indices and sample size, mean age of samples, methodological quality, and year of publication of articles. The adequacy of dialysis is influenced by various factors. The lack of correlation between the adequacy of dialysis and the year of publication of the articles shows that the policies and strategies of health care system during this period (2001 to 2017) were not sufficient to promote the healthcare level in patients undergoing hemodialysis and failed to measure the adequacy of dialysis in such patients. In a study by Shaw et al. (56), on evaluating the adequacy of dialysis based on URR in England, the results showed that URR increased from 56% in 1998 to 86% in 2010, indicating proper planning and favorable health care services for patients undergoing hemodialysis during these years. Accordingly, it is becessary to review health policies and programs in Iran to improve the adequacy of dialysis in patients undergoing hemodialysis. Since achieving adequacy is influenced by patient, dialyzer, and dialysis machine factors, all the three items could be the target for any improvement programs. Patients undergoing hemodialysis should have an active role in health care. They should carefully control the amount of foods, fluids, and drugs they take, be sensitive to physical, mental, psychological, and emotional changes, and try to have regular visits with renal care professionals. They should also be encouraged to be a member of renal care group and not just passive care recipients (56).
Overall, the results of the current study showed that the adequacy of dialysis was suboptimal in the community of Iranian patients undergoing hemodialysis and measures shoule be taken to improve the adequacy of dialysis and the condition of such patients.
