


1. Background
Chronic kidney disease (CKD) is a common health problem with a rising prevalence all over the world (1, 2). Unfortunately, in spite of increasing expenditures (3), the patients have high mortality and morbidity (4), as well as a low quality of life (5). Despite the recent technological development, the survival of ESRD patients treated with hemodialysis remains low, with an expected survival less than that for patients with a solid tumor (6). An important factor to control this problem is improving the nutritional status of these patients (7). Malnutrition has been identified as a major independent risk factor for survival of patients undergoing hemodialysis (8). Many patients are old, malnourished, and have multiple comorbidities. The standard anthropometric assessment provides a valuable view of the nutritional status of the patients. Several methods are employed for muscle mass assessment including anthropometrics, creatinine kinetics, bioelectric impedance analysis, and dual-energy X-ray absorptiometry. Among these methods, dual-energy X-ray absorptiometry (DEXA) is the most reliable technique for the estimation of bone mass, fat mass, and lean body mass. However, in comparison with DEXA, bioelectrical impedance analysis (BIA) is more convenient, less expensive, and operational at the patient’s bedside in hemodialysis centers (9). The question is the accuracy of the measurements by BIA in comparison with the more acceptable methods. This study assessed the association of the measurements of multi-frequency BIA for the estimation of body composition with the results of DEXA in outpatient hemodialysis patients. The core assessment was extended to the segmental analysis of upper and lower extremities.
2. Methods
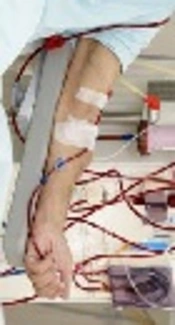
The study population included outpatients undergoing hemodialysis for four hours thrice a week. They were at least 18 years old with a history of hemodialysis at least for 3 months. Patients with any of the following complications were excluded from the study: Breastfeeding or pregnancy, intra-cardiac defibrillator device, pacemaker, orthopedic joint device, history of myocardial infarction or cerebrovascular accident, lymphedema, deep vein thrombosis, and psychiatric disorders/diseases. BIA (InBody S10) was performed after the second hemodialysis session while the patients were in the supine position with two electrodes placed on each extremity. In the next step, by using six different frequencies (1, 5, 50, 250, 500, and 1000 kHz), 30 segmental resistances were measured in each individual. The following parameters were assessed by BIA: Intracellular water (ICW), extracellular water (ECW), total body water (TBW), proteins, minerals, free fat mass (FFM), skeletal lean mass, skeletal muscle mass (SMM), body cell mass (BCM), and bone mineral content (BMC). Finally, the patients were referred to the department of nuclear medicine for the assessment of body composition by the DEXA method. Table 1 presents a summary of the specifications of the BIA and DEXA methods. Written informed consent was obtained from all the study subjects. The study conforms to the local and international ethical concerns and it was approved by the Ethics Committee of the University. The difference between the values of BIA and DEXA methods was tested by paired t-test, the correlation was studied by the assessment of Pearson’s coefficient of correlation, and the adjustment for the interfering co-variables was assessed by the use of general linear models (i.e. ANCOVA). Bland-Altman’s plots were depicted for the assessment of agreement between the results of BIA and DEXA. P value equal to 0.05 was considered for significant changes and correlations in SPSS V. 18 software (Chicago, IL).
| Assessment Method | Specification |
|---|---|
| Bioelectric impedance analysis instrument | InBody S10 (Tepral, Perafita, Portugal); two electrodes for each extremity (overall 8 electrodes); six different frequencies (1, 5, 50, 250, 500, and 1000 kHz); overall 30 impedance measurements. |
| Bone densitometer | STRATOS (DMS group, Mauguio, France); dual energy X-ray radiation, a scan length of less than 60 min; an overall absorbed dose of less than three microSiv per examination; measurement of bone mineral density, lean body, and fat mass in the whole body and segmental analyses. |
3. Results
A total of 43 patients (26 males; 60.5%) aged 59.9 ± 12.5 years (males: 57.6 ± 12.3 years; females: 63.5 ± 12.4 years) were recruited to the study. Table 2 represents the main bone, fat mass, and muscle mass indices derived from DEXA and BIA. The bone, fat, and muscle indices are significantly different between the two methods. The differences between the bone, fat, and lean body mass indices of the two methods were 1.9 ± 0.5, -6.5 ± 4.3, and 4.1 ± 3.6, respectively (all differences significant; P = 0.0001). The bone, fat, and muscle mass measurements by DEXA and BIA were correlated significantly with reasonably high coefficients of correlation (Figure 1). The lean body mass of four limbs by the two methods was significantly correlated (Table 3). The correlation of the bone mineral density derived from DEXA examination and the bone mass by BIA remained significant after adjustment for the effect of age, sex, and weight (r = 0.67; P = 0.001). The correlations of the fat mass (r = 0.93; P = 0.001) and the lean body mass (r = 0.94; P = 0.001) by DEXA and BIA methods were also significant independent of the effect of age, sex, and weight. The two methods had considerable agreements as shown in Figure 2. The equation for conversion of the values of BIA (X) into the values of DEXA (Y) is as follows:

where a and b are respectively 0.30 and 0.44 for bone content, 0.75 and 7.0, for lean body mass, and 0.96 and 7.3 for fat mass (all in kg).
| Males | Females | Total | |
|---|---|---|---|
| Age, y | 57.6 (12.3) | 63.5 (12.4) | 59.9 (12.5) |
| Weight, kg | 73.2 (16) | 66.1 (15.8) | 70.4 (16.1) |
| Bone - based on DEXA, kg | 1.6 (0.3) | 1.3 (0.2) | 1.5 (0.3)b |
| Fat - based on DEXA, kg | 27.4 (11.1) | 30.3 (13.1) | 28.5 (11.9) |
| Lean weight - based on DEXA, kg | 44.2 (6.9) | 34.6 (4.9) | 40.4 (7.8)b |
| Bone - based on BIA, kg | 3.7 (0.6) | 2.9 (0.4) | 3.4 (0.7)b, c |
| Fat - based on BIA, kg | 19.3 (10.2) | 26.1 (12.4) | 22 (11.5)c |
| Lean weight - based on BIA, kg | 49.4 (8.4) | 37.1 (6.4) | 44.5 (9.7)b, c |
aValues are expressed as means (SD).
bSignificant differences (P < 0.05) between the values of males and females.
cSignificant differences (P < 0.05) between the values of DEXA and BIA.
Abbreviations: BIA, bioelectrical impedance analysis; DEXA, dual energy X-ray absorptiometry.
aData are differences and coefficients of correlation (Pearson r) and P values are in parentheses.

Correlation between the body composition indices of by DEXA and BIA. A, B, and C depict the data for bone, fat, and lean body mass.

Bland-Altman's plot for the assessment of agreement between the measurements by BEXA and BIA methods. Bone mineral content, fat mass, and lean body mass by BIA reasonably correspond to the measurements by DEXA.
4. Discussion
This study reports a strong correlation between the body composition indices of DEXA and BIA in the whole body and segmental analyses. The differences between the results obtained by the two methods were considerable but the values were easily interchangeable after conversion. The reliable assessment of body composition in routine practice can help improve the quality of life and reduce the morbidity and mortality of patients with ESRD (10). The results of the measurement by DEXA are acceptable (11) although DEXA is often unavailable in hemodialysis wards and expose patients to X-ray albeit very low doses (12). BIA can be used to perform regular assessments of nutritional condition at the bedside since the instrument is portable. The cost of the instrument and consequently, the charge of the procedure are considerably lower for BIA than for DEXA (13). A close linear correlation between the results of DEXA and BIA with the possibility of conversion, when needed, reassures the routine use of BIA.
The results concerning the correlation between the whole body and segmental values of lean body mass by the two methods are consistent with the findings of other studies. Furstenberg and Davenport measured the values for right lower and left upper limbs demonstrating a high correlation between the values of the two methods (14). Ling et al. found a perfect correlation between the whole body measurements of DEXA and BIA (r = 0.95) (15) while Anderson et al. replicated the results with certain gender differences (i.e. r = 0.91 in men and r = 0.88 in women) (16). Notably, the extent of the correlation and correspondingly, the validity of the values in the upper limbs mainly on the left side are weak, probably due to arteriovenous fistula (17). Buckinx et al. found a weak correlation between these two variables. However, one of the limitations of this study was that the hydration status of the persons had not been determined before BIA running and this factor could influence the results. Table 4 presents a summary of the results and specifications of previous studies.
| Study Year | Sample Size | Fat Mass | Lean Body Mass | Bone Mass | Specification | |
|---|---|---|---|---|---|---|
| Furstenberg and Davenport (14) | 2011 | 53 H | 0.93 | 0.95 | 0.77 | Weaker correlation in the upper limbs |
| Ling et al. (15) | 2011 | 484 | 0.94 | * | ||
| Molfina et al. (18) | 2012 | 36 (11 H) | 0.87 | * | ||
| Anderson et al. (16) | 2012 | 50 (25 H) | M = 0.87, F = 0.95 | Attention to the gender differences | ||
| Kamimura et al. (19) | 2003 | 30 | 0.91 | * | ||
| Current study | 2015 | 43 H | 0.93 | 0.96 | 0.67 | Four limbs segmental and whole body |
Abbreviation: H, hemodialysis.
aData are coefficients of correlation (i.e. Pearson’s r).
* Indicates only whole body assessment and not segmental.
Several studies have also presented convincing data, considering the correlation of the measurements of fat mass by DEXA and BIA (14-16, 18, 19). There are similar findings for bone mass (14); however, as it was speculated by Furstenberg, we found that multifrequency BIA overestimates bone mass in hemodialysis patients. The reason behind the increase in bone mass is probably the indirect measurement of bone content by calculations based on the values of normal population that hindered the possibility to extrapolating the calculation algorithm into patients with ESRD suffering acid-base and fluid imbalance (14). Thus, patients are in need of the assessment of bone mineral density by employing the DEXA method periodically.
When the patient is volume overloaded, multifrequency BIA overestimates lean body mass (20). Therefore, measurements should be conducted at a constant hydration status. The advantage of multifrequency BIA is that it can be readily repeated and is noninvasive and inexpensive. Dry weight and target weight for hemodialysis can be calculated by BIA, which would be a great advantage for the quality of hemodialysis and reduction of the complications. The drawback of the procedure is that multifrequency BIA cannot be performed in patients with ICD or pacemaker (21). Malnutrition in patients with ESRD, patients prone to osteoporosis and more reliable bone mineral assessment density may be yet in need. The camera of DEXA is not readily available at dialysis centers and is expensive. The present study supports the use of multifrequency BIA (InBody S10) in assessing the body composition of hemodialysis patients. Nevertheless, more research is needed for the application of this method in patients with changed body geometry and those with volume imbalance (22). The significance of our study is to provide the segmental measurement of lean body mass in all four limbs by two methods that is unique to the best of our knowledge.
