


1. Background
It is estimated that 1.3 million new cases of prostate cancer occurred worldwide, resulting in 359,000 related deaths in 2018. Prostate malignant tumor is the 2nd most frequent cancer in males and the 5th highest mortality rate among the common cancers in them (1).
Given the popularity of prostate specific antigen (PSA) testing in recent years, the number of patients undergoing diagnostic prostate biopsy has increased (2). The transrectal ultrasound guided (TRUS) biopsy is considered as the gold standard for prostate cancer detection, although has a low sensitivity (39% - 52%). Physicians increasingly encounter patients with clinical signs of prostate cancer, but negative TRUS-guided biopsy results. This method is associated with the underdetection of high-grade prostate cancers and the overdetection of low-grade cancers (3-5). Recently, magnetic resonance imaging (MRI)-guided biopsy is used in suspected cases with prior negative biopsy for the diagnosis of prostate cancer, especially its significant types (6).
In recent years, urologists increasingly use MRI-TRUS fusion biopsy to detect prostate cancer (7). This technique was designed to diagnose suspicious cases identified on MRI (8). In MRI-TRUS fusion biopsy, the prostate is imaged using ultrasound, as it is performed in recent decades; but if any suspicious matter occurs, the MRI of that prostate implemented earlier and stored in the device, is fused with real-time ultrasound using a digital connection. The advantage of MRI-TRUS fusion biopsy is its potential to be used in outpatient clinics just in a few minutes under local anesthesia as well as high reliability and accuracy in prostate cancer diagnosis (9, 10).
2. Objectives
The current study aimed at evaluating the detection rate of MRI-TRUS fusion biopsy in prostate cancer in cases with prior negative biopsy.
3. Methods
3.1. Study Sample
In a historical cohort study, all patients who were referred from 1 June 2017 to 30 April 2018 to Modarres, Rasoul Akram, and Payambaran hospitals in Tehran, Iran that undergone transrectal ultrasound biopsy of the prostate, and their benign pathology reports were based on the following criteria were enrolled: (1) increased PSA, (2) lack of PSA compared to previous biopsy, (3) suspicious digital rectal exam, (4) atipical small acinar proliferation in the previous pathology, (5) atypical gland suspicious of cancer in the previous pathology, (6) high-grade prostatic intraepithelial neoplasia (PIN), at least two cores in the previous pathology, and (7) intraductal carcinoma undergoing biopsy in the previous pathology. In the present study, all patients with febrile illnesses, patients with uncorrected coagulation disorders, the ones suspected of metastatic prostate cancer, and also those who referred for the first biopsy were excluded.
3.2. Data Collection
Patients referred to Modares, Rasoul Akram, and Payambaran hospitals were asked to sign the written consent form and complete the basic demographic information questionnaire and then, their prostate volume was determined by a radiologist. Other basic and clinical information of patients including age, prostate volume, total and free PSA level, PSA density, rectal examination findings, number of random and targeted biopsies, biopsy area, Gleason score, and core conflict percentage were recorded in data collection forms. All patients were then subjected to MP-MRI and MR images were interpreted by a radiologist with prostate MRI experience that was blind to research hypothesis. The quality of the completed forms was controlled continuously in order to ensure the accuracy of the information recorded. In the first phase, a number of completed forms were randomly selected and evaluated by another radiologist. At the end of the data collection, the forms were independently logged and coded by two individuals into Excel software. In the case of discrepancies, review of the questionnaire, completion of the contact form, or exclusion of the subject from the study was considered.
3.3. Procedures and Definitions of Variables
The type of visible lesions in the prostate is classified into five groups based on the prostate imaging reporting and data system (PIRADS) version 2 as very low (PIRADS 1), low (PIRADS 2), moderate (PIRADS 3), high (PIRADS 4), and very high risk of malignancy (PIRADS 5). Subsequently, patients underwent MRI-TRUS fusion biopsy. The patients were visited by the cardiologist and in case of using aspirin or antiplatelet and anti-coagulant drugs, their regimens were ceased or changed. Biopsy was not performed febrile subjects or the ones suspected of coagulopathy (based on coagulation tests). Oral ofloxacin 300 mg and metronidazole 500 mg were prescribed twice daily for prophylaxis from 24 hours before to five days after biopsy. One hour before biopsy, 500 mg amikacin immediately before and 500 mg lefloxacin were intravenously injected. Biopsy was performed in left lateral decubitus with local anesthesia (2% lidocaine injection in the prostate capsule) using 18G calibre needles.
According to the number of suspected lesions in the MRI report and based on the prostate volume, 12 to 36 pts were taken from each patient. After the biopsy, the patient was monitored for an hour and then the possible complications including urinary retention, fever and chills, hematuria and rectal cancer were explained to the patient, and it was advised to contact the emergency department immediately if any of the side effects occurred. The specimens were sent to the pathology laboratory and based on the obtained results, information such as Gleason score, number of involved cores, perineural invasion, perilymphatic-vascular invasion, and the percentage of core involvement were recorded in the information form of each patient. The risk of prostate cancer was classified into four groups: PSA risk < 10%, Gleason score 2 to 6, and unilateral or less than 50% involvement of each core as low risk, PSA risk < 10%, Gleason score 3 - 4, and bilateral involvement of each core as moderate risk, Gleason score 3 - 4, PSA risk 10% - 20%, involvement of more than 50% of each core, and perineural invasion as high risk, and Gleason score 8 - 10, PSA > 20%, or perilymphatic-vascular invasion as very high risk. Also, PI-RADS scores ≥ 3 based on multiparametric (MP)-MRI findings were considered as abnormal and vice versa.
3.4. Statistical Analysis
The mean and standard deviation (SD) were used to express quantitative variables, and the frequency and percentage to compare the categorical variables. Independent t-test was used to compare the mean of quantitative variables between the two groups in case of normal distribution and otherwise, the Mann-Whitney test was employed. Chi-square test was used to evaluate the independence of variables between the two groups. To specify the shape of association between the variables, a fractional polynomial model was used. The ROC (receiver operating characteristic) logistic regression model was used to determine the area under the curve (AUC). All analyzes were performed using the STATA 13MP software.
4. Results
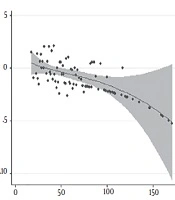
In the study, 191 patients referring to Modarres, Rasoul Akram, and Payambaran hospitals in Tehran were evaluated. The mean age of the subjects was 63.8 ± 8.1 years. The average prostate volume in the studied patients was 60.7 ± 29.8 mL. The results showed a positive correlation between prostate cancer (PCa) and SPA density (Spearman’s rho = 0.29, P value = 0.0001). Furthermore, there was a negative significant correlation between the PCa and prostate volume (Spearman’s rho = -0.27, P value = 0.0001). The shape of association was showed using fracpoly model in Figure 1.

Shape of association between the PCa and prostate volume
A total of 70 (36.6%) cases of positive biopsy were reported from 191 studied patients. Also, the highest rate of prostate cancer was observed in the age group of 65 - 74 years (42.9%). Out of 191 cases of targeted biopsy, 53 (27.75%) were positive, while the number of positive cases for random biopsy was 63 (34%). In terms of number, the targeted and random biopsies were 4.58 ± 2.2 and 9.35 ± 1.76, respectively; the overall number of random biopsies was almost double than the targeted ones (Table 1).
| Variable | Normal MRI, No. (%) | Abnormal MRI, No. (%) | P Value |
|---|---|---|---|
| Positive biopsy | 5 (7) | 65 (92.8) | 0.011 |
| Negative biopsy | 18 (14.9) | 103 (85.1) |
In the current study, the prevalence of prostate cancer in patients with and without lesion on MRI was 38.7% and 21.7%, respectively (Table 2).
| Grade | Normal MRI, No. (%) | Non-Normal MRI, No. (%) | P Value |
|---|---|---|---|
| Low risk | 0 (0) | 20 (13) | 0.12 |
| Intermediate risk | 2 (40) | 6 (9.2) | |
| High risk | 2 (40) | 18 (27.7) | |
| Very high risk | 1 (20) | 28 (43) |
The detection rate of significant cancer in the subjects with lesions on MRI was higher than that of the ones with normal MRI reports, although the difference was not statistically significant (P = 0.12). Figure 2 shows the frequency distribution of risk-based prostate cancer in different groups of PI-RADS score.

Frequency distribution of risk-based prostate cancer in different groups of PI-RADS score
The results showed that the rate of positive agreement between the positive random and targeted biopsies in the study was 33.5%; a total of 48 subjects diagnosed with positive random biopsy were also positive for targeted biopsy.
The frequency of non-detectable cancers by targeted biopsy based on the level of cancer risk showed that at the very high risk level, five subjects (29.4%) and at the high risk level, two subjects (11.7%) were not recognized.
Also, the comparison of the mean Gleeson score in targeted (7.47 ± 0.99) and random (7.13 ± 1.04) positive biopsies showed a significant difference between the two groups (P = 0.045). Table 3 shows the results of the comparison of the prevalence of prostate cancer in terms of risk in the positive outcomes of the targeted and random biopsy.
| Cancer Risk | Positive Targeted Biopsy, No. (%) | Positive Random Biopsy, No. (%) | P Value |
|---|---|---|---|
| Low risk | 5 (9.4) | 11 (16.9) | 0.01 |
| Intermediate risk | 6 (11.3) | 8 (12.3) | 0.11 |
| High risk | 18 (33.9) | 19 (29.2) | 0.013 |
| Very high risk | 24 (45.3) | 27 (41.5) | 0.05 |
| Total | 53(100) | 65 (100) | - |
The results shown on Table 3 indicate that targeted biopsies could better detect high and very high risk cancers compared with the random ones. Table 4 shows the potency of random and targeted biopsies to detect prostate cancer.
| Cancer Risk | Sensitivity (%) | Total | |||
|---|---|---|---|---|---|
| 0 - 25 | 25 - 50 | 50 - 75 | 75 - 100 | ||
| Targeted biopsy | |||||
| Low risk | 8 (61.5) | 3 (23) | 1 (7.6) | 1 (7.6) | 13 (100) |
| Intermediate risk | 2 (25) | 0 (0) | 0 (0) | 6 (75) | 8 (100) |
| High risk | 2 (10) | 2 (10) | 0 (0) | 16 (80) | 20 (100) |
| Very high risk | 5 (17.3) | 0(0) | 0 (0) | 24 (82) | 29 (100) |
| Total | 17 (24.3) | 5 (7.2) | 1 (1.4) | 47 (67.1) | 70 (100) |
| Random biopsy | |||||
| Low risk | 13 (100) | 0(0) | 0(0) | 0(0) | 13 (100) |
| Intermediate risk | 6 (75) | 2 (25) | 0(0) | 0(0) | 8 (100) |
| High risk | 9 (45) | 6 (30) | 3 (15) | 2 (10) | 20 (100) |
| Very high risk | 13 (44.8) | 8 (27.5) | 6 (20.6) | 2 (6.8) | 29 (100) |
| Total | 41 (58.5) | 16 (22.8) | 9 (12.9) | 4 (5.8) | 70 (100) |
Data shown on Table 3 indicate that the potency of targeted biopsies to detect prostate cancer was higher than random biopsies, so that about 82% (n = 24) of the total 29 cases were positive biopsy with a sensitivity of 75%-100% (Table 4). However, this amount was 6.8% for random biopsies.
The comparison of the sensitivity of targeted and random biopsy based on different prostate regions is shown in Table 5.
| Positive Biopsy Rate | Apex | Mid | Base | Inner Lobe |
|---|---|---|---|---|
| Random biopsy, % | 27.2 | 33.6 | 25 | 33.3 |
| Targeted biopsy, % | 90 | 83.7 | 94.4 | 48 |
| P value | 0.001 | 0.005 | 0.001 | 0.01 |
The results of the ROC regression model analysis showed that the AUC for targeted and random biopsies was 0.88% (0.83%) and 87.4% (99.9% - 0.93%), respectively (Figure 3).

Targeted and random biopsy area under curve in studied participants
The results of above-mentioned analyses showed that the sensitivity and negative predictive value for targeted and random biopsies were 75.7% (64% - 83%), 87.7% (81% - 94%), and 92.8% (88% - 97%), 96% (93% - 99%) respectively.
5. Discussion
In the current study, the PSA density, PI-RADS score, presence of lesion on MRI, and smaller prostate volume were correlated with a higher prevalence of prostate cancer.
In the present study, the frequency of prostate cancer diagnosis was 21.7% in cases with normal MR images and 38.7% in those with lesions visible on MRI. In subjects with abnormal MR images, the prevalence of prostate cancer at PI-RADS 4 and 5 was higher than PI-RADS1, 2, and 3 (64.6%). Mean PI-RADS score was 3.7384 and 2.8058 in the subjects with positive and negative biopsies.
The diagnosis rate of prostate cancer in the current study had a significant and negative correlation with prostate volume (mean 66.8 mL in negative and 49.94 mL in positive biopsies). In studies by Al-Azab et al. (11), a smaller prostate volume was a predictive factor for the diagnosis of prostate cancer in TRUS biopsy. In the study by Regis et al. (12), on 175 patients with a prior negative TRUS biopsy, the rate of prostate cancer diagnosis was 33.1% (n = 58).
Furthermore, the presence of lesions on prostate MRI and higher PI-RADS score were correlated with a higher risk of significant prostate cancer. Kesch et al. (13), showed that in case of doubtful MRI lesions, applying the both biopsy methods offers maximum sensitivity for tumor detection.
Several methods are proposed for targeted biopsies (TBx) of mpMRI for suspicious core (14). Direct in-bore TBx can precisely address tumor site with direct image validation of needle placement within the target. Therefore, it can be considered as the gold standard of MRI-guided TBx, although it is costly, has lower access, and is not allowed for simultaneous systematic sampling. However, fusing mpMRI data with TRUS (MRI/TRUS fusion) pools, the superior imaging of mpMRI coupled with the easier-to-use ultrasound guidance, which allows trained operators to complete TBx in real-time in an outpatient clinic, saves time and costs while preserving acceptable targeting accuracy (15, 16).
The negative predictive value was 87.7% and 96% for targeted and random biopsies in the current study, respectively. In the study by Regis et al. on 175 patients with prior negative biopsy, MRI scans had a negative predictive value of 90.2% for not performing a biopsy on patients with a low risk of prostate cancer, which is somewhat consistent with the results of the present study.
The sensitivity of targeted biopsies was 75.7% in the diagnosis of prostate cancer, and 84.3% for significant cancers. On the contrary, in the study by Ahmed on 576 patients, the sensitivity of MP-MRI was 93% in diagnosing significant prostate cancer (17). In the present study, the sensitivity of targeted biopsy to diagnose very high-risk and high-risk cancers was 45.3% and 33.9%, respectively. The sensitivity of random biopsy to diagnose very high-risk and high-risk cancers was 41.5% and 29.3%, respectively.
The difference in the diagnosis of very-high-risk and high-risk cancers in two groups was 8.5%, in favor of targeted biopsy; the difference was reported 30% in a study by Siddiqui et al. (18). In the present study, the sensitivity of targeted biopsy to diagnose low-risk cancer was 9.4%, while it was 16.9% in random biopsy; the difference between the results was significant (7.5%). In the study by Pokorny et al. (19), the sensitivity was 6.1% and 37.3% for the targeted and random biopsies, respectively. The important point was that in both of the aforementioned studies, most patients were the first-time biopsy cases.
In the present study, of the 70 cases diagnosed with prostate cancer, targeted biopsy failed to diagnose 17 cases (a false negative biopsy), of which nine cases (53%) had a significant cancer. The results demonstrated the necessity of performing systematic random biopsy simultaneously with targeted biopsy.
In the present study, the sensitivity of targeted biopsy was 94.4% and 90% in the diagnosis of prostate cancer at the base and apex, respectively; whereas random biopsy had a sensitivity of 25% and 27.2% in the same regions, respectively. In the study by Sazuka et al. (20), results of permanent radical prostatectomy pathology of 158 patients were compared with those of pre-operative TRUS biopsy. In radical prostatectomy, 85% of cancer cases showed the apex involvement. Of 118 patients with apex involvement in permanent pathology, TRUS biopsy reported 53 cases (45%) as negative. It demonstrated the advantage of MRI-guided targeted biopsy to diagnose prostate cancer in the apex, which is the most common region for positive margin in radical prostatectomy and where the TRUS biopsy has a high risk of missing.
In the present study, systematic random biopsy diagnosed more cases of prostate cancer (in total and based on risk classification) compared to that of targeted biopsy (n = 65 vs. n = 53). Although this difference was not significant, based on the bias resulting from the larger number of random biopsies, multivariate analysis was performed and the sensitivity of biopsy methods was assessed based on the percentage of positive biopsies divided by the total number of biopsies. The sensitivity of targeted biopsy was significantly more than that of random biopsy in the general diagnosis of cancer and also in cancers with a higher relapse rate.
In the current study, although the diagnosis rate of prostate cancer was higher using random biopsy compared to targeted biopsy, the difference was not statistically significant; given to the percentage of positive biopsies divided by the total number of targeted biopsies, the sensitivity of targeted biopsy in the diagnosis of cancer, especially its significant type, was significantly higher than random method.
The sensitivity of targeted biopsy was significantly higher than random biopsy in the diagnosis of prostate cancer in the apex and base of the prostate. In addition to the abovementioned issues, MRI-guided in-bore prostate biopsies are linked with lower amounts of overall problems compared with TRUS-guided PB, comprising bleeding, hematuria, and hematospermia (21-23).
5.1. Conclusions
Most high-risk lesions identified with targeted and random biopsies were also positive for low-risk measures, and the number of cancer cases undiagnosed by targeted biopsy was high (24.2%); however, 53% of them had significant cancer, indicating the importance of performing random and targeted biopsies, simultaneously.
