

1. Background
Bladder cancer is among the top ten most prevalent cancers in the world that accounts for 3% of all new cancer cases every year (1). Although the rate of the disease is different between geographical regions, approximately 2.1% of all cancer deaths are due to urinary bladder cancer (UBC) (2). Risk factors for UBC are diverse, including environmental and occupational factors. Socioeconomic status, age, gender, race, smoking, infections, and living environmental factors (e.g., arsenic, aromatic compound, and metal processing) are among the well-known UBC risk factors (3, 4). Urinary bladder cancer is highly recurrent, and the cost of medical care is noteworthy (5).
According to the European Association of Urology (EAU), bladder cancer is divided into several types, including urothelial carcinoma, squamous epithelial carcinoma, and adenocarcinoma. However, classically it is divided into the two main subtypes of non-muscle invasive bladder cancer (NMIBC) and muscle-invasive bladder cancer (MIBC) (6). Most patients (75% - 85%) are classified as NMIBC, which can be further categorized into Ta(non-invasive), T1(invasive), or carcinoma in situ (CIS) (7). Significant muscle invasion risk in the first five years and limited prediction of patient outcomes should be taken to account for a better understanding of the disease and underlying signaling (7).
Non-muscle invasive bladder cancer is very heterogeneous, and the biological variation during its progression is still debated. Many studies have been conducted to unravel the molecular basis of this diversity and to establish a therapeutic perspective. Briefly, five molecular subtypes are suggested, namely urobasal A, genomic unstable, infiltrated, urobasal B, and squamous cell carcinoma-like (8). Later, the European UROMOL Consortium suggested three sub-classes based on comprehensive transcriptomic profiling (9). Moreover, different studies with different biological samples addressed the molecular heterogeneity of NMIBC and suggested molecular profiling. RNA-seq and microarray analysis have suggested several key regulatory genes and pathways, which are very controversial and still need progress (9-14).
2. Objectives
Here, we report landmarks for the better classification of low-grade and high-grade NMIBC based on several GEO datasets. Considering the obtained DEGs and PPI networks for low-grade and high-grade NMIBC using bioinformatics tools, we introduced genetic signatures expressed by each grade along with hub genes and protein networks. The underlying biological process and pathways with prognostic and therapeutic features were also determined.
3. Methods
3.1. Microarray Data Collection
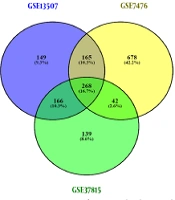
As summarized in Figure 1, the initial search was carried on the Gene Expression Omnibus (GEO; https://www.ncbi.nlm.nih.gov/geo/) database. Based on studies meeting the inclusion/exclusion criteria and after several steps, three gene expression profiling datasets, including GSE7476, GSE13507, and GSE37815, met the criteria. GSE7476 with three normal, six low-grade, and three high-grade samples was measured in this array (platform: GPL570, Affymetrix Human Genome U133 Plus 2.0 Array). GSE13507 (platform: GPL6102, Illumina human-6 v2.0 expression beadchip) with 9 normal, 86 low-grade, and 17-high grade samples, and GSE37815 (GPL6102, Illumina human-6 v2.0 expression beadchip platform) with 5 normal, 13 low-grade, and 5 high-grade samples were also used in this study (15-17).

Schematic design of microarray data collection and inclusion/exclusion criteria of the study
3.2. Data Processing
To recognize the DEGs, expression data was preprocessed, which included the Robust Multichip Average (RMA; method in R statistical software [reference]) background correction, using the Bioconductor packages. The median polish algorithm was used for RMA background adjustment performance, quintile normalization, and final summarization of oligonucleotides per transcript. The Lumi package in Bioconductor was used for processing and quintile normalization of Illumina microarray data (reference). Differentially expressed genes were screened in each dataset for low and high-grade lists, using the package Limma. Genes with [logFC ≥ 1] and P-value < 0.05 were chosen as DEGs. Gene lists were sorted by their up-regulation or down-regulation patterns in each low or high-grade list and retrieved for the subsequent steps. To obtain the DEGs subscriber list, low and high-grade DEGs lists from three datasets were integrated using venny2.1 (http://bioinfogp.cnb.csic.es/tools/venny/).
3.3. Gene Ontology analyses for DEGs
Low-grade and high-grade DEGs Biological process and pathway enrichment analysis were performed using the ClueGO plug-in in Cytoscape software (Cytoscape_v3.6.1). The gene ontology (GO) enrichment analyses was considered with P-value ≤ 0.005. The obtained data was sorted according to "Term P-value corrected with Bonferroni step-down", and the ten GOID were selected.
3.4. Protein-Protein Interactions (PPIs) Network and Module Analysis
To investigate the relationship and interaction between the genes listed as DEGs for further characterization of the study, we used Search Tool for the Retrieval of Interacting Genes (STRING; http://string-db.org/) with 0.7 as a threshold. Protein-protein interaction network was used for subsequent analyses in Cytoscape to study different parameters and search clusters and modules in each PPI network. Hub genes were retrieved according to their degree, betweenness, stress, closeness, and bottleneck in Cytoscape individually, and their common network was considered a hub network for each grade. The top ten hubs were sorted according to their degree and GO biological processes derived from the UniProt database (http://uniprot.org). Modules of each PPI network were screened using MCODE plug-in in Cytoscape considering default parameters. The top three modules from each grade were chosen, and each module was evaluated by ClueGO plug-in in Cytoscape (P-value ≤ 0.005). The obtained data was sorted according to the "Term P-value corrected with Bonferroni step-down", and the most important GO terms were illustrated for each module.
3.5. GO Analyses for PPI Networks
To understand the importance and differences between DEGs and network-involved genes, low grade, and high-grade PPI networks were evaluated using Cytoscape ClueGO plug-in. Gene ontology biological process and pathway with P-value ≤ 0.005 were considered. The top ten GOID were sorted according to "Term P-value corrected with Bonferroni step-down".
4. Results
4.1. Identification of DEGs and Integration
Dataset selection was performed according to our criteria. Normalization and quality control were performed using PCA meta-analysis or R packages. Differentially expressed genes screening with Limma package resulted in two different DEGs lists (high-grade and low-grade NMIBC) for each dataset, as shown in Figure 2A. Eventually, after integrating the obtained DEGs from three datasets, two separate DEGs lists met the standards for high-grade (392 genes) and low-grade (411 genes) NMIBC, which included up and down-regulated genes (Figure 2B and C).
 for each dataset (A). The obtained DEGs from three datasets were analyzed, and 392 and 411 genes were found for high-grade and low-grade NMIBC, respectively, which included down and up-regulated genes (B and C).")
Identification of differentially expressed genes, integration, and the number of up and down-regulated genes. Differentially expressed genes screening of three datasets resulted in two different DEGs lists (high-grade and low-grade NMIBC) for each dataset (A). The obtained DEGs from three datasets were analyzed, and 392 and 411 genes were found for high-grade and low-grade NMIBC, respectively, which included down and up-regulated genes (B and C).
4.2. DEGs Analysis
According to the identified integrated DEGs, top 30 up and down-regulated genes in low and high grade NMIBC were sorted based on their P-value (average Log FC demonstrated). Then, gene ontology enrichment analysis was performed using ClueGO (a bioinformatics plug-in in Cytoscape to visualize functionally grouped GO or pathway-term networks). The obtained GO terms were sorted according to "Term P-value corrected with Bonferroni step down". The top five GO terms in low and high-grade NMIBC are demonstrated in (Table 1) As seen, low-grade DEGs were involved in a variety of GO biological processes, while the top five GO biological processes for high-grade NMIBC demonstrated DEGs participation in cell cycle and cell division.
| GOID | GO Term | P-Value |
|---|---|---|
| Low-grade NMIBC | ||
| GO:0009653 | Anatomical structure morphogenesis | 5.29E-15 |
| GO:0030198 | Extracellular matrix organization | 1.44E-14 |
| GO:0043062 | Extracellular structure organization | 1.59E-14 |
| GO:0048513 | Animal organ development | 5.39E-14 |
| GO:0009888 | Tissue development | 1.58E-13 |
| R-HSA:1474244 | Extracellular matrix organization | 2.87E-11 |
| R-HSA:445355 | Smooth muscle contraction | 1.04E-06 |
| R-HSA:2129379 | Molecules associated with elastic fibers | 1.94E-05 |
| R-HSA:114608 | Platelet degranulation | 4.59E-05 |
| R-HSA:397014 | Muscle contraction | 5.57E-05 |
| High-grade NMIBC | ||
| GO:1903047 | Mitotic cell cycle process | 2.97E-13 |
| GO:0000278 | Mitotic cell cycle | 6.28E-13 |
| GO:0022402 | Cell cycle process | 6.05E-12 |
| GO:0007010 | Cytoskeleton organization | 2.09E-11 |
| GO:0044770 | Cell cycle phase transition | 1.94E-10 |
| R-HSA:69278 | Cell cycle, mitotic | 1.55E-09 |
| R-HSA:1640170 | Cell cycle | 3.37E-08 |
| R-HSA:1474244 | Extracellular matrix organization | 4.50E-08 |
| R-HSA:69620 | Cell cycle checkpoints | 4.51E-05 |
| R-HSA:2500257 | Resolution of Sister Chromatid Cohesion | 1.92E-04 |
4.3. PPI Network Visualization and Hub-genes Analysis
Protein–protein interaction in low-grade and high-grade DEGs were investigated using STRING database and results were analyzed by Cytoscape. The top ten hub genes in low-grade and high grade NMIBC were sorted by degree (Table 2, Figure 3 and Appendix 1 in Supplementary File). These genes were among the top 10% genes classified according to betweenness, too. To investigate their biological importance, we used the UniProt database (https://www.uniprot.org/). Almost all the ten hubs in the low grade list were down-regulated, including GAS6, TGFB3, and TPM1. Among this decay pattern, SDC1 demonstrated a significant increase as a substantial hub gene. All the high-grade hubs were up-regulated, and according to their GO biological process, partly involved in cell division.
| Gene Symbol | Degree | GO Biological Process |
|---|---|---|
| Low-grade Hubs | ||
| GAS6 | 15 | Activation of protein kinase B activity, animal organ regeneration, apoptotic cell clearance |
| TGFB3 | 14 | Activation of MAPK activity, aging, cell-cell junction organization |
| TPM1 | 13 | Actin filament organization, cardiac muscle contraction, cellular response to reactive oxygen species |
| SDC1 | 11 | Canonical Wnt signaling pathway, cell migration, cytokine-mediated signaling pathway |
| COL5A1 | 11 | Blood vessel development, cell adhesion, cell migration |
| COL1A2 | 11 | Blood coagulation, blood vessel development, bone mineralization |
| SERPING1 | 11 | Aging, blood circulation, blood coagulation, intrinsic pathway |
| ACTA2 | 11 | Glomerular mesangial cell development, mesenchyme migration, muscle contraction |
| TPM2 | 11 | Actin filament organization, actin filament binding |
| A2M | 10 | Blood coagulation, extracellular matrix disassembly, negative regulation of complement activation |
| High-grade Hubs | ||
| CDK1 | 82 | Activation of MAPK activity, anaphase-promoting complex-dependent catabolic process, apoptotic process |
| CCNB1 | 80 | Anaphase-promoting complex-dependent catabolic process, cell division, cellular response to hypoxia |
| CDC20 | 78 | Anaphase-promoting complex-dependent catabolic process, cell division, mitotic sister chromatid cohesion |
| KIF11 | 77 | Cell division, mitotic cell cycle, mitotic centrosome separation |
| TOP2A | 77 | Cellular response to DNA damage, chromosome segregation, DNA topological change, apoptotic chromosome condensation |
| AURKA | 76 | Cell division, G2/M transition of the mitotic cell cycle, negative regulation of apoptotic process |
| CCNA2 | 76 | Cell cycle G1/S phase transition, positive regulation of cell cycle, cell division |
| BUB1B | 76 | Cell population proliferation, anaphase-promoting complex-dependent catabolic process, cell division |
| CCNB2 | 75 | Cell division, G2/M transition of mitotic cell cycle, mitotic nuclear envelope disassembly |
| MAD2L1 | 75 | Anaphase-promoting complex-dependent catabolic process, cell division, mitotic cell cycle checkpoint |
.")
The illustrated networks of low-grade and high-grade hub genes. Protein-protein interaction in low-grade and high-grade DEGs was investigated using the STRING database. In the following, the obtained results were analyzed by Cytoscape. The networks of low-grade and high-grade hub genes are illustrated (A and B, respectively).
Next, MCODE was used providing the possibility of functional modules recognition from PPI networks, and the top three modules were selected for further investigation. Each module gene was introduced to Cytoscape ClueGo plug-in to study their GO biological process and pathway and most important GO term illustrated in Appendix 2. Almost all the main modules in both low-grade and high-grade NMIBC showed a down-regulated pattern. Although module 1 in the high-grade network (which has the highest cluster score) was up-regulated, its function in the mitotic cell cycle justified this distinct elevation.
4.4. GO Analysis of PPI Network
A significant part of up-regulated genes in low-grade NMIBC had no participation in its PPI network. Hence, GO analysis for low-grade and high-grade PPI networks, using ClueGO plug-in in Cytoscape, revealed differences between DEGs and PPI network GO. The top five GOID in Biological Process and Pathway were considered (Table 3).
| GOID | GO Term | P-Value |
|---|---|---|
| Low-grade NMIBC | ||
| GO:0030198 | Extracellular matrix organization | 1.36E-16 |
| GO:0043062 | Extracellular structure organization | 1.47E-16 |
| GO:0009611 | Response to wounding | 1.32E-15 |
| GO:0003012 | Muscle system process | 4.50E-13 |
| GO:0042060 | Wound healing | 4.82E-12 |
| R-HSA:1474244 | Extracellular matrix organization | 5.94E-15 |
| R-HSA:445355 | Smooth muscle contraction | 7.47E-09 |
| R-HSA:397014 | Muscle contraction | 1.17E-07 |
| R-HSA:216083 | Integrin cell surface interactions | 3.44E-07 |
| R-HSA:3000178 | ECM proteoglycans | 7.59E-07 |
| High-grade NMIBC | ||
| GO:1903047 | Mitotic cell cycle process | 3.89E-15 |
| GO:0000278 | Mitotic cell cycle | 4.89E-15 |
| GO:0022402 | Cell cycle process | 2.73E-13 |
| GO:0007010 | Cytoskeleton organization | 4.32E-13 |
| GO:0044770 | Cell cycle phase transition | 1.14E-11 |
| R-HSA:69278 | Cell cycle, mitotic | 1.60E-10 |
| R-HSA:1640170 | Cell cycle | 3.49E-09 |
| R-HSA:1474244 | Extracellular matrix organization | 4.63E-08 |
| R-HSA:69620 | Cell cycle checkpoints | 1.31E-05 |
| R-HSA:2500257 | Resolution of sister chromatid cohesion | 8.40E-05 |
5. Discussion
Of all patients diagnosed with bladder cancer every year, approximately 75% are non-muscle-invasive (18, 19). Non-muscle invasive bladder cancer is highly diverse, accompanied by a high recurrence rate and tumor progression in the first five years of diagnosis, which makes follow-up and healthcare costs a significant burden (20).
In this study, we aimed to a detailed recognition of the mechanisms involved in bladder cancer using bioinformatics tools. GSE7476, GSE13507, and GSE37815 datasets were analyzed, and 392 genes for high-grade NMIBC and 411 genes for low-grade NMIBC were identifies (20, 21). The top five enriched GO biological process and pathway resulted from ClueGO indicated low-grade biological process and pathways with more diverse coverage, including extracellular structure organization, developmental process, platelet degranulation, and muscle contraction. However, almost all the biological processes and pathways involved in the high-grade list were involved in cell cycle or cell division.
The visualization of low-grade and high-grade PPI network using STRING and Cytoscape illustrated two different networks. Low-grade PPI network included 167 nodes, and almost all of them were down-regulated. On the contrary, a high-grade PPI network had 344 nodes with up-regulated genes. Sorting genes according to their degree determined hub genes in the networks. Comparison of their betweenness revealed hub genes among the first 20% genes sorted by betweenness.
Almost all the introduced hub genes in the low-grade PPI network were down-regulated, including GAS6, TGFB3, TPM1, COL5A1, COL1A2, SERPING1, ACTA2, TPM2, and A2M. Between the top ten hub genes, SDC1 was the only up-regulated gene. Growth arrest-specific protein6 (GAS6) is a vitamin K-dependent protein that can activate the TAM family of receptor tyrosine kinases (RTKs), such as TYRO3, with versatile roles in cancers (22, 23). Although GAS6 down-regulation has been reported in one study on MIBC samples, several groups have shown no significant changes (24, 25). Here, we reported strong down-regulation of GAS6 in several analyzed datasets of NMIBC.
Extracellular matrix proteins such as collagen alpha-2(I) chain (COL1A2), alpha-2-macroglobulin (A2M), and plasma protease C1 inhibitor (SERPING1) showed significant down-regulation as hub genes in low-grade NMIBC. Researchers have shown changes in the expression of ECM genes in bladder cancer, especially as promoters of switching from NMIBC to MIBC (26-28). Moreover, these genes, along with GAS6, are involved in platelet activation and coagulation pathways which have a pivotal role in cancer progression and metastasis (29, 30). These expression changes in low-grade but not high-grade NMIBC suggest profound functional studies to better unraveling their therapeutic potentials.
Tropomyosin alpha-1 chain (TPM1), tropomyosin beta chain (TPM2), and actin, aortic smooth muscle (ACTA2) play a role in actin filament organization (31, 32). Studies have shown that disruption in stress fibers like actin filaments enhanced tumor motility and invasion (31, 33, 34). Low expression of TPM isoforms is better described in metastatic bladder cancer and high-grade urothelial carcinoma. It is suggested that low expression of TPMs destabilizes their complex with actin filaments, which promotes metastatic spread (35). Interestingly, here we reported NMIBC stage diversity as a result of down-regulation of these genes in low-grade but not high-grade NMIBC.
Syncecan-1 (SDC1/CD138) has a normal expression in epithelial cells and participates in the regulation of different biological processes due to its ectodomain ability to bind to different ligands (36). Although studies demonstrated its role in cellular processes such as cell growth, migration, and angiogenesis (37, 38), its down-regulation has been reported in epithelial to mesenchymal transition in bladder cancer (39). In our study, up-regulated SDC1 was among the top ten hub genes in low-grade NMIBC, while it diminished in high-grade DEGs.
Top ten hub genes in high-grade PPI networks demonstrated common features, including significant high degree, up-regulated expression profile, and critical role in cell cycle and cell division. Most of the high-grade hub genes are cyclins and kinases such as CDK1, CCNB1, AURAKA, CCNA2, BUB1B, and CCNB2, which play a key role in cell division and cell cycle. In addition, KIF11, TOP2A, MAD2L1, and CDC20 are among the top ten hub genes in high-grade NMIBC. This observation in high-grade NMIBC shows how NMIBCs may switch to more invasive forms such as MIBC or progress to metastatic forms.
What is observed in comparing high-grade DEGs and PPI network nodes is a meaningful match and coordination, which originates from the similarity of the two lists. Interestingly, Lee et al. demonstrated core nuclear division-related genes as the most important enriched genes in MIBC, while extracellular matrix-related genes enrichment was significant in NMIBC without considering tumor grading (40). The similarity of high-grade NMIBC to MIBC is notable.
5.1. Conclusions
In summary, the aim of this study was to increase our knowledge regarding the molecular pathways underlying different stages of NMIBC through integrated bioinformatics analysis. Our observations also identified several key regulators and biological pathways that could control high-grade versus low-grade NMIBC. These candidate biomarkers could potentially aid future studies with therapeutic approaches. However, further in vitro experiments are necessary to validate the in silico analysis demonstrated here.
