1. Background
Malignant pleural mesothelioma (MPM) is associated with a median life expectancy of approximately one year (1). Therefore, the majority of patients with MPM are treated with palliative intent, with the emphasis on symptom control. The most common symptom in MPM is pain, which is often very difficult to treat (1, 2). While opioids, adjuvant analgesics and even interventional anaesthesia are often employed, radiotherapy remains a commonly used treatment. However, there is a paucity of data to support its use in this setting. Based on current available evidence, it is difficult to offer an accurate estimate of the likely benefit from radiotherapy for treating pain in MPM with response rates quoted between 0 and 69% (3).
One of the possible reasons for this huge variability in response to radiotherapy for treating pain in MPM is that radiotherapy planning in MPM is challenging. MPM affects the lining of the entire lung and, as a result, pain is often diffuse. The treating oncologist must balance the risks and possible toxicities of treating large volumes with the risk of failing to achieve pain control if smaller volumes are treated. At present, techniques for planning and treating MPM with palliative radiotherapy are crude. The area of pain in MPM is often widespread and may or may not correspond to disease bulk on CT imaging. The treating radiotherapist may have to compromise by directing treatments to areas of disease which may or may not wholly correspond to pain. There is a need to optimize radiotherapy planning in MPM with the ultimate aim of improving response.
One possible method for achieving this is through using positron emission tomography-computed tomography (PET-CT) scanning in radiotherapy planning. The role of PET-CT in radiotherapy planning is established in some cancers and, in non-small cell lung cancer (NSCLC), is recommended for routine use in this setting (4).
Preliminary work examining the value of PET-CT in radical radiotherapy planning and assessing response to chemotherapy in MPM has been performed (5, 6). To our knowledge, its role in palliative radiotherapy planning in MPM has not been explored, particularly in terms of defining optimum treatment volumes. We hypothesised that incorporating PET-CT into radiotherapy planning for treating pain in MPM might improve target volume definition, resulting in better pain control.
2. Objectives
Therefore, the aim of the present study was to explore the role of PET-CT in radiotherapy planning for the treatment of pain in MPM.
3. Patients and Methods
As part of a multi-centre prospective single-arm phase II study examining the role of radiotherapy for the treatment of pain in MPM (ISRCTN 10644347), a subgroup of patients underwent PET-CT scanning. The study was performed in a regional cancer center in the UK. The study was approved by the institutional review board and all subjects provided written informed consent.
Eligible patients were 18 years of age or over, had a diagnosis of MPM (histological or multidisciplinary team), mesothelioma related pain for which radiotherapy was planned, a life expectancy of at least three months and a performance status of 0 - 2 (Eastern Cooperative Oncology Group-ECOG). Consecutive patients were recruited from May 2012 until December 2013.
All patients underwent CT-based radiotherapy planning prior to PET-CT imaging. All planning CTs were captured on a light speed simulator LS RT 16 GE Medical CT scanner (GE Medical systems, Crawley, UK) using a 120 kV automatic mA modulation range of 15 - 240 mAs with 50 cm dual field of view. Radio-opaque wire markers were positioned on the patient on the outer aspects of the painful areas to help correlate clinical and radiological findings. Gross tumour volume (GTV) was defined as the volume of tumour that was felt by the clinician to be responsible for the pain. The GTV to PTV margin was 1.5 cm. All patients were treated with 20 Gy in five fractions using a Varian Linear Accelerator.
Prior to undergoing PET-CT imaging, patients were fasted for at least six hours and then imaged one hour after injection of 400 MBq Fluorine-18-Fluorodeoxyglucose (18F-FDG). Imaging was performed using an integrated PET-CT system (Discovery-690, general electric (GE) system, Milwaukee, WI, USA). To replicate the radiotherapy treatment position, patients were positioned supine on a radiotherapy flat bed insert and immobilized using a CIVCO posirest-2. LAP lasers were then used to position the patient centrally in the scanner. Whole body CT images were acquired using a 120 kV automatic mA modulation range of 15 - 240 mAs. The encompassed field of view was from the skull base to the upper thigh, with reconstructions performed at 2.5 mm increments. This was followed by whole body PET acquisition, encompassing the same transverse field of view as the CT. PET attenuation correction was based on the CT data and images were corrected for scatter and iteratively reconstructed using time of flight and SharpIR on a 192 × 192 matrix. All acquired images and SUV data were exported to a dedicated GE workstation (ADW 4.5) for viewing and reporting.
PET-CT images were assessed together three months after the final patient received radiotherapy in order to reduce recall bias. PET-CT images were transferred to a radiotherapy treatment planning system (Eclipse 10.0.42) and into a DICOM RT format. PET-CT images were then fused with CT planning images, termed Planning-PET-CT. The window and level for the PET images were set according to a previously described protocol using a 7 g/mL threshold (7). To enable evaluation of whether SUV correlated with pain, maximum SUV (g/mL based on body weight) were recorded for both irradiated tumour and for tumour out with the radiation field.
Contouring was performed independently by three clinicians. Each clinician outlined a GTV and PTV based initially on the standard radiotherapy planning CT scan. Once each clinician had contoured all patients, they were then permitted access to the E-PET-CT. At this time, each clinician re-contoured a GTV and PTV using the E-PET-CT images again for all patients.
3.1. Statistical Procedures
The difference in overall treatment volumes (%) between CT and Planning-PET-CT was assessed. The concordance in volumes (GTV) outlined between CT and Planning-PET-CT was calculated using the conformity index (CI). A CI of 1 represented complete concordance between the CT and Planning-PET-CT, while a value of 0 represented no concordance (8).
CT was defined as the reference parameter and Planning-PET-CT was the evaluation parameter. The difference in shape of treatment areas between CT and Planning-PET-CT was assessed using mean distance to conformity (MDC). The center of gravity distance (CGD) assessed the difference from the central point of the reference volume and the evaluation volume. The under contoured volume (UCV) was the volume that was contoured in the reference volume, but not contoured in the evaluation volume and is expressed in %. The over contoured volume (OCV) is the volume that is contoured in the evaluation volume that is not contoured in the reference volume and is expressed in %. These parameters were calculated using ImsimQA version 3.0.77.
Patients whose pain improved following radiotherapy were defined as pain responders. A pain response was defined as a 30% drop in the brief pain inventory (BPI) score 5 weeks after radiotherapy.
To facilitate analysis, parameters were averaged across the clinicians for each patient. The comparison between Planning-PET-CT and CT was made using a Wilcoxon signed rank test. All analyses were performed in SPSS v22.0 (Chicago IL.). An exploratory analysis of maximum standard update value (SUV) was performed to see if there was any potential association between these values and pain response or overall survival.
4. Results
Sixteen patients were recruited and patient characteristics are shown in Table 1. All patients had a histological diagnosis of MPM. The majority of patients were male (n = 14) and the median age (IQR) was 75 years old (65 - 79). Median survival was 4.1 months (95% CI: 2.6 months to 5.5 months) from time of study registration. One patient was excluded from the study as he had a small, palpable tumour lump that was delineated by palpation rather than using imaging. Therefore, 15 patients were included in the analysis. In all patients, there was abnormal SUV uptake in the thorax.
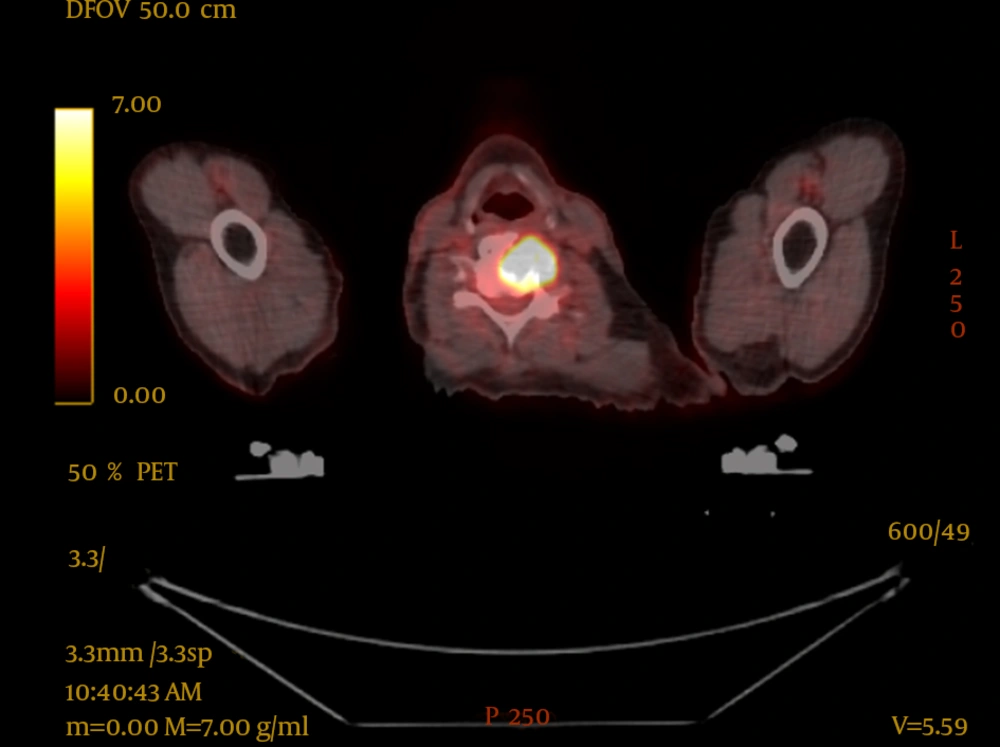
PET-CT resulted in upstaging of 9 of the 16 patients (56%), compared with conventional CT imaging. One patient was upstaged from T3 to T4 (6%), four patients had upstaging of nodal disease (25%) and five patients were found to have metastatic disease (31%), one of whom also had nodal upstaging. In two of these patients, this led to palliative radiotherapy being delivered, one of whom had impending spinal cord compression at the level of C5 which was above the scanning level of the staging CT, as seen in Figure 1. The bone metastases were not seen on the conventional CT of either patient.
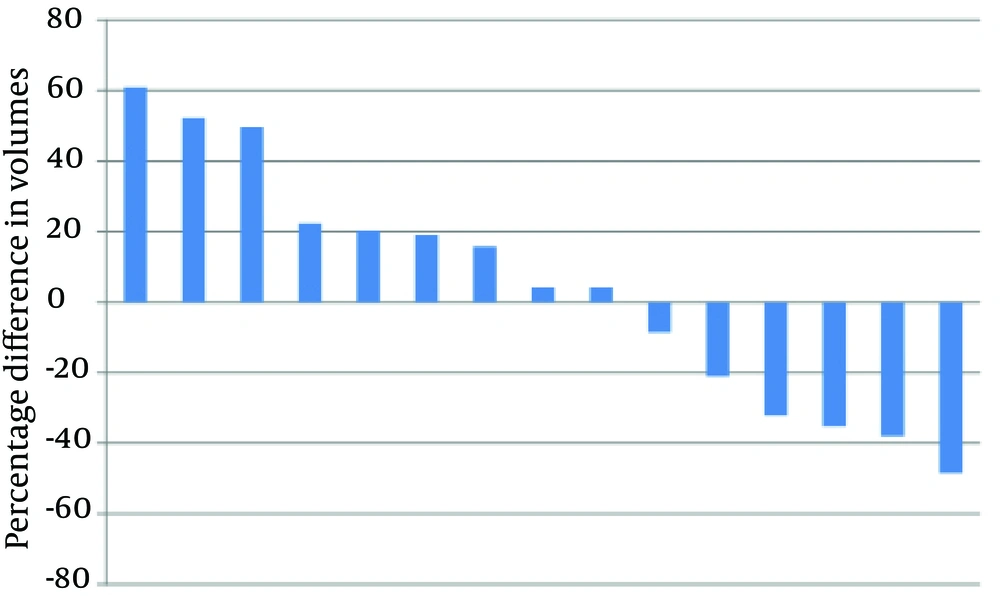
Differences in PTV volumes delineated using CT and Planning-PET-CT are shown in Figure 2. In nine patients, PTV was larger when delineated using Planning-PET-CT compared with CT and in six patients it was smaller. Median Planning-PET-CT defined volume was increased by 4.14% compared with CT (IQR: -32.09% smaller to +22.25%) but this was not statistically significant (P = 0.65).
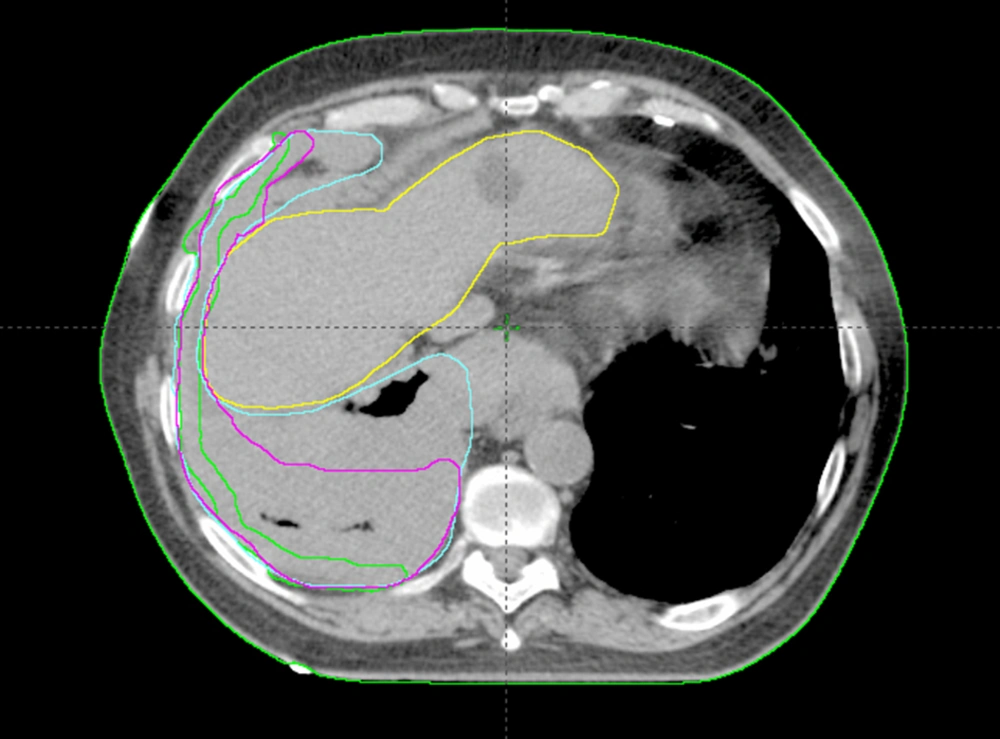
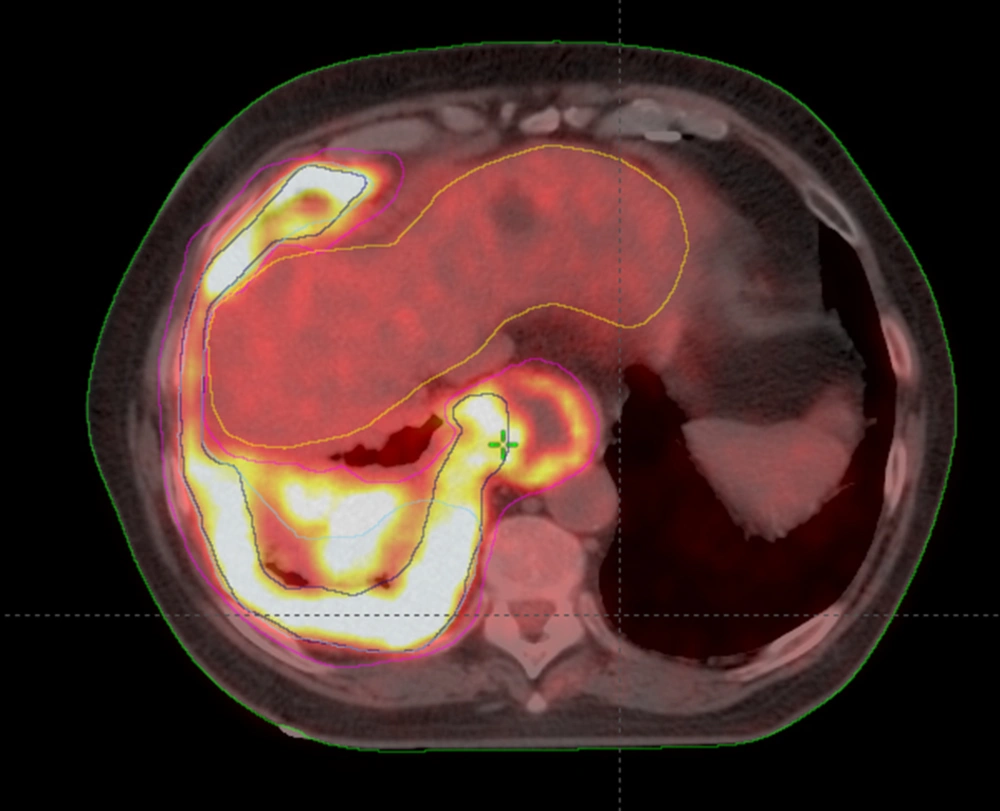
Analysis of CI, MDC, CGD, under/over-contouring and volume mismatch is shown in Table 2. The low value for CI (0.30) and high values for MDC (21.47 mm) and CGD (16.40 mm) as well as the high percentage of over- and under-contouring (44.00 and 46.67%, respectively), indicate significant discrepancies in the anatomical location of volumes outlined using CT or Planning-PET-CT. Figures 3 and 4 show representative images illustrating differences in GTV contouring between individual clinicians when CT and Planning-PET-CT datasets were used to guide volume delineation.
| Parameter, Unit/Range | Median | IQR |
|---|---|---|
| 0.30 | 0.24 - 0.38 | |
| 21.47 | 16.73 - 33.70 | |
| 4.14 | -32.09 - 22.25 | |
| 92.33 | 77.33 - 130.33 | |
| 16.40 | 11.80 - 33.87 | |
| 44.00 | 34.33 - 72.50 | |
| 46.67 | 34.00 - 55.00 |
At the time of PET-CT acquisition, median blood glucose concentration was 5.0 mmol/L (range 4.2 - 6.3). Median SUV max was 17.6 (IQR 12.5 - 23.0). Median survival in patients with SUV max less than 17.6 was 3.7 months (95% CO 3.3 - 4.1) compared with 4.1 months (95% CI 0 - 9.6) for patients with SUV max greater than 17.6, a difference that was not statistically significant.
There was an association between SUV max and pain with SUV max being higher in the irradiated area than the non-irradiated area. The median difference in SUV max between these areas was 4.0 (IQR 0.8-8.6), P = 0.035.
Mean SUV max for pain responders was 17.4 compared with 18.1 for non-responders. The variability and difference in group sizes makes it impossible to draw any robust conclusions about differences between responders and non-responders using SUV parameters.
5. Discussion
These findings show that incorporation of PET-CT imaging in the radiotherapy planning process alters the anatomical location of the target volume in patients with MPM. There was an association between SUV max and location of pain with the painful (irradiated) area having a higher SUV max than the non-painful (non irradiated) area. This did not translate into increased response rates to radiotherapy in patients with higher SUV max values. PET-CT also upstaged a large percentage of patients. In two patients this led to palliative radiotherapy being delivered to sites of painful bony disease. One of these patients had imminent spinal cord compression in the cervical spine.
Comparing our findings to previous work is difficult as, to date, only one other study has examined PET-CT in radiotherapy planning in MPM (6). Pehlivan and co-workers examined 13 patients and outlined GTV and PTV using both CT and fused PET-CT. All target volume delineation was performed by one radiation oncologist and checked by another. The GTV comprised of macroscopic primary tumour along with involved hilar and mediastinal lymph nodes. The authors found that in 12 of the 13 patients, the GTV and PTV were significantly smaller when using the fused PET-CT images, with a mean GTV reduction of 47.1% (+/- 28.4%). The main difference between this previous work and the present study is that we assessed palliative radiotherapy planning as opposed to radical radiotherapy. This may well account for differences in the findings.
The present study therefore increases the knowledge base in two ways. Firstly, the use of PET-CT significantly alters the location of the target volume. It is also of interest that SUVmax was higher in the irradiated areas, which by default, were the areas where pain was the most severe. This association has not previously been reported in lung cancer or MPM per se, however, it has been demonstrated that increased SUV uptake is associated with increased pain and subsequent response to radiotherapy in bone metastases (9). The present study was not powered to examine whether increased SUVmax predicted increased likelihood of response to radiotherapy, but this would be of interest in future work. Indeed PET-CT based treatment planning could be used to target all metabolically active disease, which presumably, causes the most pain.
Secondly, PET-CT upstaged a large proportion of patients and therefore, it should be considered as a staging investigation when radical treatment is being considered.
This places PET-CT in a favorable light and the utility of this is supported by its increasing use in MPM. It can play a role in differentiating benign from malignant lesions and help target the most suitable lesion for biopsy (10). In addition, it has been shown to be effective in pre-operative imaging, particularly with regards to detecting distant metastases (11, 12). Given the diffuse, infiltrative nature and asymmetric growth pattern of MPM, measuring response to treatment with CT is extremely difficult. One study looked at changes in total glycolytic volume (TGV) in PET-CT and suggested that a decrease in TGV after chemotherapy, related to a survival advantage (13).
PET-CT can also be helpful for radiotherapy planning when there is significant atelectasis. Although contouring with PET-CT is generally smaller that with CT alone, one study did show that contouring with PET-CT can produce larger volumes than when contouring with CT which may be due to resolution effects (14).
PET-CT may also be useful in estimating prognosis. For instance, the presence of metastatic disease on PET-CT has, not surprisingly, been shown to be associated with poorer survival (15). Furthermore, one study showed that patients who had an SUVmax greater than 10 had decreased survival (16). These findings were not replicated in the present study though this may be due to the small sample size and number of survival events. It is important to emphasize that there are many factors which can influence the SUV value such as blood glucose and timing from injection of the FDG to acquisition of the images, so making cross study comparisons is difficult (17).
The current study has limitations. Although it is the largest study to date looking at PET-CT in radiotherapy planning in MPM, the sample size is small which is a perennial problem in rare cancers. Furthermore, on reviewing the size of the GTV outlined by each clinician, it became clear that there was widespread variation in contouring. This degree of subjectivity is difficult to avoid since it is not known whether covering all PET avid disease is necessary for radiotherapy to be effective in terms of reducing pain. It is not known whether treating central disease is necessary or whether radiotherapy should focus on more peripheral disease, looking for instance, for chest wall invasion or nerve root irritation.
The present study demonstrates that PET-CT changes multiple parameters compared to CT alone, including the conformity index, center of gravity distance and contouring (both over and under). PET-CT also resulted in upstaging in a significant percentage of patients and should be considered as a staging investigation prior to any radical treatment.
Furthermore, the incorporation of PET-CT into the radiotherapy planning process alters the location of the target volume in MPM. If PET parameters (such as SUVmax) are useful in target delineation, this may result in improved palliation and pain control. Future studies examining this are awaited with interest.


