1. Background
Today, chronic diseases impose an important burden on society with an increasing trend worldwide. Approximately, 54% of deaths in eastern Mediterranean countries are attributed to cardiovascular diseases (CVDs) (1, 2). They are the main causes of death in the Islamic Republic of Iran (3). Nearly 50% of annual deaths are attributed to CVDs (4). Recently, the age-adjusted mortality rate of CVDs has increased by 20% - 40% (5) and it is estimated that the burden of CVDs is increasing from 2005 to 2025 in Iran (6).
Hypertension (HTN), smoking, and diabetes mellitus (DM) are major modifiable risk factors of CVDs in Asian countries (7). The prevalence rates of hypertension, smoking, obesity, and DM are 21.7%, 15.6%, 24.5%, and 10.5%, respectively, in eastern Mediterranean countries (8). Approximately 80% of women and 78% of men in Iran suffer from at least one CVD risk factor. The prevalence rates of HTN, DM, obesity, high total cholesterol (TC), high triglycerides (TGs), low high-density lipoprotein cholesterol (HDL-C), and smoking are 20.4%, 9.8%, 14.4%, 19.3%, 5.3%, 32%, and 22.3%, respectively, in Iranian urban populations (9).
It is estimated that more than 80% of CVDs, DM (type 2), and stroke cases are preventable using risk factor modification strategies (10). A reduction in TC, smoking, and systolic blood pressure prevalence can decline the CVDs mortality between 42% and 60%. The World Health Organization (WHO) suggests that an effective strategy is to predict the risk of developing CVDs over the next 5 or 10 years to modify the risk factors in high-risk individuals (11). Therefore, the WHO and the International Society of Hypertension (WHO/ISH) developed a specified risk prediction chart according to the important risk factors of CVDs (12).
2. Objectives
The middle-aged population is a high-risk group for developing CVDs and primary prevention interventions in this age group could promote their level of health and prevent early death. Therefore, this study was conducted to evaluate the prevalence of CVD risk factors and the results of CVDs risk assessment in a middle-aged population in Kerman, Iran, in 2017.
3. Methods
This cross-sectional study was carried out on a middle-aged population in Kerman, Iran, in 2017. The sample size was estimated considering the risk factor prevalence of 32% to achieve the maximum sample size (9), a confidence interval of 95%, and a d value of 5%, using the prevalence formula (N = 335).
Considering the design effect of 1.3, the sample size was calculated as 436. Finally, 450 participants were enrolled in the study. Considering the sex ratio in Kerman, an equal sample of men and women was selected. Because the majority of middle-aged people who referred to the healthcare centers of the city were married, only married people were included in the study. People were included in the study using a multi-stage sampling method. The name of all health care centers and their addresses were achieved from the vice-chancellor for the Health of Kerman University of Medical Sciences. Kerman has four municipality districts. Therefore, health care centers were divided according to their addresses. Two health care centers were selected randomly from each municipality district, including one center from the central area and one center from the suburban area. In each health care center, eligible middle-aged people were selected randomly using a random number table. The inclusion criteria were the age of 30 - 59 years and having completed forms in the health care centers.
The ethics code was obtained from the Ethics Committee of Kerman University of Medical Sciences (IR.KMU.REC.1395.485). The investigators described the relevance and the purpose of the survey for health care staff in the selected health care centers. There are specific forms for the middle-aged population in health care centers designed by the Ministry of Health and Medical Education in Iran to assess and manage the risk factors of chronic diseases. The health care forms of eligible participants were evaluated and the required data for this study were extracted and recorded in data collection forms. This form was to gather information about sociodemographic characteristics, lifestyle, anthropometric indices, mental disorders, and physical diseases. Considering the risk factors of CVDs, several data were selected from the health care forms including age (≥ 45 years for men and ≥ 55 years for women), sociodemographic characteristics, assurance status, nutrition status (adherence to the recommended intake of fruits (2 - 4 serves/day) and vegetables (3 - 5 serves/day)), physical activity status (compliance with the WHO recommendation as 150 minutes per week of physical activity with moderate or high intensity), mental health status (Kessler questionnaire score ≥ 10), anthropometric indices (Body Mass Index (BMI) ≥ 25 or waist circumference (WC) ≥ 90 in both genders), history of smoking (current smoker and quitting smoking less than one year ago), and personal history of DM , HTN, and hyperlipidemia (HLP). To achieve a valid and reliable instrument for data collection, the investigators selected completed middle-age population health care forms with less than 10% missing data. If a form had more than 10% missing data, it was replaced by a new health care form that was chosen randomly from among other health care forms. Moreover, in four out of eight selected health care centers, the investigators observed the performance of health care providers who participated in the study to provide careful care.
The WHO/ISH risk prediction chart for 10-year fatal or non-fatal cardiovascular events was used for risk assessment. This chart calculated the risk of occurrence of fatal and non-fatal cardiovascular events for the next 10 years for each person by considering age, smoking habits, systolic blood pressure, level of total cholesterol, gender, and having DM. The risk was classified as < 10% (normal), 10% - 20% (low), 20% - 30% (moderate), 30% - 40% (high), and ≥ 40% (very high) (12). Because the majority of the participants did not have the results of serum cholesterol and prior studies showed the accuracy of the WHO/ISH chart without cholesterol (13), we used the chart without cholesterol. Data about the risk factors were extracted from the forms for each participant and the risk was calculated using the WHO/ISH risk prediction chart by the investigators.
After data gathering, SPSS version 20 was used for data analysis. The prevalence of different risk factors of CVDs was reported. Also, the prevalence of CVD risk classification and the prevalence of some risk factors were reported.
4. Results
Approximately, 43.4% of the participants had an education level of lower than diploma and 47.3% worked outside the home. More than 80% of the participants had basic assurance (Table 1).
| Socio-demographic Characteristicsb | Men (N = 225) | Women (N = 225) | Total (N = 450) |
|---|---|---|---|
| Education level | |||
| Lower than diploma | 63 (43.6) | 95 (44) | 158 (43.4) |
| Diploma or higher | 85 (57.4) | 121 (56) | 206 (56.6) |
| Occupation status | |||
| Working outside the home | 170 (89) | 19 (9.1) | 189 (47.3) |
| Jobless/retired | 21 (11) | - | 21 (5.2) |
| Housewife | - | 190 (90.9) | 190 (47.5) |
| Having basic assurance | 162 (72) | 201 (89.3) | 363 (80.7) |
| Having complementary assurance | 45 (20) | 44 (19.6) | 89 (19.8) |
aValues are expressed as No. (%).
bConsidering missing data.
The distribution of CVD risk factors for participants aged 40 - 60 years is presented in Table 2. Among metabolic risk factors, HTN was the most prevalent risk factor (prevalence: 20.8%, 95% CI: 17.2 - 24.4%). Considering anthropometric risk factors, 42.8% (95% CI: 38.7 - 47.5%) of the participants were overweight and 57.5% (95% CI: 52.9 - 62%) of them had abnormal WC. Among unhealthy lifestyle behaviors, physical inactivity was the most frequent behavior with a 47.7% prevalence (95% CI: 43.2 - 52.5%). All unhealthy lifestyle behaviors were more prevalent in women than in men, except for smoking, adding salt to the food, inadequate vegetable consumption, and a sedentary lifestyle.
| Risk Factors | Men, No. (%) | Women, No. (%) | Total, No. (%) | ||||||
|---|---|---|---|---|---|---|---|---|---|
| 40 - 50 (N = 183) | 50 - 60 (N = 42) | 40 - 60 (N = 225) | 40 - 50 (N = 173) | 50 - 60 (N = 52) | 40 - 60 (N = 225) | 40 - 50 (N = 356) | 50 - 60 (N = 94) | 40 - 60 (N = 450) | |
| Metabolic risk factors | |||||||||
| Hypertension | 11.7 (7.3 - 16.6) | 31 (17.5 - 46) | 15.3 (10.6 - 20.2) | 15.5 (10.2 - 20.6) | 61.5 (48.7 - 73.7) | 26.4 (21.3 - 32.1) | 13.5 (10.1 - 17.2) | 47.9 (37.2 - 57.4) | 20.8 (17.2 - 24.4) |
| Diabetes mellitus | 3.9 (1.2 - 6.9) | 16.7 (5.1 - 27.7) | 6.3 (3.4 - 9.7) | 8.9 (4.6 - 13.6) | 21.2 (10.2 - 33.3) | 11.8 (7.6 - 16.2) | 6.3 (3.7 - 8.9) | 19.1 (10.6 - 27.7) | 9.6 (6.6 - 11.8) |
| Hypercholesterolemia | 2.8 (0.6 - 5.4) | 16.7 (6 - 28.9) | 5.4 (2.4 - 8.4) | 6.5 (3 - 10.5) | 28.8 (17.6 - 41.2) | 11.8 (7.9 - 16.3) | 4.6 (2.6 - 6.9) | 23.4 (16 - 33) | 8.6 (6.1 - 11.5) |
| Anthropometric indices | |||||||||
| Abnormal WC | 45 (37.3 - 52.1) | 73.8 (60 - 87) | 50.5 (43.8 - 57.2) | 58.9 (51.2 - 66.3) | 82.7 (71.4 - 92.9) | 64.5 (58.3 - 71) | 51.7 (46.8 - 56.9) | 78.7 (70.2 - 87.2) | 57.5 (52.9 - 62) |
| BMI | |||||||||
| Thin | 5 (2.2 - 8.6) | 7.1 (0 - 15.4) | 5.4 (2.6 - 8.6) | 2.4 (0.6 - 4.8) | 3.8 (0 - 10.2) | 2.7 (0.8 - 5.2) | 3.7 (1.7 - 5.7) | 5.3 (1.1 - 10.6) | 4.1 (2.5 - 5.9) |
| Normal | 45.6 (38.2 - 53.5) | 26.2 (13.2 - 40) | 41.9 (35.3 - 48.7) | 26.8 (20 - 33.9) | 5.8 (0 - 13) | 21.8 (16.8 - 28) | 36.5 (31.3 - 41.4) | 14.9 (8.5 - 22.3) | 31.9 (27.4 - 36.4) |
| Overweight | 40.6 (33.3 - 47.9) | 50 (35.1 - 65.6) | 42.3 (35.7 - 48.9) | 41.7 (34.1 - 49.2) | 48.1 (34.1 - 61.1) | 43.2 (36.6 - 50) | 41.1 (36.2 - 46.6) | 48.9 (39.4 - 58.5) | 42.8 (38.7 - 47.5) |
| Obese | 8.9 (4.9 - 13.1) | 16.7 (6.4 - 28.9) | 10.4 (6.5 - 14.5) | 29.2 (22.2 - 36.9) | 42.3 (29.4 - 55.5) | 32.3 (25.7 - 38.5) | 18.7 (14.9 - 22.7) | 30.9 (21.3 - 40.4) | 21.3 (17.2 - 24.9) |
| Unhealthy lifestyle | |||||||||
| Smoking | 17.8 (12.2 - 23) | 45.2 (29 - 60.4) | 23 (17.5 - 28.5) | 2.4 (0.5 - 5) | 3.8 (0 - 9.1) | 2.7 (0.5 - 5) | 10.3 (7.2 - 13.5) | 22.3 (13.8 - 30.9) | 12.9 (10 - 16.1) |
| Inadequate PA | 48.3 (40.9 - 55.9) | 40.5 (25.6 - 55.8) | 46.8 (40.5 - 53.3) | 49.4 (41.8 - 57.3) | 46.2 (31.6 - 59.6) | 48.6 (42.1 - 55.7) | 48.9 (43.7 - 54.6) | 43.6 (33 - 53.2) | 47.7 (43.2 - 52.5) |
| Inadequate fruit consumption | 23.9 (17.8 - 30.6) | 35.7 (20.9 - 50) | 26.1 (20.3 - 32) | 29.8 (22.5 - 36.9) | 32.7 (20.4 - 46.8) | 30.5 (24.7 - 36.5) | 26.7 (22.1 - 31.3) | 34 (24.5 - 43.6) | 28.3 (24.2 - 32.6) |
| Inadequate vegetable consumption | 39.4 (32.1 - 46.9) | 66.7 (51.3 - 80.8) | 44.6 (38.4 - 50.9) | 35.1 (28.1 - 42.5) | 42.3 (28.3 - 56.9) | 36.8 (30.6 - 43.1) | 37.4 (32.5 - 42.8) | 53.2 (42.6 - 63.8) | 40.7 (35.8 - 45.9) |
| Saturated fat consumption | 20 (14 - 26.3) | 28.6 (15.2 - 43.6) | 21.6 (16.5 - 27.1) | 23.2 (17.4 - 29.9) | 28.8 (17.3 - 42) | 24.5 (18.8 - 30.6) | 21.6 (17.2 - 25.9) | 28.7 (19.1 - 38.3) | 23.1 (19.2 - 26.9) |
| Adding salt to food | 32.2 (26.1 - 38.9) | 40.5 (25.6 - 54.5) | 33.8 (27.8 - 39.5) | 19.6 (13.9 - 26.3) | 7.7 (1.8 - 15.7) | 16.8 (12.1 - 22.1) | 26.1 (21.8 - 30.7) | 22.3 (13.9 - 30.9) | 25.3 (21.5 - 29.4) |
| Having anxiety or depression | 16.7 (11.5 - 22.2) | 28.6 (14.3 - 44) | 18.9 (13.8 - 24.1) | 34.5 (27.3 - 41) | 30.8 (18 - 43.1) | 33.6 (26.9 - 40.4) | 25.3 (20.7 - 29.9) | 29.8 (21.3 - 39.3) | 26.2 (22.4 - 30.5) |
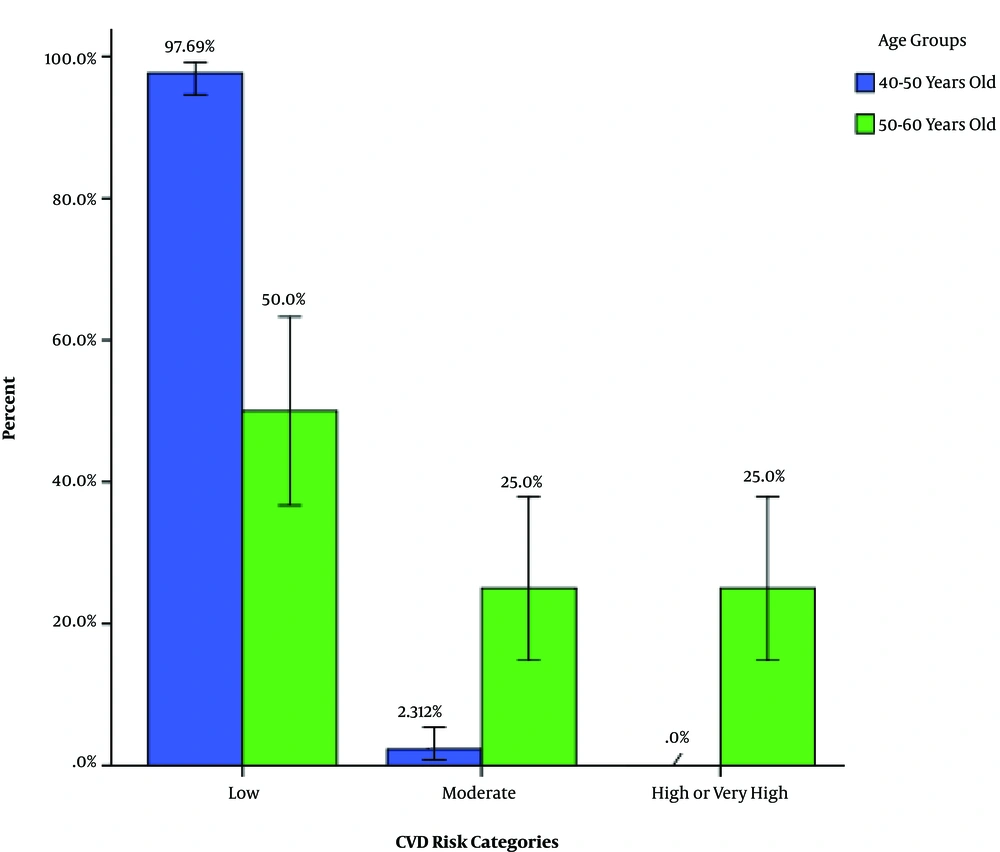
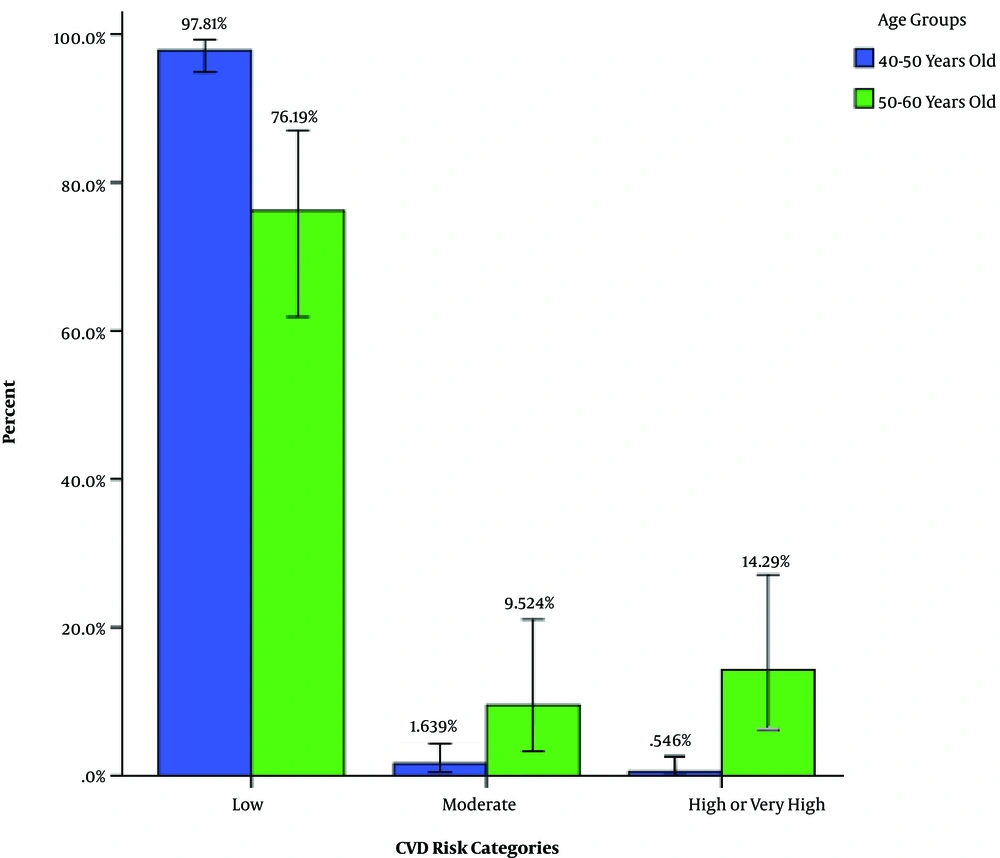
The rates of low, moderate, and high/very high risks of CVD were 90.3% (95% CI: 87.6 - 92.9%), 5.3% (95% CI: 3.6 - 7.3%), and 4.4% (95% CI: 2.7 - 6.4%) in all the participants, respectively. Among 40 - 50-year-old adults, 0.3% (95% CI: 0 - 0.8%) were in the high/very high risk group but 20.2% (95% CI: 12.8 - 28.7%) of 50-60-year-old adults were in the high/very high risk group. The distribution of participants in CVD risk groups according to gender and age is shown in Figures 1 and 2.
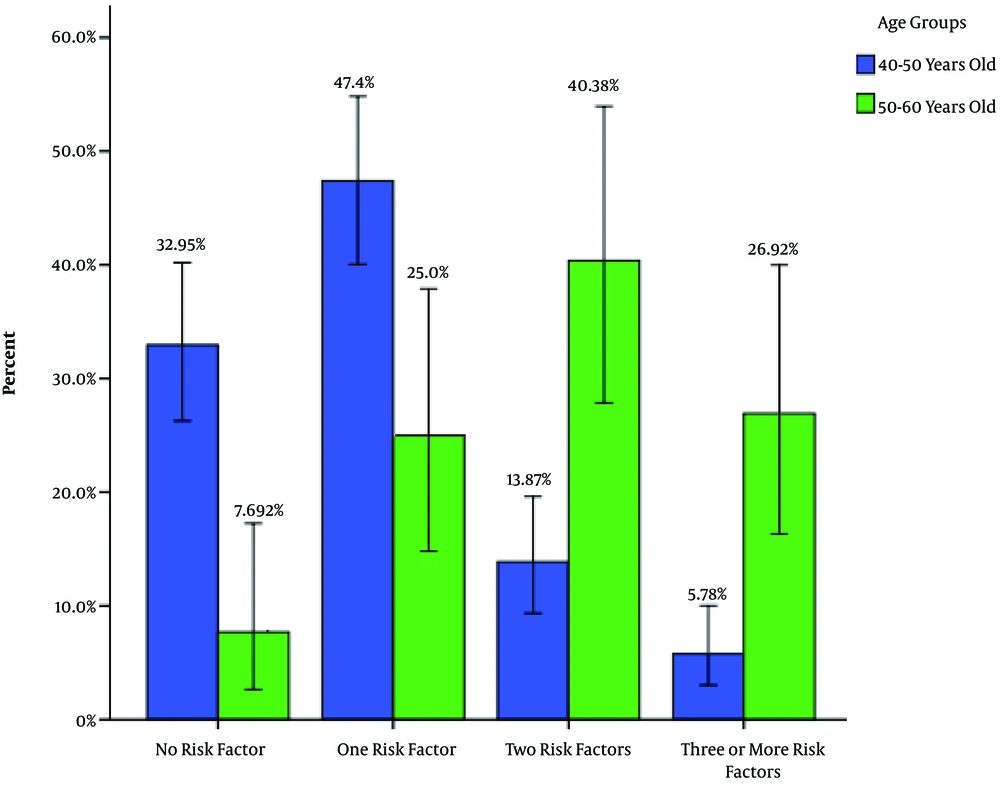
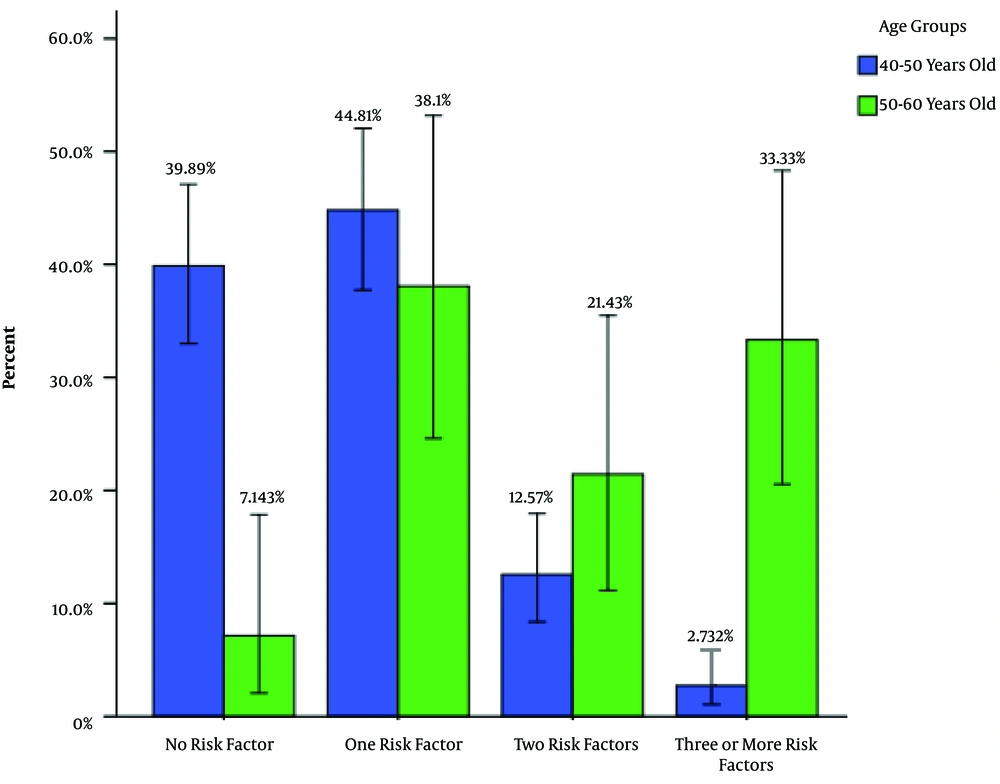
Approximately 30.4% (95% CI: 20.6 - 34.3%) of the participants did not have any risk factor, 42.9% (95% CI: 38.4 - 47.3%) had one risk factor, 17.1% (95% CI: 13.6 - 20.7%) had two risk factors, and 9.6% (95% CI: 6.9 - 12.2%) had three or more risk factors. Among 40 - 50-year-old adults, the rates of having no risk factor and having three or more risk factors were 36.5% (95% CI: 31.2 - 41.9%) and 4.2 (95% CI: 2.2 - 6.5%), respectively. The rates of having no risk factor and having three or more risk factors were 7.4 (95% CI: 2.1 - 12.8%) and 29.8 (95% CI: 20.2 - 28.3%) among 50 - 60-year-old participants. The prevalence rates of CVD risk factors in different gender and age groups are shown in Figures 3 and 4.
5. Discussion
The results of the present study showed that the prevalence rates of overweight and obesity (especially central obesity), inactivity, and consuming inadequate amounts of vegetables are worrying among the middle-aged population of Kerman. Approximately 10% of the participants had moderate or high risks of CVDs in the next 10 years and 69.9% had at least one risk factor of CVDs.
In this study, the prevalence of HTN was 20.8% in the middle-aged population of Kerman. The results of a systematic review in Iran showed that the prevalence rates of HTN were 23% and 50% in the 30 - 55-year-old and more than 50-year-old populations, respectively (14). Another study conducted in Birjand reported the HTN prevalence of 20.1% among the 15 - 70-year-old population (15). Another study from Iran estimated the HTN prevalence of 18.6% in 30 years or older populations (16). The results of the China Health and Retirement Longitudinal Study estimated the HTN prevalence of 29.1% among 45 - 59-year-old individuals (17). In this study, the prevalence of DM was 9.6%. A meta-analysis study concluded that the prevalence of DM is estimated at around 24% in over 40 years of age Iranian people (18). Another study in Kerman in 2011 estimated the DM prevalence of 8.1% in the 15 to 75-year-old population (19). The results of a population-based study in Khorasan in 2008 reported the DM prevalence of 5.5% in the 15 - 64-year-old population (20). It has been proven that HTN and DM have significant associations with age; therefore, different age ranges in various studies could have affected the prevalence of these diseases.
The prevalence of HLP was 8.6% in this study. The results of a large study in 15 to 75-year-old residents of Kerman city estimated the prevalence of hypercholesterolemia as 8.7% (21). The estimated prevalence of hypercholesterolemia was 42% in Iran according to the results of a meta-analysis study (22). All these three risk factors were more frequent in women than in men in this study, similar to other studies (14, 15, 19, 21). There are various prevalence rates for these three CVD risk factors in the national studies. The prevalence rates of these risk factors in this study were equal to or lower than those of other studies. It seems that in spite of the national screening program, there are some patients with DM, HTN, and HLP that are not diagnosed in the health care system. The HLP diagnosis is done through laboratory tests and the country has no screening program for this condition; therefore, it seems that the prevalence of HLP was underestimated in this study.
In this study, nearly 64.1% of the middle-aged population was overweight or obese and the prevalence of BMI of ≥ 25 kg/m2 was more in women than in men. Systematic analysis of a global study showed the increasing trend of obesity in both men and women from 1980 to 2013, with the prevalence of overweight and obesity as 36.9% and 38% in men and women, respectively (23). A systematic review in Iran estimated the range of overweight and obesity prevalence as 27.0% - 38.5% and 12.6% - 25.9% in Iranian adults, respectively (24). The prevalence of abnormal BMI was very high in this study that needs serious intention.
The results of this study estimated that approximately half of the middle-aged population had a sedentary lifestyle and nearly 20% - 40% of the population had unhealthy lifestyle behaviors in terms of fruit and vegetable consumption, saturated fat consumption, and adding salt to the food. Most of these unhealthy behaviors were more prevalent in women than in men. A systematic review of the prevalence of physical activity estimated 30% to 70% of the Iranian population had an inadequate level of physical activity and significant differences existed according to the gender and studied sub-groups (25). A national survey in 2011 estimated the prevalence of inadequate physical activity as 44.8% in the Iranian population. Iranian women were three times more likely to have a sedentary lifestyle than men (26). A population-based study conducted that only 37.9% of the Iranian elderly population consumed adequate fruit and vegetables (27). Another study in Kermanshah estimated the mean frequency of fruit and vegetable consumption as 2.1 times daily in women (28). Comparing the results of this study and those of other studies in Iran shows that the prevalence of inactivity is very high in Kerman and policymakers should pay special attention to this subject.
Approximately 25.3% of the participants in this study reported adding salt to their food. The results of a national report showed that 41.2% of the Iranian population consumes salt at least twice the recommended amount (26). The prevalence of smoking was 12.7% (22.7% in men and 2.7% in women) in this study. The results of a meta-analysis in Iran estimated the prevalence of smoking as 12.8-38.5% in men and 0.6-9.8% in women (27). It seems that the prevalence of smoking in Kerman is similar to other provinces of Iran.
Nearly 4.4% of the participants were categorized into the high-risk group. Only had 30.4% of the participants no CVD risk factor while 17.1% had two risk factors and 9.6% had three or more risk factors. In a study among Indian adults aged above 40 years using the WHO chart for CVD risk assessment, 83% of the participants were categorized into the low-risk group while 6.8% and 10.2% were categorized into the moderate and high-risk groups, respectively (26). Another study estimated that 14.5% of the > 40-year-old population had more than 10% risk of CVD (27). People with more than 10% risk of CVD should be identified and the risk reduction strategies should be conducted in these high-risk people. The risk of CVD increases with age. Because the majority of the participants in this study were aged less than 50, the risk of CVD was low compared to other studies.
In this study, the WHO chart recommended for CVD risk assessment was used as a valid instrument. This study used the secondary data extracted from middle-aged population health care forms to conduct the CVD risk factor assessment; therefore, over/underestimation of risk factors may have occurred in this study. People who referred to the health care centers were not the representatives of the whole middle-aged population; therefore, the results of this study could not be generalized to the community. Further studies considering other risk factors of CVDs and on older age groups are purposed.
5.1. Conclusions
There was a high prevalence of CVD risk factors in the middle-aged population. Policymakers should design effective interventions for modifying the main risk factors. Risk management is the main step to conduct strategies targeting high-risk groups.


