1. Background
Trehalose is a stable, non-reducing disaccharide that is composed of two α-(1-1)-linked glucose molecules, and it has been found to have an important physiological role in a variety of organisms, including archaea, bacteria, fungi, insects, crustaceans, invertebrates, and some plants; but it has not been found in vertebrates (1). In addition, to being the source of carbon energy in these organisms, trehalose protects against stress conditions such as temperature alteration, desiccation, osmotic stress, oxidation, and glucose starvation (2, 3). Trehalose has been found to prevent protein denaturation and suppress denatured protein aggregation (4). Furthermore, to effectively protect against stress conditions, trehalose is needed on both sides of membrane lipid bilayers (5).
One of the most trehalose-dependent organisms is the yeast Saccharomyces cerevisiae, a highly utilized eukaryotic organism as a fundamental research model. In addition, this microorganism is widely used in traditional biotechnological applications, including the production of bread, wine, beer, etc. (6). It has been previously demonstrated that in different strains of the yeast Saccharomyces cerevisiae, there is a significant correlation between trehalose content and stress resistance in various growth conditions, sub-lethal heat treatment, and other stresses (7, 8). Considering the important role of trehalose in organisms like Saccharomyces cerevisiae, it is crucial to apply optimized methods to improve the quality of yeasts and increase their durability by increasing and conserving trehalose content. Despite this, there have been no clear data about effective methods to control Saccharomyces cerevisiae metabolism and increase trehalose content.
2. Objectives
The objective of this study was to investigate the effect of parameters such as temperature, rate of feed, and aeration time on trehalose synthesis in S. cerevisiae.
3. Methods
3.1. Study Design
Minitab 17 was used to design two level-three factors (23) full factorial experiment. This was carried out to observe the effect of fermentation temperature, rate of feed, and aeration time on the synthesis and preservation of trehalose at the end stages of fermentation. Table 1 represents two levels, low (-1) and high (+1), considered for each parameter. Eight experiments were run, and considering three experiment repetitions, the final number of experimental runs added up to 24 experiments.
| Factor | Symbol | Unit | Levels | |
|---|---|---|---|---|
| Low (-1) | High (+1) | |||
| Temperature | A | °C | 33 | 36 |
| Rate of feed | B | m3/h | 1500 | 2100 |
| Aeration time | C | Minute | 10 | 30 |
3.2. Industrial Fermenter
The yeast S. cerevisiae strain was obtained from semi-continuous bioreactors at the Khuzestan yeast production company. These bioreactors have a volume of 170 m3, a height of 10 m, and a diameter of 4.7 m. The aeration system of the aforementioned bioreactors is installed in the bottom of the reservoir and can perform aeration at a rate of 1000 m3/h, causing high gas endurance inside the liquid. In order to achieve optimum mixing and temperature control of the liquid, it is regularly circulated, through a centrifuge pump, at a fixed flow rate of 450 m3/h. Sampling was also performed in the direction of liquid circulation. The cane molasses feeding procedure was also accomplished through a pipe installed at the bottom of the fermenter.
3.3. Yeast Strain and Culture Conditions
The S. cerevisiae SF-06 strain was purchased from the VH company (Berlin, Germany). Yeast cells were cultured in a media composed of cane molasses as a carbon source, urea as a nitrogen source, diammonium phosphate as a phosphate and nitrogen source, magnesium sulfate, and other vitamins. During the fermentation procedure in a bioreactor, the temperature was adjusted between 32 - 36°C through a plate heat exchanger installed in the direction of circulation. The pH was also adjusted by a sensor (Type: 465-35-90-K9; Ingold Electrodes Inc., Urdorf, Switzerland) installed in the direction of circulation and an automatic control system using Na2CO3 and H2SO4.
3.4. Trehalose Level
The trehalose content of cells was measured through a colorimetric method, in which we used trichloroacetic acid (TCA), a corrosive chemical that can break the yeast cell wall. Released trehalose in an acidic milieu was measured using an anthrone reagent. According to the protocol, the amount of color is proportional to the cell's trehalose content.
3.5. Trehalose Activity and Shelf Life
The gas production ability of the yeast dough can be investigated by measuring the level of CO2 gas produced by the determined amount of yeast in a certain period. Shelf life measurement was performed after incubating dry yeast in the oven at 64°C for 16 h.
4. Results
4.1. Experiment Outcome Based on a Two-level Full Factorial Design
The results of the two-level full factorial design are shown in Table 2. Data from this table show each run with different levels of parameters. These findings indicate that the combination of temperature at 36°C, rate of feed of 2100 L/h, and aeration time for 30 min can lead to an optimum condition in which the most trehalose synthesis and CO2 gas production can be achieved.
| Run Order | Blocks | Temperature | Rate of Feed | Aeration Time | Trehalose | Shelf Life |
|---|---|---|---|---|---|---|
| 1 | 1 | 33 | 2100 | 30 | 15.9 | 1250 |
| 2 | 1 | 36 | 1500 | 10 | 15.8 | 1205 |
| 3 | 1 | 33 | 2100 | 30 | 16 | 1265 |
| 4 | 1 | 36 | 1500 | 10 | 15.7 | 1200 |
| 5 | 1 | 36 | 1500 | 10 | 15.9 | 1210 |
| 6 | 1 | 33 | 2100 | 30 | 16.1 | 1240 |
| 7 | 3 | 36 | 1500 | 30 | 16.1 | 1130 |
| 8 | 3 | 36 | 1500 | 30 | 16 | 1125 |
| 9 | 3 | 33 | 2100 | 10 | 15.4 | 1150 |
| 10 | 3 | 33 | 2100 | 10 | 15.5 | 1175 |
| 11 | 3 | 33 | 2100 | 10 | 15.3 | 1200 |
| 12 | 3 | 36 | 1500 | 30 | 16 | 1145 |
| 13 | 4 | 33 | 1500 | 10 | 16.3 | 1255 |
| 14 | 4 | 36 | 2100 | 30 | 16.7 | 1300 |
| 15 | 4 | 33 | 1500 | 10 | 16.2 | 1275 |
| 16 | 4 | 33 | 1500 | 10 | 16.1 | 1235 |
| 17 | 4 | 36 | 2100 | 30 | 16.6 | 1260 |
| 18 | 4 | 36 | 2100 | 30 | 16.9 | 1250 |
| 19 | 2 | 33 | 1500 | 30 | 15.5 | 1200 |
| 20 | 2 | 36 | 2100 | 10 | 16.2 | 1125 |
| 21 | 2 | 36 | 2100 | 10 | 16.1 | 1260 |
| 22 | 2 | 36 | 2100 | 10 | 16 | 1240 |
| 23 | 2 | 33 | 1500 | 30 | 15.4 | 1190 |
| 24 | 2 | 33 | 1500 | 30 | 15.5 | 1175 |
4.2. Variance Analysis
Table 3 shows the variance analysis of the effective parameters on trehalose production in S. cerevisiae. The confidence limit for the investigation of the statistical effects of variables has been considered to be 95%. As it appears from Table 3, all P values reveal that investigated parameters have statistics.
| Source of Data | Sum of Squares | Degree of Freedom (DF) | Mean Square | F Value | P Value | Comment |
|---|---|---|---|---|---|---|
| Model | 3.7933 | 7 | 0.54190 | 54.19 | 0.0001 | Significant |
| Blocks | 2.1033 | 3 | 0.70111 | 70.11 | 0.0001 | Significant |
| Linear | 1.3633 | 3 | 0.45444 | 45.44 | 0.0001 | Significant |
| A | 0.9600 | 1 | 0.96000 | 96.00 | 0.0001 | Significant |
| B | 0.2017 | 1 | 0.20167 | 20.17 | 0.0001 | Significant |
| C | 0.2017 | 1 | 0.20167 | 20.17 | 0.0001 | Significant |
| 3-way interaction | ||||||
| ABC | 0.3267 | 1 | 0.32667 | 32.67 | 0.0001 | Significant |
| Error | 0.1600 | 16 | 0.01000 | |||
| Total | 3.9533 | 23 |
4.3. Regression Analysis
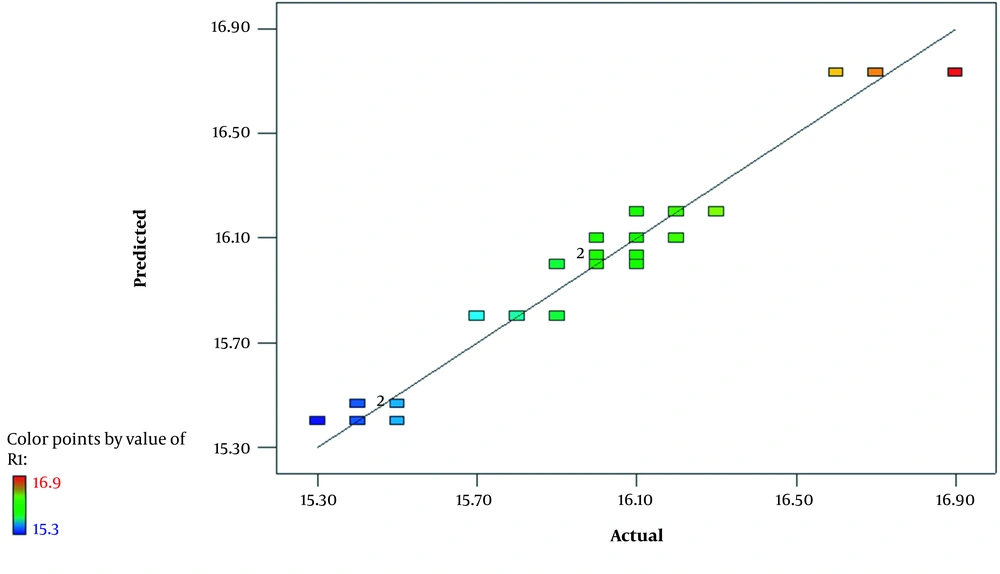
Regression analysis was performed to obtain a proper molly significant effect for experimental data. The outcome of this analysis is highlighted in Table 4. The correlation coefficient test is one of the most reliable tests, enabling investigators to examine the intended model and see if there is a correlation between experimental and predicted values. Here, we found that the correlation coefficient of trehalose is 95.95% with a small standard deviation of 0.1. According to these results, it seems that all values are close to the predicted ones, and thus, the obtained regression equation in this study can be used in the prediction of trehalose synthesis with acceptable accuracy. The result showed a positive correlation between predicted R-sq and adjusted R-sq. The regression analysis revealed that the relationship between trehalose and three parameters of temperature, rate of feed, and aeration time is in accordance with a second-degree equation which is as follows:
Trehalose = 15.9667 + 0.2000 A + 0.0917 B + 0.0917 C - 0.1167 A*B*C
| Term | Effect | Coef | SE Coef | T | P |
|---|---|---|---|---|---|
| Constant | 15.9667 | 0.0204 | 782.20 | 0.000 | |
| Blocks | |||||
| 1 | -0.0667 | 0.0354 | -1.89 | 0.078 | |
| 2 | -0.1833 | 0.0354 | -5.19 | 0.000 | |
| 3 | -0.2500 | 0.0354 | -7.07 | 0.000 | |
| A | 0.4000 | 0.2000 | 0.0204 | 9.80 | 0.000 |
| B | 0.1833 | 0.0917 | 0.0204 | 4.49 | 0.000 |
| C | 0.1833 | 0.0917 | 0.0204 | 4.49 | 0.000 |
| ABC | -0.2333 | -0.1167 | 0.0204 | -5.72 | 0.000 |
a S = 0.1; R-Sq = 95.95%; R-Sq(adj) = 94.18%; R-Sq(pred) = 90.89%.
4.4. The Effect of Study Parameters on Ttrehalose Synthesis
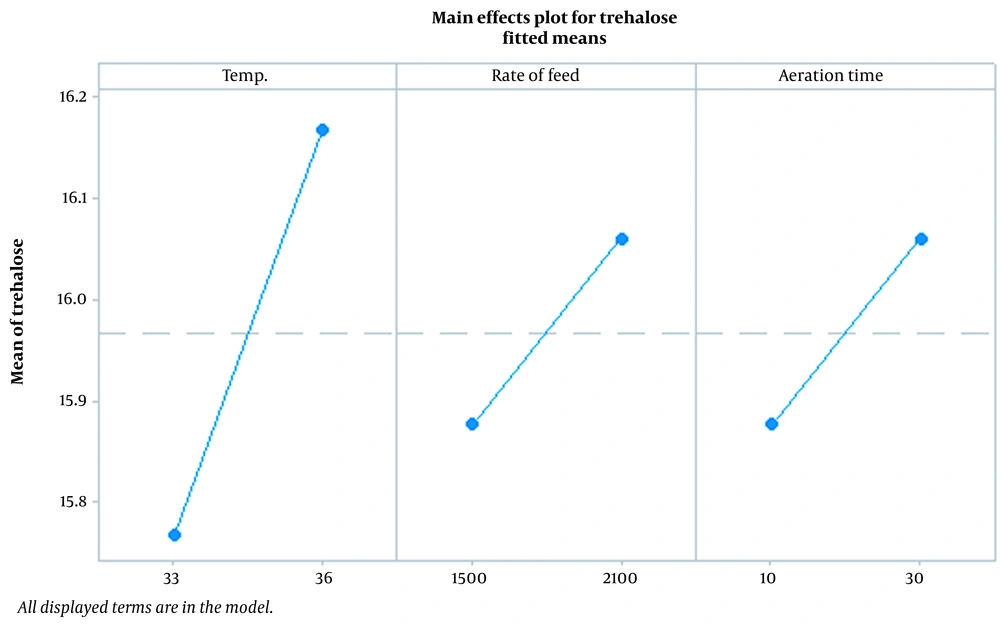
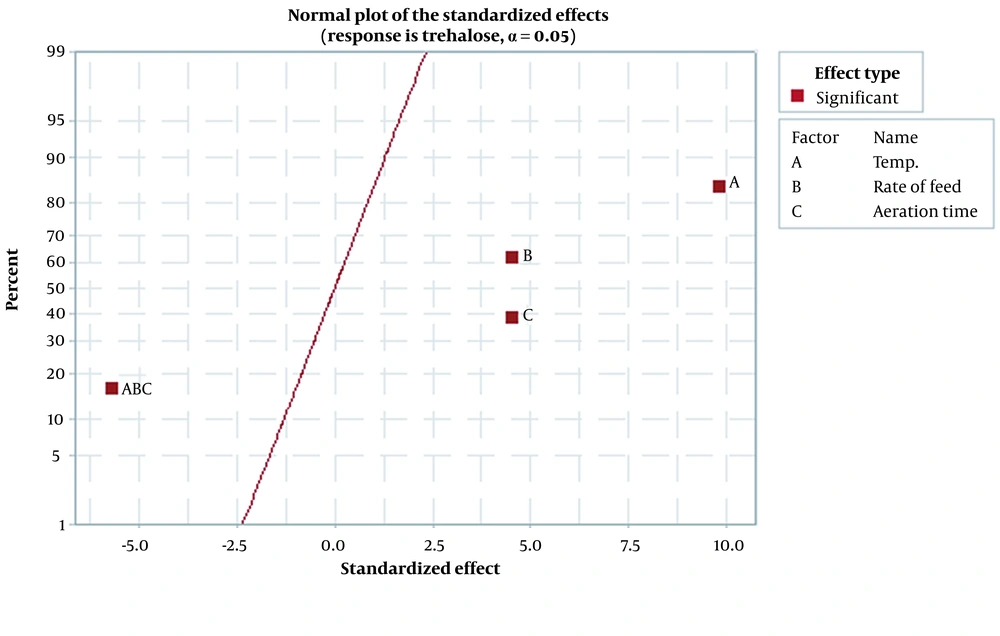
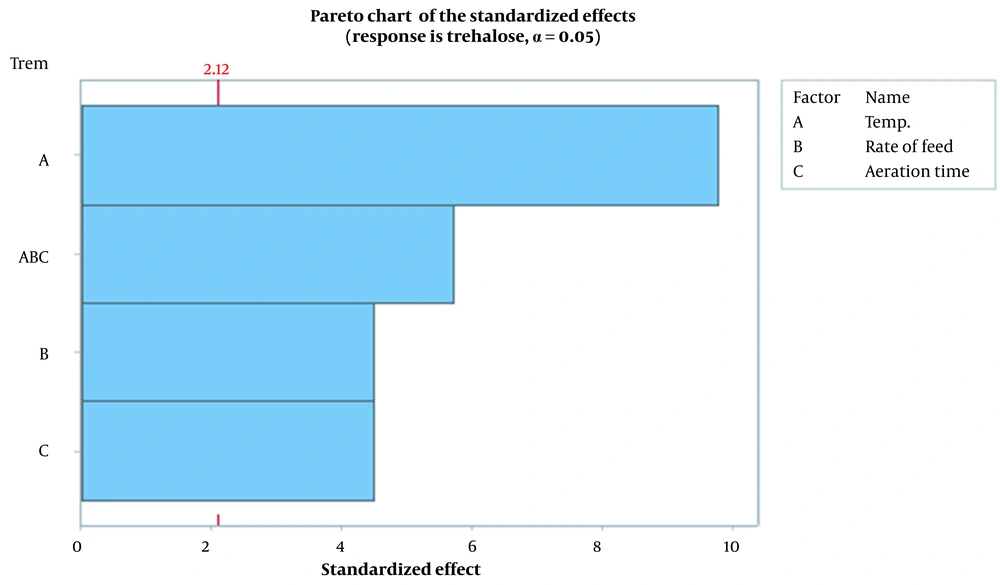
Figure 1 demonstrates the effect of temperature, rate of feed, and aeration time parameters on trehalose synthesis. Findings showed that temperature is the most effective parameter, and the optimum temperature for trehalose synthesis at the last stages of fermentation was found to be 36°C. According to Figure 1, as temperature increases, the feed and aeration time rate increase concomitantly. Figures 2 and 3, which confirm each other, represent the statistically significant effect of all studied parameters and their interaction on the response. In the normal plot, there is a clear trend of temperature surge, representing a remarkable effect of temperature on trehalose synthesis compared to other parameters. This trend is also confirmed in Figure 3, in which temperature is the most effective parameter in trehalose synthesis.
4.5. Parameters Interaction
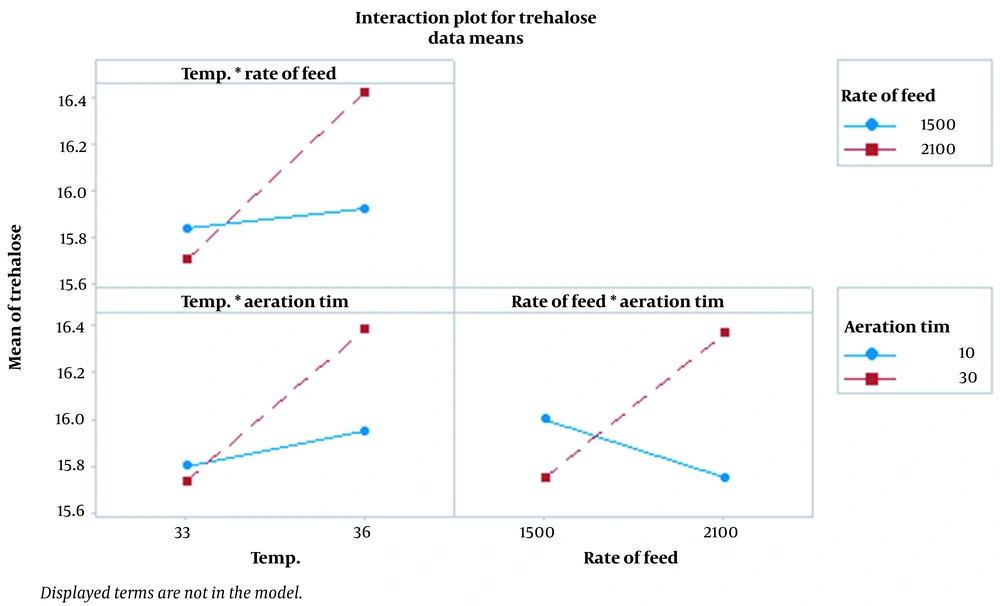
We investigated the interaction between temperature, rate of feed, and aeration time. Figure 4 shows that the more intersections of lines, the greater the interaction between the studied parameters, indicating statistical significance. The adjusted temperature at 36°C, the feed rate of 2100 L/h in the last hour of fermentation, and the aeration time of 30 minutes following molasses feeding cessation in the last hour of fermentation resulted in increased cell tension and more trehalose conservation. Simultaneously, increased trehalose content of cells led to increased CO2 gas production.
4.6. Assessment of the Model’s Quality
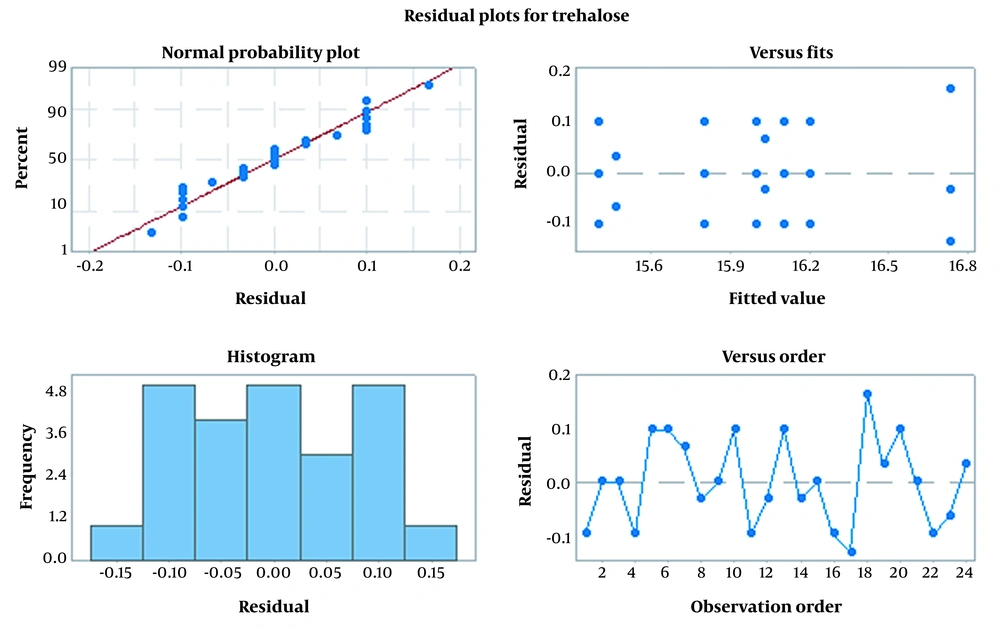
The residual plot chart was used to evaluate the quality of the regression model. As shown in Figure 5, in the normal probability plot, dot dispersion around the red line shows that the experiments had appropriate dispersion and there was no run-out of experiment limitations. The histogram chart is representative of a study population which is from a normal population. Although residual dispersion is random and doesn’t follow a special procedure, versus fit and versus order charts show fixed variance and time-independent data, respectively. Furthermore, Figure 6 demonstrates the infallible experiment and appropriateness of the study model.
5. Discussion
Trehalose production is widely used by organisms, such as S. cerevisiae, to gain tolerance to adverse and stressful conditions (9). Intriguingly, in the case of yeast, there is a bunch of information about the regulation of trehalose metabolism and production (10-12). However, there is no available data about the optimum and effective parameters to increase trehalose synthesis and the ensuing qualified commercial yeasts in the industry. The current study found that temperature, rate of feed, and aeration time can be effective parameters for inducing trehalose synthesis and CO2 gas production in S. cerevisiae. Specifically, the temperature had the most remarkable effect on trehalose synthesis. These findings further support the idea of Pan et al., who reported trehalose synthesis stimulation after a time slot of half an hour of heat stress in yeast cells (13). From these findings, it can be inferred that temperature shock is a stimulator of trehalose production in yeasts, which can be considered a heat stress response marker in S. cerevisiae and other yeasts. Several studies have demonstrated the correlation of trehalose content with heat stress tolerance in yeast cells (14, 15). This feature indicates that yeast cells activate their defense system, such as trehalose production, in response to a mild temperature increase (10). It is encouraging to compare the current study's findings with those of Magalhães et al., who found that none of the studied yeast strains have been induced to produce trehalose at 28°C, implying the need for the more increased temperature to stimulate trehalose production (5). Another important finding of this study was the significant effect of a 30 min aeration time on the trehalose synthesis. This was even more remarkable when combined with the 36°C temperature and rate of feed of 2100 L/h. From these results, it can be concluded that in the time of applying these factors in combination, they can have synergetic effects on each other and promote the procedure of trehalose production in heat-stress exposed yeast. In other words, surprisingly, using each parameter at its optimum level had no capability of inducing yeast defense system of trehalose synthesis. This result reveals that several conditions are required to induce trehalose synthesis in yeasts.
5.1. Conclusions
Our findings emphasize the importance of temperature, rate of feed, and aeration time parameters in the inducing stress and defense system of S. cerevisiae. Our results suggest applying these parameters on an industrial scale and producing the most stable and durable yeast in bread, wine, beer, and other related industries. However, there is a need to investigate the effect of the studied parameters on the molecular pathways of trehalose synthesis. In this study, we investigated the signaling pathways and the enzymatic activation of the trehalose synthesis process in S. cerevisiae under the effects of temperature, rate of feed, and aeration time.

