1. Background
Cerebellum is a brain area that is critical for the fine adjustment of motor output and for the formation of several types of motor memories (1). Purkinje cells present a unique cellular profile in the cerebellum and are the only output cells of the cerebellar cortex. Interestingly, Purkinje cells are highly susceptible to a variety of abnormal conditions (2). In human, Purkinje cells are affected in a variety of diseases ranging from malnutrition and toxic exposure (i. e. alcohol, lithium), to autoimmune diseases and genetic mutation of amino acids. Regarding the importance of dietary protein, many studies have assessed the effects of protein malnutrition on different parts of the brain (3). Impairment of CNS following protein deficiency has been extensively studied and this deprivation leads to deleterious effects upon cerebral structures (4).
Protein deprivation can cause many direct deleterious effects on the brain such as loss of brain weight (5-7), alteration of hippocampal formation (8), impairment of neurotransmitter systems (9, 10), changes in protein phosphorylation (11) and deficits in cognitive functions (12). Experimental protein malnutrition was induced in groups of young juvenile squirrel monkeys by feeding them ad libitum diets very low in protein content, whereas a diet containing 25% protein content was fed to the control animals. Detailed cytochemical studies have clearly shown the sensitivity of nervous system to dietary abuse. In fact, motor neurons of spinal cord and Purkinje cells of the cerebellum are very sensitive to protein deficiency. Gallocyanin stained preparations from the malnourished animals show significant decrease in the amount of RNA in the Purkinje cells of cerebellum and anterior horn cells of the spinal cord (13). Development of granular cell layer and the Purkinje cells is specifically prone to the effects of protein malnutrition potentially due to a low-protein diet of the mother (14). Additionally, protein malnutrition increases oxidative damage to lipids and proteins in the cerebellum and cerebral cortex (15).
2. Objectives
The aim of this study was to investigate the effects of low-protein diet on the frequency, diameter and distance between Purkinje cells of the cerebellum.
3. Materials and Methods
Experiments were performed on 22 male Wistar rats (age: two weeks, weight: 104 ± 3 g). They were simply randomized into two groups: the control group received a normal diet with 17.5% protein for 10 months, while the case group had a low-protein diet with 8% protein (16). Both diets had the same energy content (1382 kg/100 g dry food). The rats were kept in a 12 hours light/dark cycle. All of the experimental procedures were conducted based on the Animal Ethics Committee of Tehran University of Medical Sciences.
After 10 months, animals were anesthetized with intraperitoneal injection of Ketamin (40 mg/kg) and Xylazin (5 mg/kg). The rats were perfused by transcardial perfusion of 500 ml fixative solution (Glutaraldehyde 1.25% and paraformaldehyde 1% in 0.2 mol buffer phosphate at pH = 7.4) followed by 10% sucrose buffer. The brains were removed and the cerebella were divided into two segments. The first segment was fixed by immersion in sucrose buffer 10% mixed with 10% glycerol for 12 - 14 hours at 4°C. Cerebellar samples were cut by cryostat into serial coronal sections of 40 µm (Leica CM1850). Sections were then mounted on gelatinized slides and counterstained with Hematoxylin & Eosin (H & E) and neutral red. The sections were observed by light microscope coupled to camera (BX51, Olympus, Japan) and images were taken under objective lens (X 400, Olympus, Japan). For each animal, the frequency, mean diameter of Purkinje cells and distances between them were measured by Optika software (Optika, Italy, 2009). Since only 1% of Purkinje cells in the mature brain have more than one nucleolus, we used nucleolus as an indicator for cells number. To measure mean diameter of Purkinje cells, we used Purkinje cells with visible nucleolus and measured three diameters that passed directly through the nucleolus. This method was used for the measurement of one hundred Purkinje cells selected randomly in many fields. The second segment of cerebellum was kept in Glutaraldehyde 2.5%. Serial coronal sections of 500 nm (semithin section) were made by ultra microtome. Then sections were counterstained with Toluidine Blue and the size and diameter of Purkinje cells were evaluated by Optika software. All calculations were performed with SPSS Version 11.0 for Windows. The statistical analysis was performed using non-parametric analysis (Mann-Whitney’s U test). Data were expressed as mean ± SD. P value of < 0.05 was considered to be significant.
4. Results
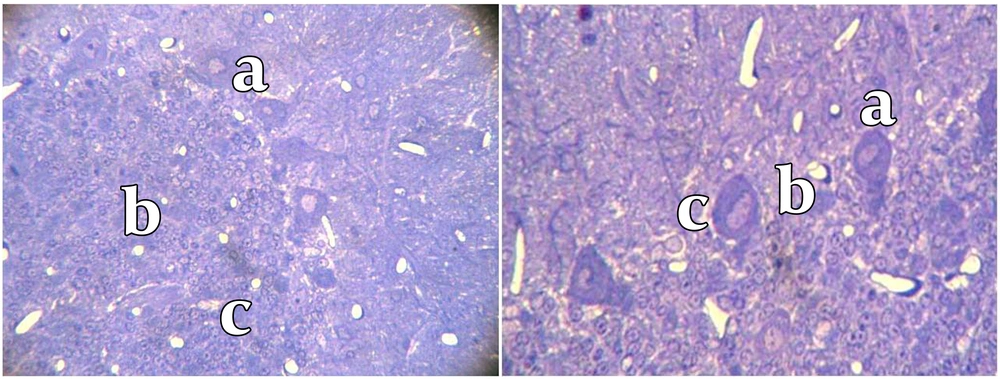
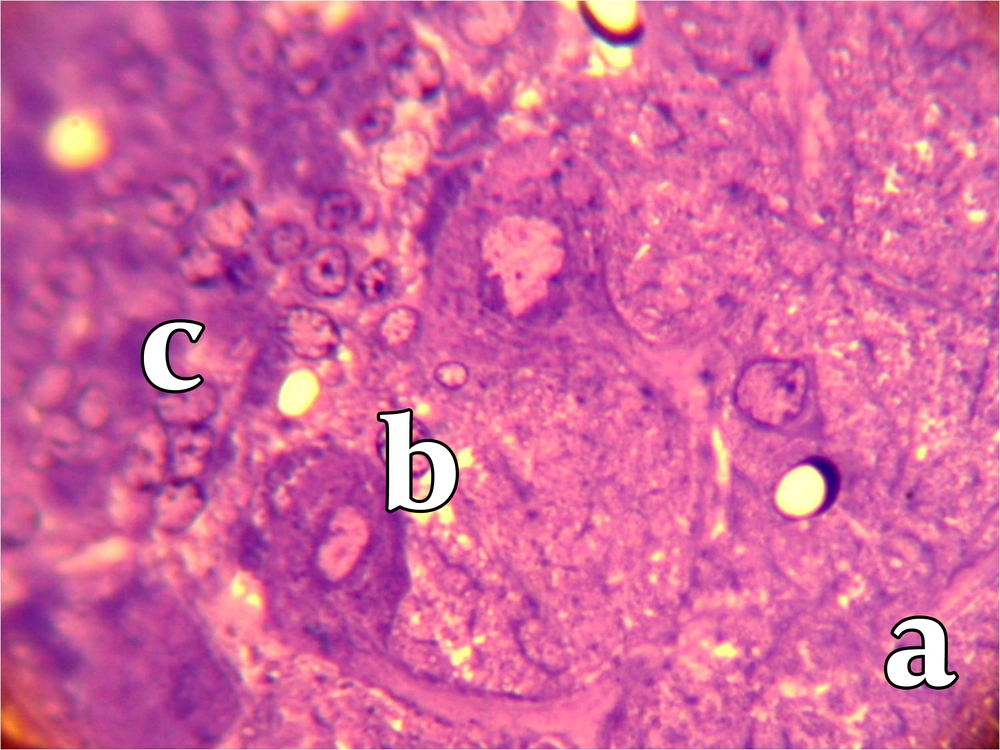
To analyze the overall cerebellum structure, we measured the thickness of molecular and granular layers and found that the thickness of molecular layer was 368.1 ± 53 µm in control group compared to 351.9 ± 81 µm in the low-protein diet group (P < 0.05). The thickness of granular layer of control group was 571.4 ± 20 µm, while the thickness of this layer was 449.2 ± 98 µm in low-protein diet group (P < 0.05). The number of Purkinje cells significantly decreased in the case group compared to the control group after 10 months (8.3 ± 7 versus 14.2 ± 4, P < 0.05). Furthermore, we found that the distances between Purkinje cells in the control group (363.9 ± 12 µm) was significantly lower than the same value in low-protein group (472.1 ± 27 µm) (P < 0.05). Moreover, we found that the diameter of Purkinje cells in the low-protein group (179.5 ± 11 µm) was significantly more compared to the control group (151 ± 8) (Table 1) (Figures 1, 2).
| Control Group, mean ± SD | Low-Protein Group, mean ± SD | |
|---|---|---|
| No. of Purkinje Cells | 14.2 ± 4 | 8.3 ± 7 a |
| Distances Between Purkinje Cells, µm | 363.9 ± 12 | 472.1 ± 27 a |
| Diameter of Purkinje Cells, µm | 151 ± 8 | 179.5 ± 11 a |
| Thickness of Molecular Layer, µm | 368.1 ± 53 | 351.9 ± 81 |
| Thickness of Granular Layer, µm | 571.4 ± 20 | 449.2 ± 98 |
a Significant
5. Discussion
Our study showed that the number of Purkinje cells significantly decreased in low-protein group compared to the control group. Also, the diameter of Purkinje cells and distances between them significantly increased in low-protein group compared to the control group. Our findings confirm previous studies indicating the effect of protein malnutrition in different parts of the brain (3, 5, 8, 9). Manocha and Olkowski reported an increase in the number of dark cells with large amounts of ribonucleoprotein complex in the Purkinje cells layer of the extremely malnourished animals sacrificed after 15 weeks on a low-protein diet, which may reflect either an abnormal metabolic process or an interruption in the axonal transport of RNA complex (17). Fish et al. reported that malnutrition markedly curtailed the increase in DNA content (cell number) resulting in an early sustained reduction of DNA content in the cerebellum (18). Andrade and Paulo demonstrated that protein deprivation in adult rats causes reduction in the diameter of the subiculum and the total number of its neurons (19). Garcia-Ruiz confirmed previous findings indicating that the number of cells is decreased in amygdala of protein malnourished rats. It is also possible that the reduction of axoplasmic transfer rate might be due to the protein malnutrition. These changes can alter synaptic connection and/or conduction between neurons (20).
In our survey, it seems that the mechanisms which reduce the number of Purkinje cells are cell death due to axonal transport difficulties and a reduction of DNA content which is compatible with the previous findings. In our study, the thickness of granular layer of control group was more than low-protein group, but this difference was not significant. This is consistent with the reports from Desai, et al. and Andrade, et al. which showed that protein malnutrition results in a number of effects in the hippocampal formation, such as gabaergic inter-neurons and dentate granule cells (19, 21, 22). These results indicate that among hippocampal neurons, dentate granule cells are selectively vulnerable to food restriction (22). Garcia-Ruiz, et al. also found that low-protein diet increases the genesis of cells in the anterior dentate granule cell layer (20). This finding is also consistent with the study of Mokler and Granados-Rojas et al. that found protein malnutrition reduces the number of synapses in some cortical areas and changes the behavior in animals (23).
Protein malnutrition in rats reduces the proliferation of neuronal and glial cells (3). Results of another study by Soto-Moyano et al. supported the idea that mild prenatal protein malnutrition (8% protein) deleteriously affects the cortical neuronal density (24). This finding is also consistent with the results of Mokler, et al. that demonstrated this type of diet can stop initial Purkinje cells growth during intrauterine life (23), while it is inconsistent with the report from Azzolin et al. indicating that malnutrition had no effect on cerebellar protein concentration (25).
In conclusion, neuronal function is mainly dependent on normal conditions and any changes in environmental conditions can adversely affect the function and morphology of neurons leading to behavioral dysfunction. Considering that our results showed adverse effects of malnutrition on Purkinje cells of the cerebellum, we suggest that the effect of protein malnutrition on activity and function of Purkinje cells of cerebellum and also motor behavior dysfunction of animal can be studied in future.

