1. Background
Anthropometry is the science of measurement of body characteristics such as reach, body segment length, circumferences, widths and heights. This information can be used to improve the design of tools, equipment, workstations and clothes. Appropriate use of anthropometry in designing may improve well-being, health, comfort, and safety (1).
When there is a suitable database to determine the standard dimensions and design of adjustable instruments, a lot of musculoskeletal disorders and work-related injuries will be prevented. The proper ergonomic design of a workplace increases the employee’s job satisfaction and reduces the accident rates. Successful commercial enterprises have combined proper designing along with application of proper ergonomics in their programs as a useful strategy to achieve the maximum economic benefit and quality (2). Anthropometric factors are age, sex, race, nutrition, exercise and occupation (3).
There exist several anthropometry databases such as the anthropometries of: hand in Jordanian population (4), elderly in Australia (5), Taiwanese women (6), Thai population (7),Portuguese workers (8), Turkish population (9), Bahraini school children (10), north eastern Indian female farm workers (11), and Sri Lankan university students (12).
Available anthropometric data of the Iranian population are very limited. Mououdi et al. and Jonidy studied the static anthropometric characteristics of students in Tehran, but information from other regions of Iran is not available (13, 14). Since 2008, however, there has been no publication of anthropometric data concerning the Iranian population. Our study updates the anthropometric data of Iranian people in which the data is collected from regions other than Tehran.
2. Objectives
The main objective of this study was to measure some anthropometric variables conducted on males and females in Hormozgan province (Bandar Abbas city), Iran. The second objective was to determine reliable and accurate structural anthropometric measurements for male and female population to be used in the product design process.
3. Materials and Methods
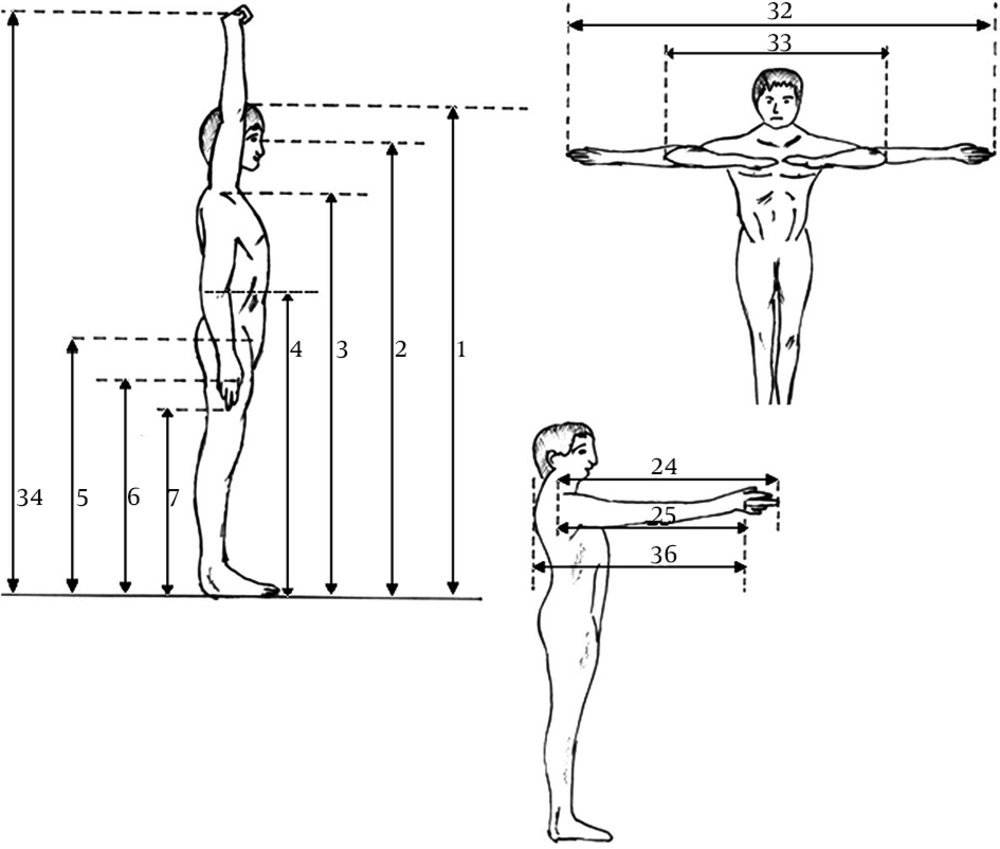
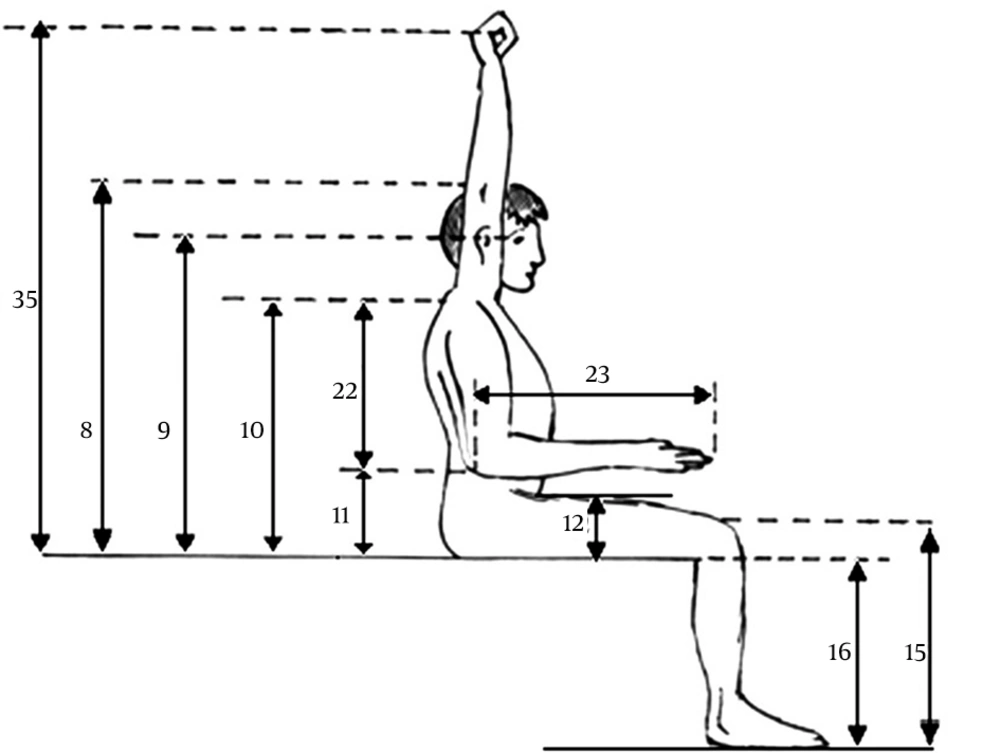
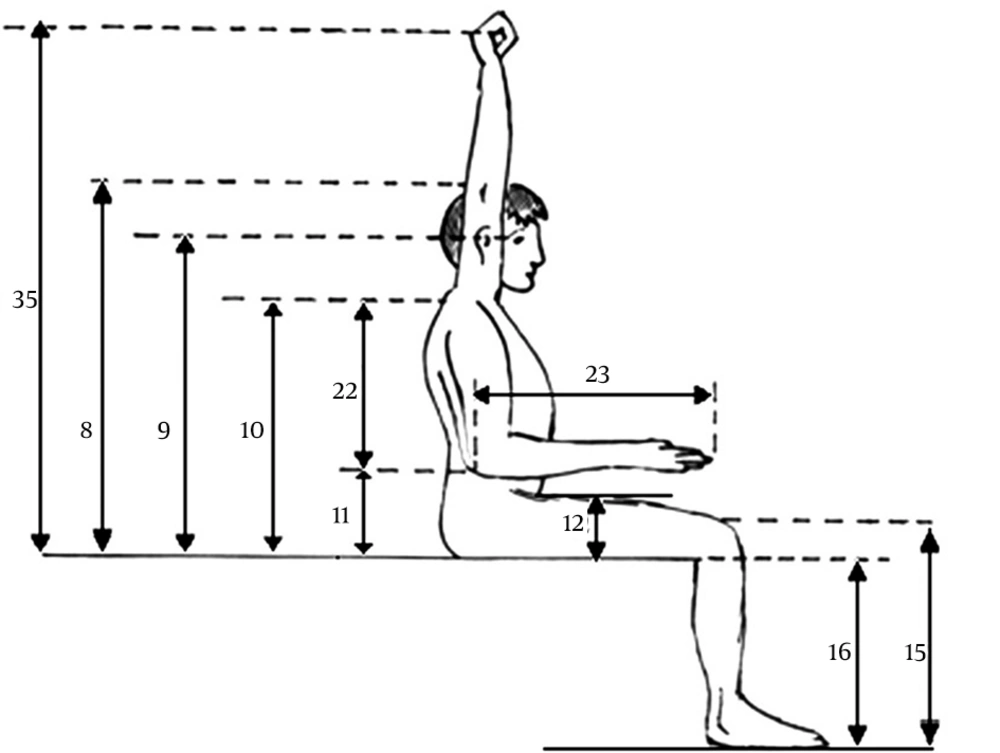
In this descriptive and analytical study, we used a static and direct method. Thirty seven static body dimensions were measured. We used cluster sampling method to select from the employees working in hospitals of Hormozgan University of Medical Sciences. Measurements included height, width, depth, circumstance, reach and length. Pheasant and Haslegrave method was used to measure the dimensions (15). Body landmarks are shown in Figures 1 to 3 (2).
Body Measurements in the Standing Position (2)
Body Measurements in the Sitting Position (2)
Body Measurements in the Standing/Sitting Position (2)
The measurement method was based on the direct method using low-cost and accurate equipments. These equipments included goniometer, tape, metal meter, caliper and spreading caliper, and graded papers installed on the wall at a 90 degree angle to measure the depth, width, circumference and length. A swivel chair with adjustable height and a digital scale were also used (10). The anthropometric chamber was calibrated at each installation. The used balanced weight was calibrated every day and after a few samplings, was set again. In addition to collecting data on anthropometry, a questionnaire regarding occupational and nonoccupational histories and harmful factors of the work environment was given to the participants. A measurement protocol was provided for those who helped in this research project.
The procedure, body landmark recognition, and anatomical positioning were taught in a training program. The Labeling landmarks before taking the measurements were labeled, which are explained below (16). For instance, the upper arm length was measured from the acromial process to the tip of the elbow. Each part of a person was measured twice. The anthropometric definitions used in this study are summarized below (2):
1. Stature: The measured height, wearing working shoes.
2. Eye height: vertical distance from the level of eye to the floor when the person stands.
3. Shoulder height: vertical distance from the level of acromion to the floor.
4. Elbow height (flexed arm): vertical distance from the elbow of flexed arm to the floor.
5. Hip height: vertical distance from the highest iliac crest to the floor.
6. Knuckle height: vertical distance from the buttock fold to the floor.
7. Fingertip height: vertical distance from the tip of the longest finger to the floor.
8. Sitting height: vertical distance from the superior level of the head to the seat surface.
9. Sitting eye height: vertical distance from the level of eye to the seat surface.
10 .Sitting shoulder height: sitting vertical distance from the level of acromion to the floor.
11. Sitting elbow height: vertical distance from the inferior side of the elbow to the seat surface with flexed arm.
12. Thigh thickness: holding the zero end of the tape in the examiner's right hand, placing the measuring tape around the mid-thigh.
13. Buttock knee length: sitting horizontal distance from the posterior aspect of the buttock to the anterior aspect of the kneecap.
14 Buttock to popliteal length: sitting horizontal distance from the posterior aspect of the buttock to the popliteal area.
15. Knee height: vertical distance from the level of the patella to the floor.
16. Popliteal height: sitting vertical distance from the popliteal area to the floor with bent knees and ankles at right angles.
17. Shoulder breadth (bi-deltoid): horizontal distance between the right and left deltoid muscles.
18. Shoulder breadth (bi-acromial): horizontal distance between the right and left biacromial process.
19. Hip breadth: maximum horizontal distance across the hip.
20. Chest depth: maximum horizontal distance across chest from the Louis angle of sternum to the thoracic vertebrae.
21. Abdominal depth: depth of the abdomen measured at the level of belly button.
22. Shoulder elbow length: vertical distance from the acromion to the bottom of elbow.
23. Elbow fingertip length: the distance from the posterior part of elbow to the tip of the longest finger with the elbow flexed at a 90 degree angle.
24. Upper limb length: the length from the acromion process to the fingertips.
25. Shoulder grip length: the length from the acromion process to the metacarpophalangeal joints (MP).
26. Head length: vertical distance from the superior to the inferior aspect of the skull.
27. Head breadth: horizontal distance between the right and left zaygomatic arch.
28. Hand length: maximum perpendicular hand length.
29. Hand breadth: horizontal distance between right and left metacarpophalangeal joints.
30. Food length: distance between the two points of heel and toe.
31. Food breath: horizontal distance between the right and left points of the metacarpophalangeal joints.
32. Span: distance between two points of the tip of fingers when the upper limb is in 90 degree abduction.
33. Elbow span: distance between the elbow joints when the joint is in flexion position.
34. Vertical grip reach (standing): extending arm to the maximum vertical reach while standing.
35. Vertical grip reach (sitting): extending arm to the maximum vertical reach while sitting.
36. Forward grip reach: extending arm to the maximum horizontal reach while sitting.
37. Body weight: weighed in kilograms, using a digital weight scale.
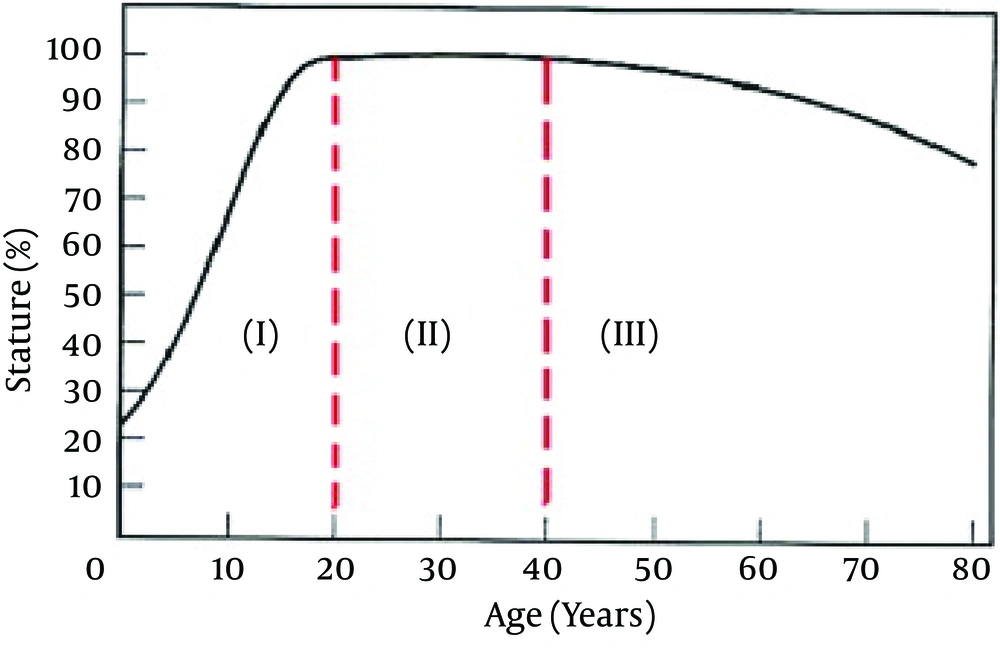
Kroemer and colleagues categorized the physical status of the community into three groups. Changes in the stature are divided into three groups
(I) Growing period: before 20;
(II) Stable period: 21 - 40;
(III) Declining period: After 41 (Figure 4) (1).
The samples in this study were 20 - 60 years and thus were at stages II and III (Figure 4). After collecting the anthropometric data, they were encoded using Microsoft Word and SPSS 13. The statistical analyses were descriptive and inferential statistics. Descriptive statistics were summarized in terms of mean, standard deviation, and percentile value. Normality of data distribution was examined and outliers were omitted. Statistical parameters were computed from the male and female population as well as the total population using SPSS software.
4. Results
Most office employees are above 20 and the retirement age in Iran is about 55 - 60, hence the participants' age range was chosen as 20 - 60 with an average of 38. Samples were randomly chosen. From the total population of 1,600,1052 (65.7%) were females and 548 (34.2%) were males. All subjects wore ordinary clothing and no shoes during the measurements.
Among the participants, 42.8%were high school graduates and 2.4% illiterate. Table 1 describes work experiences of the participants. Most of the workers (34.7%) had less than 5 years of experience and 8.1% had more than 20 years of experience. Anthropometric data of the both sexes (including the 5 and 95 percentiles) are shown in Tables 2 and 3.
| Work Experience | Frequency (%) |
|---|---|
| 5 > | 556 (34.7) |
| 5 - 9 | 383 (23.9) |
| 10 - 14 | 280 (17.5) |
| 15 - 19 | 250 (15) |
| 20 < | 131 (8.1) |
| Total | 1600 (99.8) |
Illustration of the Frequency Distribution of the Participants’ Work Experiences
| Anthropometric measurement a | Female, n = 1031 | ||
|---|---|---|---|
| Mean ± SD | 5th percentile | 95th percentile | |
| Stature | 158 ± 3 | 148 | 16 |
| Eye height | 146 ± 6 | 137 | 158 |
| Shoulder height | 131 ± 8 | 124 | 135 |
| Elbow height | 96 ± 6 | 99 | 105 |
| Hip height | 78 ± 4 | 70 | 83 |
| Knuckle height | 63 ± 5 | 58 | 75 |
| Fingertipheight | 60 ± 4 | 53 | 67 |
| Sitting height | 81 ± 4 | 71 | 89 |
| Sitting eye height | 75 ± 5 | 64 | 89 |
| Sitting shoulder height | 59 ± 4 | 51 | 61 |
| Sitting elbow height | 22 ± 4 | 16 | 28 |
| Thigh thickness | 14 ± 4 | 10 | 19 |
| Buttock-knee length | 56 ± 9 | 51 | 61 |
| Buttock-popliteal length | 45 ± 8 | 39 | 50 |
| Knee height | 48 ± 3 | 41 | 53 |
| Popliteal height | 41 ± 3 | 35 | 50 |
| Shoulder breadth, bideltoid | 42 ± 1 | 36 | 47 |
| Shoulder breadth. Biacromial | 27 ± 4 | 34 | 41 |
| Hip breadth | 34 ± 2 | 30 | 39 |
| Chest depth | 25 ± 1 | 19 | 36 |
| Abdominal depth | 29 ± 1 | 23 | 37 |
| Shoulder-elbow length | 36 ± 5 | 31 | 41 |
| Elbow-fingertip length | 39 ± 2 | 44 | 47 |
| Upper limb length | 72 ± 4 | 66 | 79 |
| Shoulder-grip length | 53 ± 4 | 62 | 69 |
| Head length | 17 ± 5 | 16 | 19 |
| Head breadth | 12 ± 2 | 13 | 14 |
| Hand length | 16 ± 3 | 19 | 19 |
| Hand breadth | 6 ± 2 | 7 | 8 |
| Foot length | 23 ± 1 | 21 | 25 |
| Foot breadth | 7 ± 1 | 8 | 9 |
| Span | 156± 2 | 141 | 170 |
| Elbow span | 60 ± 4 | 45 | 78 |
| Vertical grip reach (standing) | 190 ± 6 | 178 | 202 |
| Vertical grip reach (sitting) | 114 ± 1 | 106 | 123 |
| Forward grip reach | 62 ± 5 | 68 | 78 |
| Body weight | 58 ± 3 | 52 | 65 |
Anthropometric Data for Iranian Females
| Anthropometric Measurement a | Male, n = 568 | ||
|---|---|---|---|
| Mean ± SD | 5th | 95th | |
| Stature | 173 ± 8 | 160 | 184 |
| Eye height | 162 ± 8 | 148 | 173 |
| Shoulder height | 145 ± 7 | 130 | 156 |
| Elbow height | 110 ± 6 | 98 | 118 |
| Hip height | 88 ± 3 | 80 | 97 |
| Knuckle height | 73 ± 4 | 65 | 83 |
| Fingertip height | 65 ± 3 | 58 | 61 |
| Sitting height | 92 ± 2 | 82 | 101 |
| Sitting eye height | 83 ± 5 | 75 | 9 |
| Sitting shoulder height | 63 ± 1 | 55 | 7 |
| Sitting elbow height | 27 ± 4 | 21 | 35 |
| Thigh thickness | 13 ± 2 | 10 | 17 |
| Buttock-knee length | 59 ± 3 | 54 | 64 |
| Buttock-popliteal length | 47 ± 2 | 41 | 5 |
| Knee height | 53 ± 7 | 46 | 60 |
| Popliteal height | 43 ± 8 | 38 | 49 |
| Shoulder breadth, bideltoid | 45 ± 2 | 38 | 53 |
| Shoulder breadth, biacromial | 32 ± 5 | 38 | 43 |
| Hip breadth | 35 ± 3 | 30 | 40 |
| Chest depth | 21 ± 1 | 18 | 27 |
| Abdominal depth | 25 ± 2 | 20 | 32 |
| Shoulder-elbow length | 38 ± 5 | 33 | 45 |
| Elbow-fingertip length | 41 ± 5 | 48 | 56 |
| Upper limb length | 81 ± 4 | 73 | 89 |
| Shoulder grip length | 60 ± 5 | 68 | 75 |
| Head length | 18 ± 1 | 17 | 19 |
| Head breadth | 13 ± 1 | 14 | 15 |
| Hand length | 20 ± 1 | 19 | 21 |
| Hand breadth | 7 ± 1 | 8 | 9 |
| Foot length | 27 ± 1 | 24 | 29 |
| Foot breadth | 7 ± 1 | 9 | 10 |
| Span | 175± 10 | 159 | 189 |
| Elbow span | 70 ± 8 | 65 | 76 |
| Vertical grip reach standing | 210 ± 5 | 191 | 228 |
| Vertical grip reach (sitting) | 130 ± 3 | 115 | 142 |
| Forward grip reach | 70 ± 8 | 78 | 97 |
| Body weight | 73 ± 9 | 63 | 69 |
Anthropometric Data for Iranian Males
Tables 2 and 3 show the anthropometric measurements of the workers. It shows that the mean standing height for males was higher than that of females (173 cm and 158 cm, respectively).The mean sitting height was 92 cm for males and 81 cm for females and knee height was 53 cm for males and 48cm for females. Popliteal height was 43 cm for males, and 41 cm for females. The average weight was 77 kg for males and 59 kg for females.
In our study, some common problems were noted among the respondents. The top five hazards identified were poor posture leading to backache (72.2%), heat (66.6%), overwork (66.6%), poor ventilation (54.8%), and chemical exposure (50.8%). Among physical and psychomotor stresses, the top three were visual strain, overtime work, and high work burden. The most common illnesses related to ergonomic problems were backache (56%), and fatigue and weakness (53.2%). Cuts (46.8%) were on top of the list of common injuries, followed by slipping injuries (23.2%).
5. Discussion
Human environment should be designed free of pressure and stress. The main problem for an ideal design is the physical differences between subjects (9). Human physical dimensions must be considered in the design of workplaces, tools, and equipment. Anthropometry and ergonomics help to enhance the physical health in the workplaces (17). If anthropometric data is not applied in designing a product, it may lead to waste of a variety of resources including human and financial resources, and time (8, 18).
Various factors such as nutrition, ecology, race, age, and gender affect the human body dimensions too. Therefore, the data from the anthropometric studies of a region cannot be generalized to otherareas. Given the geographic size of a country such as Iran, we cannot ignore the ethnic, racial, and climate differences. Comparing the current and past similar data obtained in 2007 by Joneidi et al. their study included 3716 Iranian workers aged 20 - 60. Their research was performed on six different races in Iran, but the ethnicity of Bandar Abbas workers was considered as Persian in their study (13). Morphological characteristics among Iranian people are not the same at all.
Our results indicated that there were great differences in anthropometric data between two genders. The average difference was about 15 cm in height in the standing position. Differences in other dimensions were also significant (P < 0.005). The average height of Iranian female workers was 158 cm compared with that of Filipino women which was153 cm. In a study by Lin et al. the mean height of women were 157, 157, 156, and 158 cm in Taiwan, China, Japan, and Korea, respectively (19). Moreover, the mean height of men was 167, 169, 169, 167, and 171 cm in Philippine, Japan, Taiwan, China, and Korea, respectively. Compared to those results, Iranian men are taller than other Asian men. The result of WsMarms and co-workers’ research also showed that the average height in the mid-western United States population was 174 cm (4, 19).
Physical differences must be considered in designing and post production evaluation of equipment, not applied as a benchmark in the future. The apparel industry can be considered as a very dramatic phenomenon due to changes in the size of the human body dimensions. For example, the current small (S), medium (M), and large (L) sizes could for mass production in the future; these will certainly evolve (4).
No significant correlation was found between the educational level and anthropometric dimensions and more studies are recommended(r = -0.80). In the case of certain occupational groups such as police and military jobs and their crew, there is a limitation for height. In some cases, the choice category leads to selection of people who are physically fit for a particular profession. However, more detailed studied are required in this field.
People encounter a variety of equipments and environments in their daily lives. Mismatch and incongruence between the external environment and the physical characteristics of individuals can cause complications. As a result, differences in body size should be considered in designing the workplaces and designers must work on the requirements based on the users' anatomical, physiological, and anthropometric characteristics. However, this study is far from complete. The time and resource constraints were limiting factors. Further research and the collection of more data are necessary.


