1. Background
Metabolic syndrome (MetS) is a clustering of abnormalities that include diabetes mellitus (DM), obesity (1), dyslipidemia, and hypertension (2). Liver enzymes and lipid profile are closely linked to MetS (3). The role of liver enzymes, mainly aspartate aminotransferase (AST), alanine aminotransferase (ALT), and to a lesser extent, alkaline phosphatase (ALP), has recently been recognized as potential new markers in the development of type 2 diabetes and MetS (4). The liver, as a central organ for glucose and lipid metabolism, is severely affected by MetS (5). Lipids are one of the components required to control cellular function; the liver plays an essential role in lipid metabolism (6). The standard treatment recommended includes engaging in exercise programs to decrease the risk factors for MetS (7). Tondpa Khaghani et al. reported that six weeks of exercise (3 sessions per week) raised serum levels of ALT, AST, ALP, and lipid profile. Furthermore, this decrease was higher in the HIIT group than in the continuous group (8). Yao et al. reported that 22 weeks of aerobic and resistance training was effective in improving HDL, while aerobic exercise may also have the benefit of reducing ALT and TG in Chinese women with non-alcoholic fatty liver disease (NAFLD) (9). Rahimi and Attarzadeh Hosseini reported that 12 weeks of aerobic exercise and a regular diet had a beneficial effect on body composition and some lipid profile; this protocol had no effect on the reduction of liver enzymes (10). On the other hand, alginates are known to be a dietary fiber (11) and have been shown to inhibit digestive enzymes and can, therefore, be used to treat obesity (12) by reducing glucose and cholesterol absorption (13). It is reported that alginate consumption decreased body fat (14) and improved MetS (15).
2. Objectives
This study aimed to evaluate the effect of 8-week sodium alginate supplementation with HIIT and MICT on liver enzymes and lipid profile in men with MetS.
3. Methods
3.1. Participants
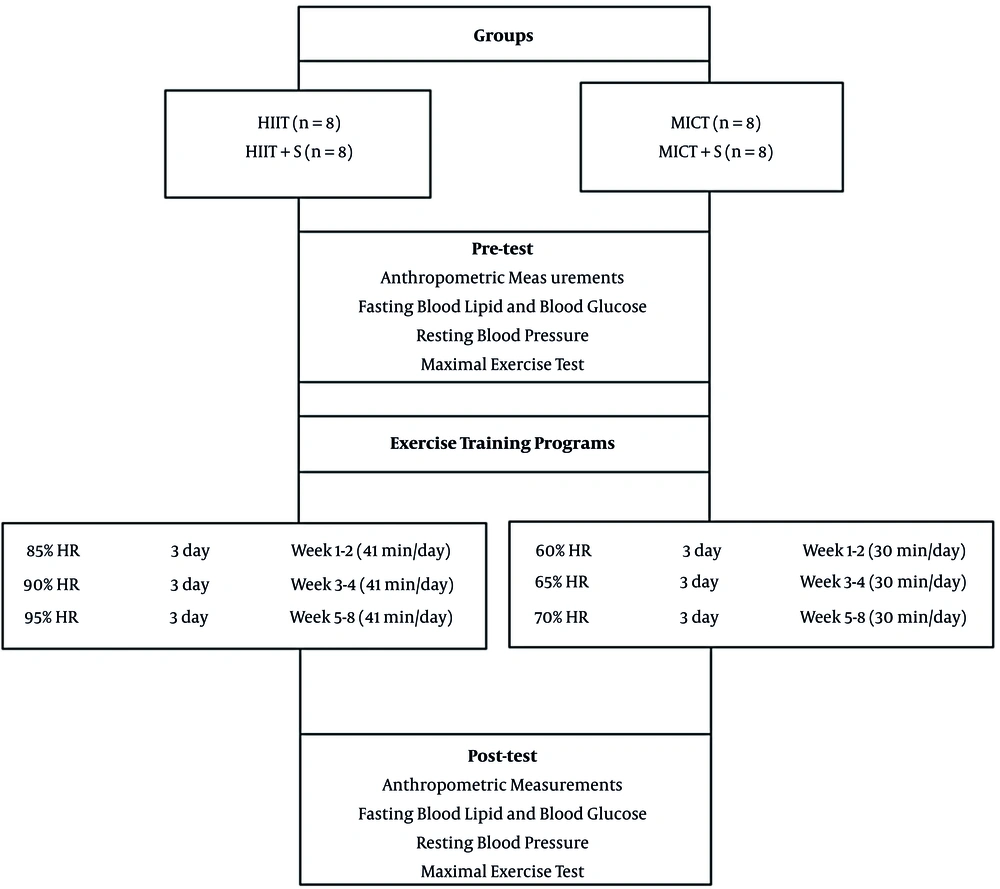
Forty men (18 - 34 years old) were selected according to our research criteria among volunteers (Figure 1). Entrance criteria included not having regular exercise programs for the past six months, diagnosis of MetS (having at least 3 of 5 MetS factors) based on American Heart Association (AHA) criterion (1).
3.2. Experimental Design
Participants were divided into five groups, including high-intensity interval training (HIIT), high-intensity interval training + sodium alginate supplementation (HIIT + S), moderate-intensity interval training (MICT), moderate-intensity interval training + sodium alginate supplementation (MICT + S), and control (C) (Figure 1).
3.3. Measurements
The participants' height and BW were also measured by using the Seca scale (made by Hamburg Germany) with a measuring accuracy of 0.5 cm and 100 g; body mass index (BMI) was calculated accordingly. Waist circumference (WC) and pelvic circumference were measured after 12 hours of fasting state by using a meter with an accuracy of 1 cm (1). Body fat percentage (BFP) was determined using body composition analysis system (made in Korea, ZEUS 9.9 PLUS model). Systolic and Diastolic blood pressure (SBP and DBP) was measured twice at 5 min intervals by using a Richter digital barometer (Richampion 1725145 made in Germany) from the right carotid artery (1). The insulin resistance index was calculated by multiplying the fasting glucose concentration (mg/dL) by the fasting insulin. Concentration (μU/mL) divided by the constant-coefficient 405: HOMA-IR= [fasting glucose (mg/dL) × fasting insulin (μU/mL)]/405 (1).
Modified Bruce incremental test was used for the estimation of the maximum rate of oxygen consumption (VO2max) (16). The subjects warmed up for 5 minutes before the start of the test, and then the participant started running on the treadmill. The training ended when the person was unable to continue, or exhausted criteria for reaching exhaustion included reaching a maximum heartbeat rate (age-220) and RPE ≥ 17 (16).
3.4. Exercise Protocol
The HIIT and MICT groups were trained three times a week Both HIIT and MICT groups were preceded by a 10 min warm-up and terminated with a 10 min cool-down. MICT sessions were 30 min at a target intensity of 60 - 70% HR or rated perceived exertion (RPE) of 11 - 13. The HIIT consisted of 4 bouts of 4 min intervals at 85 - 95% HR peak/RPE of 15 - 17, separated by 3 min active recovery at 50 - 70% HR peak (Figure 1) (17).
3.5. Biochemical Indicators Measurement
Serum liver enzymes were measured by the photometric method using Pars Test kits. Glucose level by enzymatic colorimetric assay (Glucose oxidase, Pars Azmon Co, Tehran, Iran), total cholesterol, and HDL cholesterol levels by using cholesterol oxidase phenol-amino antipyrin and triglyceride levels using the enzymatic method of glycerol 3-phosphate oxidase phenol-amino pyridine; the serum LDL cholesterol level was calculated by Friedman formula (18).
3.6. Data Analysis
All statistical analyses were performed using the SPSS statistical software (version 21; SPSS Inc., Chicago, IL, USA) at a significant level of P < 0.05. The Shapiro–Wilk test was used for evaluating the normality of distribution. In order to compare the mean hepatic risk factors between and within groups, ANOVA and t-test were used, respectively. Tukey's post hoc test was used if significant differences were found.
4. Results
Based on the results, there were significant differences in the mean of BW, BMI, BFP, and VO2max levels between the pre-test and post-test conditions. After eight weeks of intervention, BW, BMI, Waist–hip ratio (WHR), and BFP significantly decreased, and VO2max significantly increased in HIIT. Also, BW, BMI, BFP, and SBP significantly decreased, and VO2max significantly increased in HIIT + S. While, in MICT group BW, BMI, BFP, SBP, and DBP significantly decreased, and VO2max significantly increased (Table 1).
| Variables | HIIT (n = 8) | HIIT + S (n = 8) | MICT (n = 8) | MICT + S (n = 8) | C (n = 8) | P-Value a |
|---|---|---|---|---|---|---|
| Age | 20.88 ± 1.55 | 24.4 ± 4.17 | 25.87 ± 3.6 | 24.62 ± 2.32 | 22.87 ± 4.32 | 0.491 |
| Height | 173.75 ± 4.77 | 176.25 ± 6.73 | 174.62 ± 5.95 | 177.38 ± 4.27 | 179 ± 6 | 0.362 |
| Bodyweight (kg) | ||||||
| Before | 94.21 ± 3.09 | 92.87 ± 3.39 | 94.01 ± 4.67 | 92.32 ± 3.33 | 92.41 ± 2.37 | 0.714 |
| After | 91.97 ± 3.39 b | 87.75 ± 3.34 | 91.57 ± 4.96 | 88.44 ± 3.83 b | 92.8 ± 6.69 | 0.009 c |
| P-value d | 0.001 e | 0.001 e | 0.001 e | 0.001 e | 0.401 | |
| BMI (kg/m2) | ||||||
| Before | 31.28 ± 2.29 | 30.03 ± 2.83 | 30.95 ± 3.07 | 29.4 ± 1.97 | 28.94 ± 2.24 | 0.306 |
| After | 30.54 ± 2.27 | 28.37 ± 2.7 | 30.16 ± 3.15 | 28.16 ± 2.09 | 28.95 ± 2.27 | 0.265 |
| P-value d | 0.001 e | 0.001 e | 0.001 e | 0.001 e | 0.030 e | |
| WHR (cm) | ||||||
| Before | 0.93 ± 0.01 | 0.93 ± 0.02 | 0.94 ± 0.02 | 0.93 ± 0.01 | 0.94 ± 0.02 | 0.466 |
| After | 0.91 ± 0.02 | 0.92 ± 0.02 | 0.92 ± 0.02 | 0.92 ± 0.01 | 0.94 ± 0.03 | 0.087 |
| P-value d | 0.006 e | 0.116 | 0.126 | 0.003 e | 0.540 | |
| BFP (%) | ||||||
| Before | 25.53 ± 2.3 | 29.13 ± 2.67 | 30.01 ± 2.27 | 29.17 ± 2.98 | 27.28 ± 4.35 | 0.037 c |
| After | 23.66 ± 1.88 | 26.77 ± 2.29 b | 27.91 ± 3.08 | 27.45 ± 2.51 | 27.4 ± 7.73 | 0.047 c |
| P-value d | 0.001 e | 0.002 e | 0.001 e | 0.004 e | 0.262 | |
| VO2max (mmHg) | ||||||
| Before | 36.98 ± 4.5 | 35.4 ± 7.92 | 34.25 ± 4.03 | 35.83 ± 4.79 | 32.39 ± 5.33 | 0.337 |
| After | 43.5 ± 5.18 b | 42.4 ± 4.03 b | 39.56 ± 4.58 b | 41.71 ± 5.18 b | 31.81 ± 4.17 | 0.001 c |
| P-value d | 0.003 a | 0.001 a | 0.002 a | 0.001 a | 0.173 | |
| SBP (mmHg) | ||||||
| Before | 12.72 ± 0.6 | 13.48 ± 0.6 | 13.53 ± 0.41 | 13.55 ± 0.46 | 14.2 ± 0.53 | 0.052 |
| After | 12.42 ± 0.21 b | 12.43 ± 0.77 b | 12.31 ± 0.93 b | 12 ± 1.01α | 13.96 ± 0.52 | 0.001 c |
| P-value d | 0.242 | 0.002 a | 0.035 a | 0.003 a | 0.152 | |
| DBP (mmHg) | ||||||
| Before | 7.73 ± 1.09 | 7.98 ± 0.92 | 8.47 ± 0.55 | 7.55 ± 1.12 | 7.98 ± 1.1 | 0.405 |
| After | 7.88 ± 0.46 b | 7.82 ± 0.54 | 7.92 ± 0.49 | 7.5 ± 0.55 | 8 ± 0.43 | 0.011 c |
| P-value d | 0.623 | 0.489 | 0.003 a | 0.908 | 0.820 |
Anthropometric and Primary Characteristics of the Subjects
The results of one-way ANOVA showed no significant difference in all variables (except for BFP levels) between the groups in the pre-test. However, significant differences were observed in all variables (except for BMI and BPF) between the groups in the post-test. The results of Tukey's post hoc test showed that no significant difference was seen in all variables between the experimental groups; there was a significant difference between the experimental groups and the control group in the BFP and VO2max (Table 1).
After eight weeks, TC, TG, LDL, insulin, glucose, Homeostatic Model Assessment for Insulin Resistance (HOMA-IR), and MetS Z-score significantly decreased, and HDL significantly increased in the experimental groups (Table 2). The results of one-way ANOVA showed no significant difference in all variables between the groups in the pre-test. However, in the post-test, there was a significant difference in all variables (except for HDL) between the groups. The results of Tukey's post hoc test showed a significant difference between the experimental groups and the control group in the MetS Z-score (Table 2).
| Variables | HIIT (n = 8) | HIIT + S (n = 8) | MICT (n = 8) | MICT+S (n = 8) | C (n = 8) | P-Value a |
|---|---|---|---|---|---|---|
| TC (mg/dL) | ||||||
| Before | 170.38 ± 20.26 | 162 ± 20 | 165 ± 13.5 | 176.38 ± 12.76 | 150.12 ± 24.79 | 0.090 |
| After | 151 ± 18.23 | 130.25 ± 18.5 b | 150 ± 14.66 | 154.88 ± 14.18 | 154.6 ± 12.62 | 0.001 c |
| P-value d | 0.001 e | 0.001 e | 0.001 e | 0.001 e | 0.201 | |
| TG (mg/dL) | ||||||
| Before | 159.5 ± 19.16 | 170.5 ± 24.76 | 177.38 ± 12.72 | 176.38 ± 12.76 | 169.25 ± 13.31 | 0.187 |
| After | 141.88 ± 19.24 | 129.25 ± 9.34 b, f | 159.12 ± 14.03 g | 136 ± 14.32 b | 172.25 ± 11.32 | 0.001 c |
| P-value d | 0.001 e | 0.001 e | 0.001 e | 0.001 e | 0.370 | |
| LDL (mg/dL) | ||||||
| Before | 105.16 ± 10.12 | 99.79 ± 11.5 | 105.25 ± 14.07 | 106 ± 6.23 | 95.58 ± 12.37 | 0.271 |
| After | 87.7 ± 2.62 | 79.25 ± 7.25 b | 90.37 ± 8.92 | 86.75 ± 11.6 | 94.76 ± 12.37 | 0.008 c |
| P-value d | 0.001 e | 0.001 e | 0.001 e | 0.003 e | 0.210 | |
| HDL (mg/dL) | ||||||
| Before | 36.8 ± 4.75 | 31.72 ± 3.12 | 36.5 ± 7.78 | 33.37 ± 8.15 | 34.55 ± 9.12 | 0.501 |
| After | 39.65 ± 4.75 | 39.6 ± 6.25 | 39.37 ± 7.32 | 38.87 ± 7.8 | 33.43 ± 1 | 0.128 |
| P-value d | 0.002 e | 0.001 e | 0.001 e | 0.001 e | 0.310 | |
| FBS(UL/mL) | ||||||
| Before | 97.72 ± 12.25 | 89.66 ± 10.75 | 100.75 ± 4.2 | 93.25 ± 10.96 | 87.63 ± 14 | 0.122 |
| After | 88.03 ± 8 | 78.7 ± 5 b, f | 91.75 ± 5.28 | 83.5 ± 5.85 | 75.9 ± 12.93 | 0.007 c |
| P-value d | 0.001 e | 0.004 e | 0.001 e | 0.016 e | 0.031 e | |
| Insulin(μU/mL) | ||||||
| Before | 17.36 ± 2.86 | 19 ± 4.68 | 18.68 ± 4.67 | 19.05 ± 5.11 | 15.12 ± 1.71 | 0.264 |
| After | 12.87 ± 1.21 | 13.21 ± 2.65 b | 14.68 ± 2.58 | 13.7 ± 3.04 | 15.23 ± 0.01 | 0.049 c |
| P-value d | 0.002 e | 0.001 e | 0.003 e | 0.001 e | 0.070 | |
| HOMA-IR | ||||||
| Before | 4.17 ± 0.97 | 4.23 ± 1.23 | 4.66 ± 1.23 | 4.43 ± 1.45 | 3.25 ± 0.68 | 0.159 |
| After | 2.8 ± 0.42 b | 2.55 ± 0.55 b | 3.33 ± 0.66 | 2.84 ± 0.74 b | 3.31 ± 0.66 | 0.004 c |
| P-value d | 0.001 e | 0.001 e | 0.001 e | 0.001 e | 0.020 e | |
| MetS Z-score | ||||||
| Before | 0.519 ± 0.38 | 0.725 ± 0.457 | 0.863 ± 0.263 | 0.852 ± 0.277 | 0.668 ± 0.24 | 0.240 |
| After | -0.036 ± 0.21 b | 0.242 ± 0.11 b, f | 0.25 ± 0.196 b | 0.074 ± 0.122 b | 0.848 ± 0.219 | 0.001 c |
| P-value d | 0.001 e | 0.001 e | 0.001 e | 0.001 e | 0.820 |
Changes in Lipid Profiles, Insulin, Glucose, HOMA-IR, and Z-Scores in All Groups
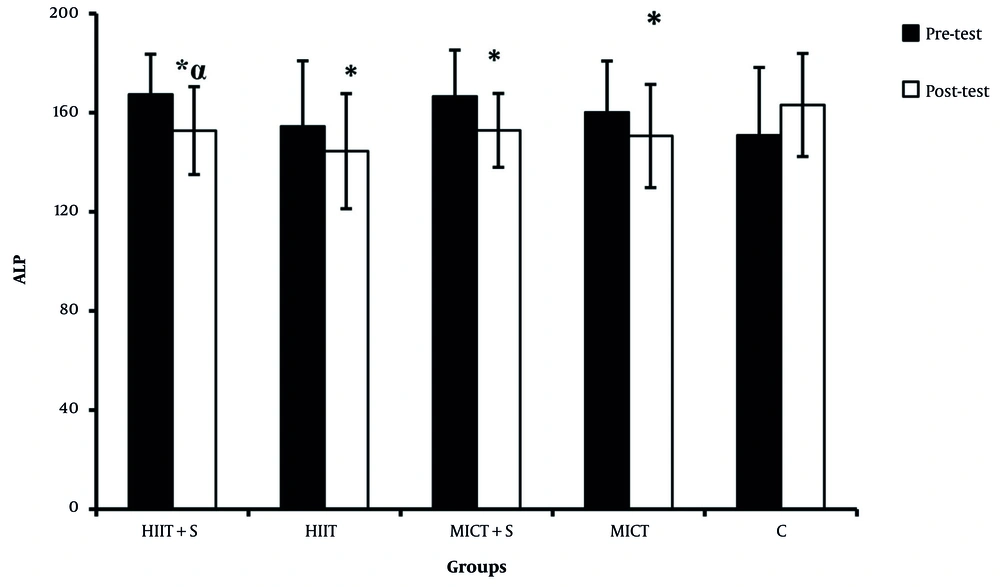
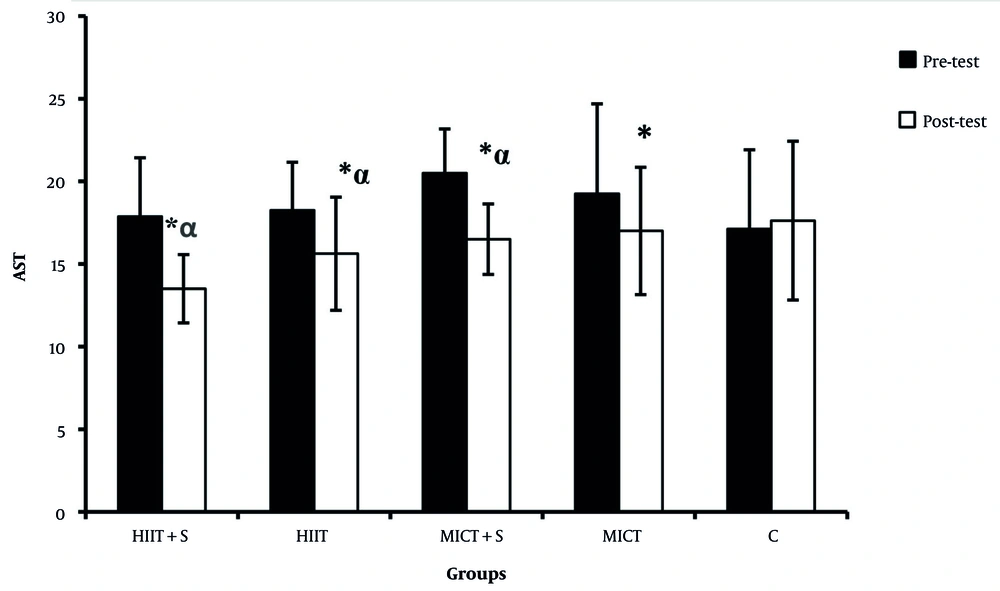
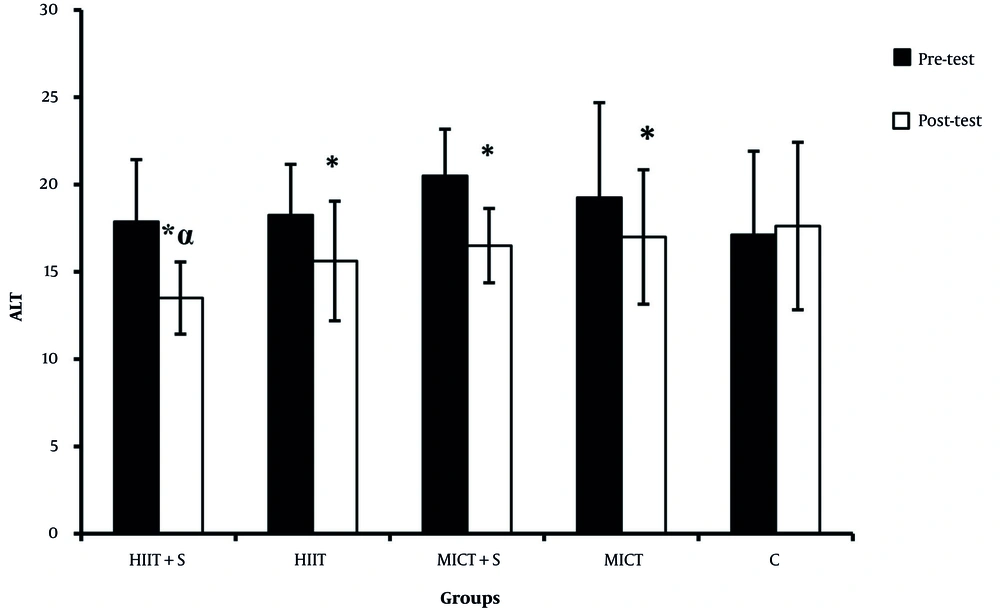
There were significant differences in the ALP, AST, and ALT between the pre-test and post-test in all experimental groups (Figures 2 - 4). There was a significant difference between HIIT + S and C in terms of ALP levels, while no significant difference was observed between other groups (Figure 2). There was a significant difference between HIIT + S, HIIT, and MICT + S with C in terms of AST levels. In contrast, no significant difference was observed between other groups (Figure 3). There was a significant difference between HIIT + S, with C in terms of ALT levels, while no significant difference was observed between other groups (Figure 4).
5. Discussion
The results of our study showed a significant decrease in AST, ALT, TG, TC, LDL, FBS, and HOMA-IR after eight weeks of HIIT and MICT in men with MetS. This decrease was higher in the HIIT + S than in the other groups. On the other hand, Poon et al. (19) reported that after twelve weeks of training, ALT did not decrease. Davoodi et al. reported that eight weeks of regular aerobic training could decrease ALT and AST levels (20). Yao et al. reported that 22 weeks of aerobic and resistance training is effective in improving HDL; while aerobic training may also reduce TG and ALT in Chinese women with NAFLD (9). Increased ALT levels were associated with decreased insulin sensitivity, adiponectin, and glucose tolerance, as well as increased ALT levels with an increased risk of MetS in adults (21). Decreasing liver enzymes can increase the liver's sensitivity to insulin, increase liver oxidation, decrease lipogenic enzymes, and reduce liver fat (16). Another important finding of the present study was the impacts on the improvements of subject's MetS Z score that was more in the HIIT + S than in the other groups. Ramos et al. compared the three types of exercise (HIIT1, HIIT4, MICT) and concluded that HIIT1 was more effective than HIIT4 and MICT in improving MetS and reducing Z scores (17). The mechanism responsible for the reduction in hepatic fat following exercise is likely related to changes in energy balance (22), circulating lipids, and insulin sensitivity (23). An increase in HDL may be due to increased activity of the lipoprotein lipase (LPL). LPL enzyme in the conversion of VLDL to HDL works through increasing the C-HDL activity. In addition to LDL, cholesterol acetyltransferase also converts cholesterol to HDL. An increase in this enzyme may be the main mechanism for elevated HDL due to exercise (24). Exercise activities can stimulate lipid oxidation and inhibit lipid synthesis within the liver, which is mediated by activating the AMPK pathway. The stimulation and activation of this enzyme with increased AMP to ATP ratio in the tissue is another possible result of the physiological stimulus of exercise activity (25). Sodium alginate supplementation is shown to improve insulin sensitivity, hyperinsulinemia, and hyperleptinemia, and attenuate inflammation in white adipose tissue and inhibit hepatic lipid synthesis. It also reduces oxidative stress and increases antioxidant enzyme levels in the liver (26). Sodium alginate supplementation inhibits NAFLD progression and liver tumors development (26). Another study also showed that 12 weeks of MICT alone or in combination with a diet reduced visceral fat but did not change serum levels of liver enzymes significantly (27).
5.1. Conclusions
The present study showed that eight weeks of HIIT + S, HIIT, MICT + S, and MICT decreased ALT, AST, and ALP levels significantly. Therefore, it can be concluded that exercise and sodium alginate supplementation may improve and decrease liver enzymes and decrease MetS risk factors. Further studies are needed to determine the effect of HIIT and MICT with different intensity and duration on the liver enzymes as well as higher doses of sodium alginate supplementation.
