1. Background
Calcitonin gene-related peptide (CGRP) and calcitonin (CT) are somewhat homologs (1). CGRP is one of the CT family peptides, and its receptors that mediate antinociceptive are found in different brain regions, including in periaqueductal gray matter, nucleus raphe obscurus, and nucleus raphe magnus (2, 3). The CGRP receptor is derived from the erodimerization of a protein called “receptor activity-modifying protein” with a CT receptor (4). The CT receptor has two types of CTRa and CTRb capable of connecting to CT similarly (5, 6). Generally, the distribution of CGRP and CT receptors in rats has a high degree of overlap (7). Studies confirm that CGRP and CT play roles in descending pain control systems in periaqueductal gray (PAG) (8-13).
PAG nucleus in the midbrain is one of the important coordinating structures in the pathways of descending pain control. The direct association of PAG with other nuclei, such as raphe magnus, is important in forming pathways for descending pain control (14-16).
2. Objectives
The present study evaluated the possible effects of the intracerebroventricular (ICV) injection of CT gene-related peptide (CGRP) and rat-CT (rCT) on the mRNA expression of CGRP and rCT peptides in the PAG of healthy rats in the formalin test.
3. Methods
3.1. Ethical Considerations
All experiments in this study were approved by the Ethics Committee of the School of Veterinary Medicine, Shiraz University, Shiraz, Iran (code: 96INT2M1293).
3.2. Animals
All the experiments were performed on male Sprague Dawley rats with a mean weight of 270 ± 30 g. The animals were fed ad libitum and retained in a cage at 22°C ± 2°C and the dark-light cycle of 12 - 12 hours until the initiation of the experiments.
3.3. Test Groups
The animals were divided into four groups (n = 6). Group 1 (control) were healthy rats that received normal saline at a volume similar to that administered to the test group through ICV administration and 50 μL of normal saline subcutaneously (SC) in the back paw. Group 2 (formalin control) consisted of healthy rats who received normal saline at a volume similar to the test group through the ICV route and 50 μL of 2.5% formalin SC in the back paw. Group 3 (rCT) included healthy rats which received 50 μL of ICV rCT at 1.5 nmol and 50 μL 2.5% formalin SC in the back paw. Group 4 (CGRP) were healthy rats that received 50 μL of ICV CGRP at 1.5 nmol and 50 μL 2.5% formalin SC in the back paw.
3.4. Surgery and Pain Testing
The animals were anesthetized by a combination of 95 mg/kg ketamine and 5 mg/kg xylazine. For ICV administration, based on the Atlas of Paxinos and features (AP = -0.8, DV = -3.6, L = +1.5), the cannula was implanted in the brain ventricle. One week was given for animal recovery, and ICV injections were performed for 7 days in the experimental groups. Formalin test was performed on the seventh day (17). In the end, the animals were euthanized by CO2, and their brains were immediately removed. PAG was separated and kept at -70°C until the mRNA expression levels were evaluated.
The formalin test was used to assess pain sensation. In the test, when any unusual behavior was not exhibited, it was given a score of ‘0;’ if the rat’s leg claw was on the floor, but it did not put its weight on the leg claw, it was ‘1;’ if the rat pulled up its legs in the abdominal area, or struck the floor with a leg claw, it was given a score of ‘2;’ and lastly, if the rat licked or bit the leg claw that had been injected, a score of ‘3’ was recorded (18).
3.5. RNA Extraction and cDNA Synthesis
Total RNA from brain tissues was isolated using an RNX-Plus Extraction kit (low copy RNA isolation, Sinagen, Iran). Briefly, 1 g of each sample was homogenized and vortexed for 5 - 10 sec at room temperature. Next, 1 mL of RNX was added to the samples and kept on ice. After a while, 200 μL chloroform was added to the tubes and centrifuged at 4°C. An equal volume of isopropanol (approximately 500 μL) was then added to the clear supernatant, which was centrifuged at 4°C. Afterwards, 500 μL of 80% ethanol was used to wash the resultant tiny pellet, the supernatant was discarded, and the tube was placed inverted to evaporate the ethanol. Next, 40 μL of elution buffer (EB, Qiagen, Germany) was used to dissolve the RNA pellet, which was finally kept at -70°C for further use. The fragmented RNA was electrophoresed on 2% agarose gel, stained, and visualized under UV light. The concentration of purified RNA was then determined at 260 and 280 nm by the photometrical method using a Nanodrop Lite spectrophotometer (Thermo Scientific, Withalm, USA). EasyTM cDNA synthesis kit (Pars Tus Inc., Iran) was used to transcript RNA to cDNA using oligo(dT) primers according to the instruction provided by manufacturers. The cDNA was then kept frozen at -80°C.
3.6. Real-Time PCR
A light cycler 96-well device (Roche, Germany) was used to analyze the gene expression of CGRP and β-actin mRNA in the samples. The reaction mixture was prepared in 20 μL containing 2.5 μL ddH2O, 12.5 μL of 1x SYBER mix (BIOEeasy, China), 1 μL of each primer (Table 1), and 0.3 μL of Taq polymerase (Cinagene, Iran). The β-actin gene was used as the endogenous control of reactions. Amplification of the genes was performed using BIORAD (Mini Opticon) as follows; denaturation at 94°C for 2 min, followed by 40 cycles at 94°C for 30 sec, annealing at 54°C for 1 min, extension at 72°C for 30 sec, and final extension at 72°C for 4 min. A dissociation curve for each sample was drawn to avoid any nonspecific products and primer dimers. A standard curve was constructed for each genome, and the respective threshold cycle (Ct) was plotted. The equation “ratio = 2-∆∆Ct” was finally employed to calculate the gene expression of the samples and internal control. The absence of nonspecific products for the target gene or peaks corresponding to primer dimers was applied to evaluate the efficiency of the amplification of the target and endogenous control genes. Primers used in the current study are shown in Table 1.
3.7. Statistical Analysis
SPSS version 20 was utilized to analyze the data. One-way analysis of variance and Tukey’s HSD, as the post hoc test, were used to compare the mean values in each group. P-value < 0.05 was considered statistically significant.
4. Results
4.1. Formalin Test
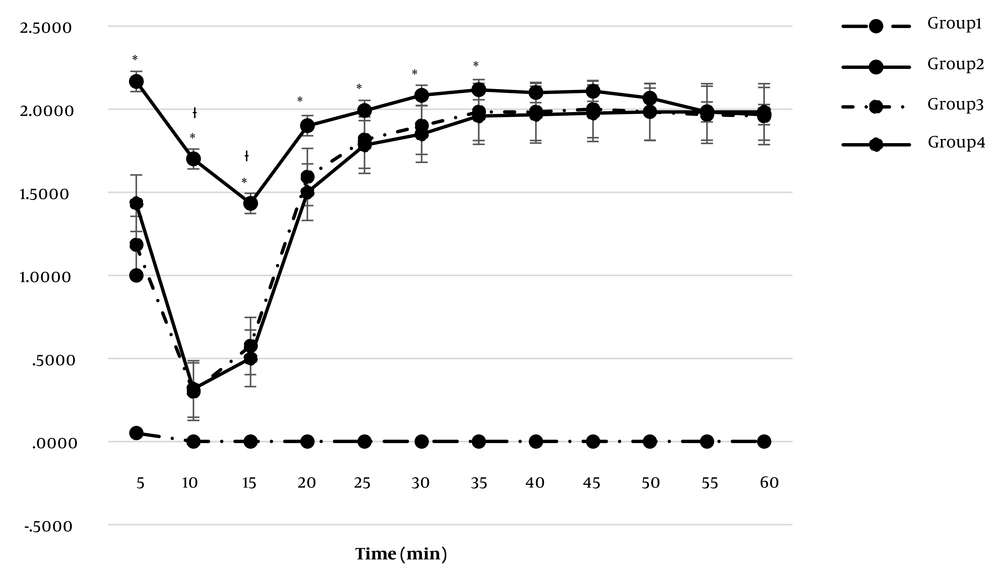
In the acute phase of the formalin test, the mean pain severity scores in the rCt (1.18 ± 0.04) and CGRP (1.43 ± 0.06) injected groups were lower than in the formalin group (2.16 ± 0.06) (P < 0.05) (Figure 1). In the middle phase of the test, the mean scores in the rCt (0.43 ± 0.01) and CGRP (0.40 ± 0.01) groups were lower than in the formalin group (1.5 ± 0.05) (P < 0.05). The mean score in the chronic phase of the formalin test was also lower (P < 0.05) in the rCt (1.90 ± 0.02) and CGRP (1.88 ± 0.02) groups compared to the formalin group (2.00 ± 0.02). Furthermore, the mean (mean ± SEM) of the numbers related to the different times of the formalin test (from the start of the test to the duration of 60 min with intervals of 5 min) is shown in Table 2.
Nociceptive score in pain assessment in the formalin test. Group 1: ICV injection of normal saline (NS) (7 days) and subcutaneous (SC) injection of NS in the hind paw. Group 2: ICV injection of NS (7 days) and SC injection of formalin 2.5%. Group 3: ICV injection of sCT at the dose of 1.5 nmol (7 days) and SC formalin 2.5%. Group 4: ICV injection of CGRP at the dose of 1.5 nmol (7 days) and SC formalin 2.5%. *: Significant differences between groups 3 and 2 (P < 0.05). †: Significant differences between groups 4 and 2 (P < 0.05).
| Group | ||||
|---|---|---|---|---|
| 1 | 2 | 3 | 4 | |
| Min5 | 0 ± 0A | 2.17 ± 0.07C | 1.18 ± 0.01B | 1.43 ± 0.02B |
| Min10 | 0 ± 0A | 1.17 ± 0.06D | 0.3 ± 0.01C | 0.32 ± 0.02C |
| Min15 | 0 ± 0A | 1.43 ± 0.05E | 0.58 ± 0.03C | 0.5 ± 0.02C |
| Min20 | 0 ± 0A | 1.9 ± 0.08C | 1.6 ± 0.04B | 1.5 ± 0.03B |
| Min25 | 0 ± 0A | 2 ± 0.03C | 1.82 ± 0.03B | 1.78 ± 0.03B |
| Min30 | 0 ± 0A | 2.08 ± 0.03C | 1.9 ± 0.05B | 1.85 ± 0.04B |
| Min35 | 0 ± 0A | 2.12 ± 0.03C | 1.98 ± 0.01B | 1.96 ± 0.04B |
| Min40 | 0 ± 0A | 2.1 ± 0.03C | 1.98 ± 0.03B | 1.97 ± 0.03B |
| Min45 | 0 ± 0A | 2.1 ± 0.03C | 2 ± 0B | 1.98 ± 0.02B |
| Min50 | 0 ± 0A | 2.1 ± 0.04C | 1.98 ± 0.01BC | 1.98 ± 0.01BC |
| Min55 | 0 ± 0A | 1.98 ± 0.01B | 1.97 ± 0.03B | 1.98 ± 0.01B |
| Min60 | 0 ± 0A | 1.96 ± 0.02B | 1.96 ± 0.04B | 1.98 ± 0.01B |
a Dissimilar letters (A, B, C, D) indicate significant differences between groups (P < 0.05).
b Group 1: ICV injection of normal saline (NS) (7 days) and subcutaneous (SC) NS injected in the hind paw. Group 2: ICV injection of NS (7 days) and SC formalin 2.5%. Group 3: ICV injection of sCT at the dose of 1.5 nmol (7 days) and SC formalin 2.5%. Group 4: ICV injection of CGRP at the dose of 1.5 nmol (7 days) and SC formalin 2.5%.
4.2. mRNA Expression of CGRP and rCT Peptides
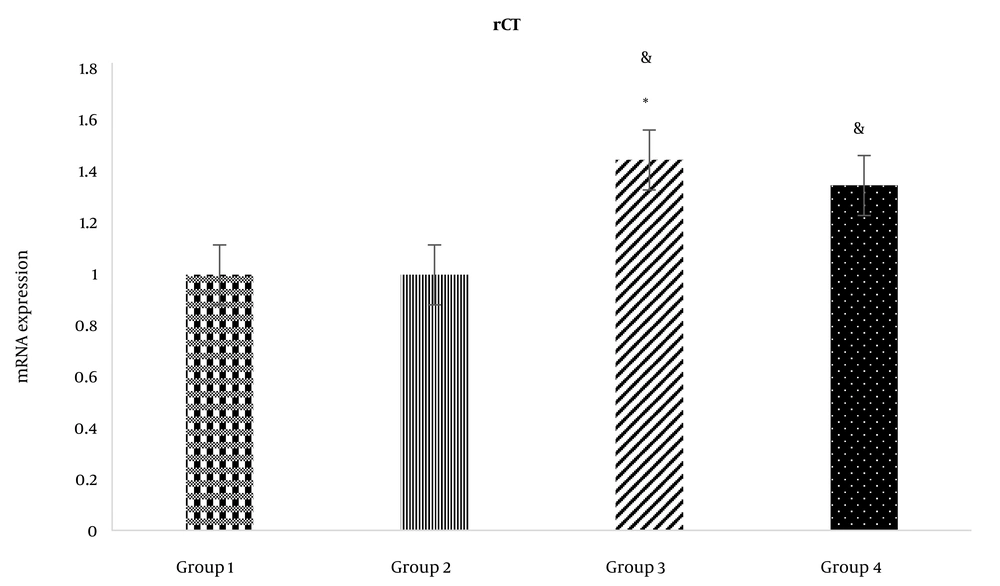
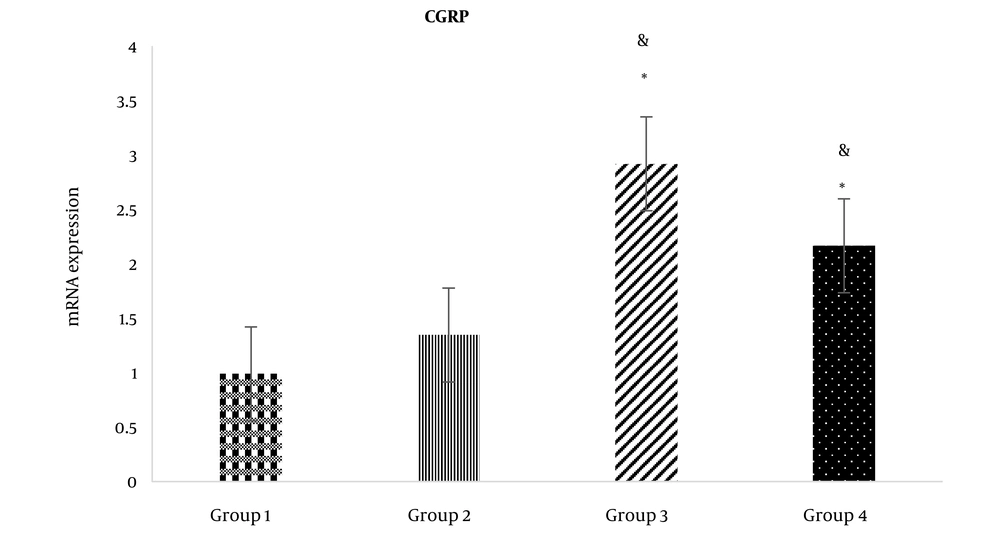
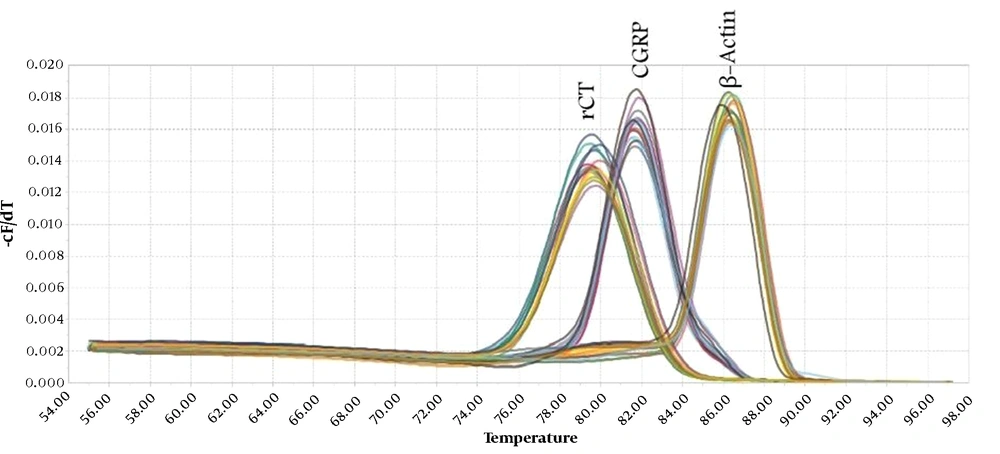
Following the ICV administration of rCT, rCT mRNA expression in the third (1.45 ± 0.25) and fourth groups (1.35 ± 0.30) increased significantly compared to the first group (1.00 ± 0.00) (P < 0.05) (Figure 2). Moreover, after the ICV administration of rCT, the expression of rCT mRNA in the third group (1.45 ± 0.25) rose significantly compared to the second group (1.00 ± 0.10) (P < 0.05) (Figure 2). However, rCT ICV administration had no significant effect on CGRP mRNA expression in the fourth group (1.35 ± 0.30) compared to the second group (1.00 ± 0.10) (Figure 2). In addition, following the ICV administration of CGRP, CGRP mRNA was significantly upregulated in the third (2.95 ± 0.32) and fourth groups (2.19 ± 0.26) compared to the first group (1.00 ± 0.00) (P < 0.05) (Figure 2). Furthermore, the ICV administration of CGRP caused rCT mRNA expression in the third group (1.59 ± 0.22) to increase significantly compared to the second group (1.00 ± 0.10) (P < 0.05) (Figure 3). It is noteworthy that the ICV administration of CGRP had a significant effect on CGRP mRNA expression in the fourth group (1.39 ± 0.27) compared to the second group (1.00 ± 0.10) (P < 0.05) (Figure 3). Melting curves of rCT, CGRP, and β-actin are shown in Figure 4.
rCT mRNA expression in the study groups. Group 1: ICV injection of normal saline (NS) (7 days) and subcutaneous (SC) NS in the hind paw. Group 2: ICV injection of NS (7 days) and SC formalin 2.5%. Group 3: ICV injection of sCT at the dose of 1.5 nmol (7 days) and SC formalin 2.5%. Group 4: ICV injection of CGRP at the dose of 1.5 nmol (7 days) and SC formalin 2.5%. *: Significant differences of groups 3 and 4 with group 2 (P < 0.05). &: Significant differences of groups 3 and 4 with group 1 (P < 0.05).
CGRP mRNA expression in the study groups. Group 1: ICV injection of normal saline (NS) (7 days) and subcutaneous (SC) NS in the hind paw. Group 2: ICV injection of NS (7 days) and SC formalin 2.5%. Group 3: ICV injection of sCT at the dose of 1.5 nmol (7 days) and SC formalin 2.5%. Group 4: ICV injection of CGRP at the dose of 1.5 nmol (7 days) and SC formalin 2.5%. *: Significant differences of groups 3 and 4 with group 2 (P < 0.05). &: Significant differences of groups 3 and 4 with group 1 (P < 0.05).
5. Discussion
In the present study, the ICV injection of CGRP or rCT peptide reduced rat pain caused by formalin injection in all test phases. The daily administration of CGRP or rCT in the brain led to increased CGRP and CT mRNA expression in PAG.
CGRP and its receptors are distributed in pain pathways in the central and peripheral nervous systems. It has been shown that CGRP may have a role in activating the CGRP1 receptor in the PAG and activating the system of descending pain control in inhibiting the transmission of pain information in the dorsal root of the spinal cord (22-24). Proximal distal regulated cell-specific enhancer and cyclic AMP activated by mitogen-activated protein kinase (MAPK) signaling pathways regulate the CGRP promoter. MAPK can stimulate the CGRP promoter in response to proinflammatory cytokines. Furthermore, CGRP can activate these pathways to enhance its expression and potentially raise CGRP actions in a feedback loop (25). In the current study, the ICV injection of CGRP peptide reduced pain in the formalin test. Various studies have also reported the analgesic effects of CGRP (10, 26-28). We found that following the ICV injection of CGRP, rCT mRNA expression increased in the PAG area. It is noteworthy that the ICV injection of CGRP had a significant effect on CGRP mRNA expression in the PAG area. Large amounts of CGRP mRNA are found in the trigeminal ganglia and dorsal root ganglia neurons. In addition, the CGRP mRNA is observed in the dura mater, pituitary, hypothalamus, PAG, hippocampus, and cingulate gyrus (29). Inflammogenic substances, such as formalin, directly activate the transient potential receptors of TRPA1 and TRPV1 in the dorsal root ganglia and stimulate CGRP synthesis (27, 28). The presence of CGRP causes its synthesis in the neurons (29).
The ICV injection of rCT peptide in rats reduced pain in the acute and middle phases of the formalin test. In addition, rCT could reduce pain in the chronic phase of the test. The ICV injection of rCT induced the expression of rCT mRNA in the PAG area. However, the ICV injection of rCT had no significant effect on CGRP mRNA expression in the PAG area. In similar studies, the ICV administration of salmon CT has been shown to reduce pain (30-32). The CT receptor mRNA is expressed in different brain regions, which are known to play a role in pain modulation.
5.1. Conclusions
Our results showed that the ICV injection of CGRP and rCT peptides reduces the pain caused by formalin injection in rats. The probable mechanism could be attributed to the increased expression of the mRNA of these two peptides in the PAG. The presence of the two exogenous peptides, CGRP and rCT, can raise their synthesis in the antinociceptive system by augmenting their mRNA expression in the PAG, leading to their associated antinociceptive effects. Other mechanisms may attenuate this prolonged antinociceptive effect of CGRP and rCT in rats that need to be elucidated in future studies.


