


1. Background
Pulmonary embolism (PE), a life-threatening condition, ranks as the third most common cardiovascular disorder after myocardial infarction and cerebrovascular accident, with high rates of mortality and morbidity. It is caused by a thrombus originating from the deep veins of the legs or pelvis that eventually blocks one or more pulmonary arteries, leading to impaired blood flow and elevated right ventricular (RV) pressure (1).
Both acquired and inherited risk factors contribute to the development of PE. Inherited prothrombotic disorders, along with reduced anticoagulants, deficiencies in coagulation inhibitors, and factor V Leiden abnormalities, are the most frequent genetic risk factors associated with PE (2). Additionally, the risk of PE is significantly higher after various surgeries such as orthopedic surgery, neurosurgery, and cancer-related procedures compared to the general population. Hospitalization, infection, and immobility lasting more than two days also increase the likelihood of PE (3).
According to a large population-based study, the incidence rate of symptomatic PEs is seven times higher among patients with cancer, particularly those with metastatic forms of the disease, compared to the general population (4). Acute RV failure and hypoxia are the primary pathophysiological presentations of PE. Pulmonary embolism triggers neural reflexes, platelet activation, thrombin release, and overactivation of vasoactive peptides (5).
Approximately 50% of all PEs occur in hospitals or healthcare centers. Pulmonary embolism is a high-risk and potentially fatal condition; therefore, rapid diagnosis and prompt therapeutic intervention are essential (6). Treatment strategies include hemodynamic and respiratory support through oxygen administration, fluid resuscitation, nitric oxide inhalation, vasopressors, anticoagulation therapy, thrombolytic treatment, catheter-directed therapy (CDT), and surgical embolectomy (7, 8).
2. Objectives
Given the critical nature of PE and its increasing prevalence, especially in recent years, this study aimed to investigate treatment outcomes, complications, and hospitalization rates based on different treatment methods in patients referred to Shohada Tajrish Hospital during 2018 - 2019.
3. Methods
The current study is a case-series retrospective study conducted from 2018 to 2019 on 108 PE patients who had been discharged from Shohada Tajrish Hospital, Tehran, Iran, at least 6 months prior. All participants' personal identities and information were kept confidential. Moreover, the present study was approved by the Ethics Committee of Shahid Beheshti University of Medical Sciences, Tehran, Iran.
The data were obtained from the hospital archives. The recorded information included age, gender, hospitalization period, and clinical presentations such as dyspnea, tachypnea, frequent chest pain, fever, tachycardia, cough, sweating, hemoptysis, cyanosis, and shock. The underlying causes of thromboembolism included lower limb fractures, surgery, cancer, burns, pregnancy, postpartum conditions, previous DVT, trauma, congestive heart failure, cardiovascular disorders, immobility, obesity, and the use of specific medications. Additionally, details of administered drugs, the incidence of drug side effects, the number of referrals, and regular periodic tests were recorded.
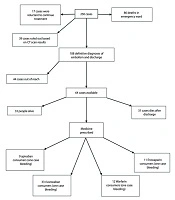
The diagnostic tests documented for these patients included CT, angiography, ventilation-perfusion scans, radiography, electrocardiography (EKG), and echocardiography. Furthermore, therapeutic methods such as anticoagulant therapy (including the type of injectable and/or oral anticoagulants, such as warfarin or rivaroxaban, along with their dosage and duration of use), thrombolytic therapy, and surgery were recorded. The total number of patients and the study outline are shown in Figure 1.

The number of total and included patients in the study
Exclusion criteria included patients in whom the diagnosis of PE was rejected, those with less than 6 months since the start of treatment, and pregnancy or breastfeeding.
3.1. Statistical Analyses
The chi-square test and Fisher's Exact test were used to determine the relationships between underlying factors and mortality, bleeding, and embolism severity. The Kruskal-Wallis non-parametric test was employed to compare the length of hospital stay. IBM SPSS Statistics V. 21.0 was used for statistical analysis, with the significance level set at 0.05.
4. Results
In this study, 108 hospitalized patients with PE admitted to Shohada Tajrish Hospital were assessed. The mean age of the patients was 59.61 ± 21.2 years. Additionally, 44% of the patients were men, while 56% were women. The average duration of hospitalization was 8.2 ± 5.5 days. Based on the patients’ clinical conditions and CT angiography results, 58% of the patients were diagnosed with mild embolism, 24% with moderate embolism, and 18% with severe embolism.
The frequency of clinical manifestations among these patients is illustrated in Figure 2. Dyspnea was reported in 95% of the patients, while 45% experienced chest pain and hypoxia, making these the most common clinical symptoms. The least frequent manifestations were hemoptysis, reported in 6% of patients, and hypotension and fever, each observed in 13% of cases.

Frequency of clinical presentationsin admitted patients
According to our findings, 90% of available patients adhered to regular medication after discharge. Bleeding occurred in 17% of patients, and mortality was reported in 28 patients (44%) after hospitalization. Stroke, tumors, and cancer were identified as the most common causes of death in patients who died in the context of PE.
The association between underlying diseases and mortality, bleeding, and embolism severity was analyzed. As shown in Table 1, a significant relationship was observed between underlying diseases, such as diabetes, hypertension, and cancer, and the mortality rate (P < 0.05). Moreover, hypertension was significantly associated with the frequency of bleeding (P < 0.05). However, no significant association was found between the severity of embolism and underlying diseases (P > 0.05).
| Underlying Factor | Diabetes (n = 17) | Hypertension (n = 43) | Stroke (n = 12) | Cancer (n = 19) | Surgery (n = 38) | Pelvic Fracture (n = 12) |
|---|---|---|---|---|---|---|
| Outcomes | ||||||
| Death | 9 (29) | 19 (61.3) | 5 (16.1) | 15 (48.4) | 12 (38.7) | 4 (12.9) |
| Discharge | 8 (10.4) | 24 (31.2) | 7 (9.1) | 4 (5.2) | 26 (33.8) | 8 (10.5) |
| P-value | 0.016 c | 0.004 c | 0.292 c | < 0.001 b | 0.626 c | 0.742 b |
| Bleeding | ||||||
| Yes | 2 (18.2) | 5 (45.5) | 2 (18.2) | 1 (9.1) | 4 (36.4) | 1 (9.1) |
| No | 15 (15.5) | 38 (39.2) | 10 (10.3) | 18 (18.6) | 34 (35.1) | 11 (11.5) |
| P-value | 0.683 b | 0.687 c | 0.352 b | 0.685 b | > 0.99 b | > 0.99 b |
| Embolism severity | ||||||
| Mild | 12 (19) | 25 (39.7) | 5 (7.9) | 13 (20.6) | 26 (41.3) | 9 (14.5) |
| Moderate | 3 (11.5) | 11 (42.3) | 2 (7.7) | 5 (19.2) | 8 (30.8) | 2 (7.7) |
| Severe | 2 (10.5) | 7 (36.8) | 5 (26.3) | 1 (5.3) | 4 (21.1) | 1 (5.3) |
| P-value | 0.616 b | 0.933 c | 0.067 c | 0.295 c | 0.234 b | 0.524 b |
a Values are expressed as No. (%).
b Fisher exact Test.
c Pearson chi-square Test.
Table 2 presents the results of binary logistic regression for mortality and bleeding, as well as ordinal logistic regression for embolism severity.
| Variables | Mortality | Bleeding | Embolism Severity | ||||||
|---|---|---|---|---|---|---|---|---|---|
| B ± S.E | P-Value | OR (95% CI) | B ± S.E | P-Value | OR (95% CI) | B ± S.E | P-Value | 95% CI | |
| Diabetes | 0.85 ± 0.68 | 0.207 | 2.35 (0.62, 8.87) | 0.32 ± 0.88 | 0.713 | 1.38 (0.25, 7.68) | -0.47 ± 0.58 | 0.420 | (-1.61, 0.67) |
| Hypertension | 1.83 ± 0.63 | 0.004 | 6.23 (1.8, 21.6) | 0.09 ± 0.68 | 0.898 | 1.09 (0.29, 4.13) | -0.15 ± 0.41 | 0.713 | (-0.95, 0.65) |
| Stroke | 0.96 ± 0.78 | 0.221 | 2.61 (0.56, 12.17) | 0.6 ± 0.89 | 0.501 | 1.82 (0.32, 10.4) | 1.02 ± 0.6 | 0.087 | (-0.15, 2.2) |
| Cancer | 3.67 ± 0.8 | 0.000 | 39.42 (8.28, 187.75) | -0.94 ± 1.12 | 0.401 | 0.39 (0.04, 3.49) | -0.6 ± 0.56 | 0.279 | (-1.7, 0.49) |
| Surgery | -0.31 ± 0.62 | 0.614 | 0.73 (0.22, 2.47) | 0.26 ± 0.71 | 0.716 | 1.3 (0.32, 5.25) | -0.45 ± 0.44 | 0.307 | (-1.32, 0.42) |
| Pelvic fracture | 1.43 ± 0.86 | 0.094 | 4.2 (0.78, 22.5) | -0.48 ± 1.17 | 0.683 | 0.62 (0.06, 6.11) | -0.89 ± 0.74 | 0.231 | (-2.35, 0.57) |
| Constant | -2.98 ± 0.6 | 0.000 | 0.05 (0, 0) | -2.26 ± 0.52 | 0.000 | 0.1 (0, 0) | - | - | - |
| Severity = mild | - | - | - | - | - | - | -0.06 ± 0.31 | 0.842 | (-0.66, 0.54) |
| Severity = moderate | - | - | - | - | - | - | 1.23 ± 0.34 | 0.000 | (0.57, 1.89) |
Abbreviations: B, regression coefficient; S.E, standard error; OR, odds ratio.
4.1. Mortality
The odds ratio (OR) of 2.35 (95% CI: 0.62 - 8.87) indicates a higher risk of mortality for patients with diabetes, though this effect is not statistically significant (P = 0.207). Hypertension significantly increases the risk of mortality, with an OR of 6.23 (95% CI: 1.8 - 21.6) and P = 0.004, demonstrating a strong association with mortality. While stroke shows an elevated odds of mortality (OR = 2.61, 95% CI: 0.56 - 12.17), the association is not statistically significant (P = 0.221). Cancer is a significant predictor of mortality, with an OR of 39.42 (95% CI: 8.28 - 187.75) and P < 0.001, indicating a substantial increase in the risk of death. The OR for surgery is 0.73 (95% CI: 0.22 - 2.47), suggesting no significant effect on mortality (P = 0.614). The OR of 4.2 (95% CI: 0.78 - 22.5) suggests an increased risk of mortality for patients with pelvic fractures, but the association is not statistically significant (P = 0.094).
4.2. Bleeding
None of the variables, including diabetes, hypertension, stroke, cancer, surgery, or pelvic fracture, were significantly associated with bleeding, as all P-values exceeded 0.05, indicating no meaningful relationship between these conditions and the risk of bleeding.
4.3. Embolism Severity
Diabetes showed no significant effect on embolism severity, with B = -0.47, P = 0.420, and a 95% CI of -1.61 to 0.67. Similarly, no significant association was found between hypertension and embolism severity (B = -0.15, P = 0.713, CI: -0.95 to 0.65). Stroke demonstrated a trend toward increasing embolism severity (B = 1.02, P = 0.087), though this association was not statistically significant. Cancer did not significantly affect embolism severity (B = -0.6, P = 0.279, CI: -1.7 to 0.49). Neither surgery nor pelvic fracture showed a statistically significant impact on embolism severity, with P-values greater than 0.05. The model suggested a significant difference between moderate and severe embolism severity, with B = 1.23 and P < 0.001, indicating that moderate embolism is significantly more likely to progress to severe embolism.
In summary, hypertension and cancer emerged as significant predictors of mortality, while other variables did not show statistically significant relationships with mortality, bleeding, or embolism severity.
The results of the chi-square test indicated no statistically significant correlation between death or bleeding and the drugs used, including warfarin and rivaroxaban (P > 0.05). The parameters S wave in Lead I, Q wave in Lead III, T wave in Lead III, Left bundle branch block (LBBB), and Right bundle branch block (RBBB) were also analyzed. Based on our findings, no significant association was identified between these parameters and the severity of embolism (Table 3).
| Variables | Severity of Embolism | P-Value | ||
|---|---|---|---|---|
| Mild | Moderate | Severe | ||
| Hospital length | 7.8 ± 4.6 | 9.2 ± 7.1 | 7.9 ± 6.03 | 0.653 b |
| Death | 20 (31.7) | 9 (34.6) | 2 (10.5) | 0.150 c |
| S1 | 21 (33.3) | 15 (57.7) | 14 (73.7) | 0.003 c |
| Q3 | 38 (60.3) | 19 (73.1) | 17 (89.5) | 0.048 c |
| T3 | 51 (81) | 24 (92.3) | 19 (100) | 0.070 d |
| Arrhythmia | 6 (9.5) | 4 (15.4) | 1 (5.3) | 0.613 d |
| LBBB | 2 (3.2) | 0 (0) | 0 (0) | > 0.99 d |
| RBBB | 2 (3.2) | 2 (7.7) | 1 (5.3) | 0.569 d |
Abbreviations: LBBB, left bundle branch block; RBBB, right bundle branch block.
a Values are expressed as No. (%) or mean ± SD.
b Kruskal-Wallis H test.
c Pearson chi-square test.
d Fisher exact test.
According to our results, the frequency of prescribed medicines in PE patients was 60% for rivaroxaban, 9% for apixaban, 14% for warfarin, and 17.5% for enoxaparin.
5. Discussion
In the current study, the most common clinical presentations were dyspnea, observed in 95% of PE patients, followed by chest pain and hypoxia, each found in 45% of patients. The lowest frequency of clinical manifestations included blood sputum, reported at 6%, and hypotension and fever, each occurring in 13% of patients. Consistent with these findings, Morrone and Morrone identified shortness of breath, tachypnea, and chest pain as the most common symptoms of PE, while syncope, cough, and blood sputum were less frequent. They also noted fever as an uncommon pulmonary sign in these patients (9).
In our study, the highest frequency of deaths was associated with stroke, tumor, and cancer among deceased patients. Supporting these results, a growing body of evidence has demonstrated a strong correlation between cancer, stroke, and PE occurrence. Ucgun et al. reported that the most common causes of death in PE patients include cancer, malignant tumors, cardiovascular disorders, and postoperative conditions (10).
Biedka et al. further noted that advanced-stage acute diseases are strongly linked to various types of PE. Many cancer patients experience coagulation disorders, an activated coagulation cascade, and platelet aggregation. Pulmonary thromboembolism is a frequent complication in these patients and is exacerbated by surgery, chemotherapy, radiotherapy, and disease progression (11).
Based on the results, a significant relationship was observed between underlying diseases such as diabetes, hypertension, and cancer and the PE mortality rate (P < 0.05). Hypertension was also significantly associated with the frequency of bleeding (P < 0.05). Similarly, Jimenez-Garcia et al. demonstrated that patients with type 2 diabetes suffering from hypertension, cardiovascular disorders, and obesity had a higher risk of developing pulmonary thrombosis compared to non-diabetic individuals. The prevalence of PE in men and women with type 2 diabetes was reported to be higher than in non-diabetic patients (12).
The incidence and mortality rates were notably higher in PE patients with cancer. Compared to non-cancer subjects, patients with cancer exhibited increased mortality rates resulting from PE (13, 14). Additionally, no significant relationship was found between death, bleeding, and the type of medication used (P > 0.05). Moutzouris et al. indicated that warfarin users experienced lower mortality rates and fewer side effects compared to those who did not take warfarin (15).
In our study, rivaroxaban was the most frequently prescribed medication. Rivaroxaban is the first new oral anticoagulant (NOAC) approved for the treatment of acute DVT and PE. Furthermore, a 50% reduction in bleeding has been reported in patients receiving rivaroxaban (16, 17).
5.1. Conclusions
The most commonly consumed anticoagulant among PE patients was rivaroxaban, with no major bleeding events reported with its use. The increased mortality rate was strongly associated with underlying diseases, including cancer and malignant tumors. However, the consumption of anticoagulants was shown to reduce the mortality percentage in these patients.
