


1. Background
Volleyball is a fast-paced sport that involves short, intense, and explosive movements, requiring high agility and coordination (1, 2). These physical demands place considerable stress on the shoulder joint, making it particularly vulnerable to injury, especially in athletes (2, 3). Previous studies have shown that volleyball players are commonly affected by upper extremity injuries, often resulting from repetitive overhead motions such as spiking, serving, and blocking (4, 5). These actions lead to musculoskeletal adaptations that contribute to imbalances, particularly in the shoulder’s internal and external rotation, thereby increasing the risk of injury (5, 6). Although lower extremity injuries account for the majority of all volleyball-related injuries, upper extremity and head/neck injuries follow closely behind (7). Strains and sprains are the most frequent injury types, underscoring the importance of injury prevention strategies focused on proper technique and conditioning (6). Volleyball players, especially females, are at heightened risk, with data indicating that around 131,624 upper extremity injuries were reported among players during a study period (8). Common mechanisms of injury in this demographic include impacts with the floor, collisions with other players, and contact with the ball (2, 5). Addressing these injury patterns is critical, as volleyball plays a crucial role in physical and emotional development (5). It not only provides an avenue for physical activity but also promotes psychosocial health and self-esteem (2). Therefore, effective injury prevention and management strategies are essential to ensure the safety and well-being of young athletes participating in the sport.
Inter-limb upper extremity asymmetry plays a crucial role in assessing athletic performance and injury risk, particularly in overhead sports like volleyball (9). Research suggests that differences in function between limbs, referred to as inter-limb asymmetry, can significantly impact an athlete’s overall functional capacity (10). However, the lack of a universally accepted definition complicates its measurement (11). Keeley and Grant define inter-limb asymmetry as the performance difference between limbs, distinguishing it from intra-limb asymmetry, which focuses on imbalances within a single limb (12). Various methodologies have been developed to quantify inter-limb asymmetry, leading to a range of approaches across studies (13, 14). Some studies assess asymmetry using unilateral strength tests, such as isometric squats and single-leg jumps, while others employ global symmetry indices to analyze center of mass trajectories during movement (15). This variability in measurement techniques creates challenges for practitioners, as there is often no clear justification for selecting one calculation method over another (16). Bishop et al. highlighted this "calculation conundrum," emphasizing the importance of choosing appropriate formulas based on the context of each study (17). Functional performance tests for the upper extremities, such as the Y-balance test upper quarter (YBT-UQ) and the closed kinetic chain upper extremity stability test (CKCUEST), are commonly used to assess dynamic stability in athletes engaged in both open and closed kinetic chain activities (18). These tests are particularly relevant for overhead sports, providing valuable insights into an athlete's functional capacity and injury risk.
2. Objectives
This study aims to examine the relationship between upper extremity inter-limb asymmetry, as measured by the YBT, seated single arm shot put test, and CKCUEST, and the occurrence of sports injuries in volleyball players. The primary hypothesis posits that greater asymmetry between the dominant and non-dominant upper limbs is associated with an increased risk of injuries in these athletes.
3. Methods
3.1. Study Design and Participants
This research is a prospective study conducted over 9 months from 2023 to 2024 in Kermanshah. The study aimed to investigate predictors related to neuromuscular asymmetry and athletic identity in the occurrence of sports injuries in volleyball players and to analyze the relationship between these factors and sports injuries. Using the Peduzzi et al. (1996) formula for logistic regression sample size, [N = 10 k/p], we calculated that a study with 3 independent variables and a 31% positive case proportion requires 100 subjects. The participants consisted of 101 amateur and professional volleyball players from Kermanshah, aged between 18 and 45 years, who were purposefully selected between June and September 2023. These individuals regularly participated in volleyball practices and competitions and were categorized into two groups based on their competitive level: Amateur and professional. Inclusion criteria included being 18 years or older, participating at a competitive level, and regular involvement in volleyball. Exclusion criteria included pregnancy, anterior cruciate ligament injury, joint surgery or replacement, and failure to complete the research questionnaires.
3.2. Baseline Assessments
An online questionnaire was designed based on previous studies using Google Forms to collect personal information, exercise routines, and injury history. This electronic questionnaire link was sent to the volleyball players through communication tools (WhatsApp, Telegram, Instagram, and email), and participants completed it. The questionnaire gathered details such as height, weight, playing level, playing position, training duration and frequency per week, warm-up practices, and use of protective equipment. It also included questions about injury history to gather sufficient data on previous injuries. After completing the initial questionnaire, participants filled out a sports identity questionnaire. They then participated in tests to assess limb symmetry, including the YBT-UQ, seated single arm shot put test, and the CKCUEST for the upper limbs. These tests were conducted for both the dominant and non-dominant limbs, with each limb being tested three times. The best performance from each test was used for statistical analysis. Subsequently, participants were informed that every two weeks, a link to a questionnaire would be sent to track and report sports injuries. They were required to fill out this injury tracking form for a period of 9 months. At the end of data collection, all information was documented in the relevant forms to be used in the statistical analysis of the study.
3.3. Upper Quarter YBT
Participants began in a push-up position with their feet placed shoulder-width apart. From this stance, they reached with their free hand in three directions: Medial (MED), inferolateral (IF), and superolateral (SL). Each direction was performed without interruption, while maintaining the push-up position with the opposite arm. If a participant lost their push-up position, pushed the indicator out of reach, or lost three-point contact with the surface, the trial was stopped. After each trial, a 30-second rest was allowed before the next one began. Each participant performed three trials starting with their right arm as the stance arm, followed by the same procedure with the left arm. The best score from each direction was recorded for analysis. The composite score (CS) was calculated as the average of the maximum distances reached in all three directions, with all scores normalized according to upper limb length (19).
3.4. CKCUEST
For the CKCUEST, participants were positioned in a push-up stance with their lower limbs extended and arms placed perpendicular at a distance of 92 cm. Participants alternately tapped their opposite hand as quickly as possible for 15 seconds. The number of touches within the 15-second period was recorded. Four attempts were allowed, with a 30-second rest interval between each; the first attempt was for practice, and the average of the last three attempts was used for analysis. Men performed the test in the push-up position with their lower limbs extended, while women performed the test in the same position but with their lower limbs flexed. If the participant failed to reach the predetermined marker or left the position, the repetition was considered invalid (20).
3.5. Seated Single Arm Shot Put Test
For the test, participants were seated with their backs against the wall, knees bent at a right angle, and feet resting on the floor. They were positioned to allow free movement of the arm on the affected side. In this position, participants were instructed to hold a 3 kg ball in the hand of the affected shoulder at shoulder level and then push the ball as far forward as possible without compensating with their body. For familiarization, two practice trials were conducted at 75% and 100% of the participant's maximum capacity, with a one-minute rest between each. Afterward, the first examiner independently conducted the test, instructing the participant to perform the test three times at their maximum capacity, using verbal encouragement and allowing a one-minute rest between repetitions. The mean of the three repetitions was used for statistical calculations (21).
3.6. Follow-up of Sports Injuries
In this study, sports injuries are recorded online through a pre-designed Google Form questionnaire. A sports injury is defined as any physical complaint experienced by a volleyball player as a result of participating in volleyball, regardless of whether medical attention is required or if it leads to time lost from play. Traumatic injuries are those that occur suddenly with a specific cause, while overuse injuries are caused by microtrauma without a clear cause. The location, type, mechanism, and severity of the injury are recorded. The player is considered injured until the medical staff clears them to participate in training or competition (22). According to Fuller et al. (22), injury severity is graded based on the number of days the player is absent from practice or matches: 1 - 3 days (minor injury), 4 - 7 days (mild injury), 8 - 28 days (moderate injury), and more than 28 days (severe injury).
3.7. Statistical Analyses
Data analysis was performed using SPSS software, version 27. Both descriptive and inferential statistical methods were utilized for data analysis. Initially, an independent t-test and chi-square test were conducted to compare inter-limb symmetry in the YBT-UQ, seated single arm shot put test, and the CKCUEST between volleyball players with and without injuries. To assess the relationship between these variables and sports injuries, univariate logistic regression was applied. All analyses were carried out at a significance level of P ≤ 0.05.
4. Results
During a nine-month follow-up period, 38 out of 101 volleyball players (20.8%) sustained a total of 51 new injuries, resulting in an average of 1.34 injuries per player. The overall injury incidence rate for this period was 4.01 injuries per 1000 hours of play, based on 12,726 hours of practice and competition. Of these injuries, 56.7% were classified as acute, with an incidence rate of 2.28 injuries per 1000 hours of play. The remaining 43.3% were overuse injuries, with a chronic injury incidence rate of 1.73 injuries per 1000 hours of play.
As shown in Figure 1, most sports injuries in volleyball players affect the ankle and Achilles (17.64%), hand and fingers (each 17.64%), and the shoulder and scapula (13.7%).

Percentage of frequency of sports injuries according to the location of the injury
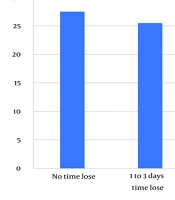
Figure 2 illustrates that the majority of sports injuries, approximately 27.5%, are very mild and do not result in any absence from training sessions. Following this, 25.5% of injuries lead to 1 to 3 days of missed training. The percentage of more severe injuries decreases significantly, with only 9.8% of injuries causing absences of more than 4 weeks.
")
Percentage of frequency of sports injuries according to severity of injury (time lost)
The study revealed no significant differences between injured and non-injured volleyball players regarding demographic factors such as gender, age, height, weight, body mass index (BMI), sports experience, weekly session frequency, and session duration (P > 0.05). However, a significant difference was observed in the history of previous injuries, with a higher proportion of injured players reporting past injuries compared to their non-injured counterparts (P = 0.04). No significant difference was found between the two groups concerning participation in other sports (P > 0.05) (Table 1).
| Variables | Injured Volleyball Players (n = 38) | Non-injured Volleyball Players (n = 63) | Statistic Tests | P-Value |
|---|---|---|---|---|
| Gender | χ2 = 0.29 | 0.82 | ||
| Female | 24 (63.2) | 38 (60.3) | ||
| Male | 14 (36.8) | 25 (39.7) | ||
| Age (y) | 27.14 ± 9.33 | 27.66 ± 9.45 | t = 0.29 | 0.79 |
| Height (cm) | 182.78 ± 9.23 | 182.45 ± 10.99 | t = 0.15 | 0.89 |
| Weight (kg) | 71.56 ± 9.23 | 73.02 ± 10.84 | t = 0.67 | 0.50 |
| Body mass index (kg/m2) | 21.35 ± 1.75 | 21.93 ± 2.50 | t = 1.21 | 0.21 |
| Sport experience (y) | 9.36 ± 6.27 | 9.05 ± 6.36 | t = 0.24 | 0.80 |
| Weekly sessions; median (IQR) | 3 (1) | 4 (2) | Z = 0.92 | 0.36 |
| Session duration (minutes/session); median (IQR) | 60 (15) | 60 (15) | Z = 0.62 | 0.53 |
| Participation in other sports (yes) | 18 (47.4) | 24 (38.1) | χ2 = 3.13 | 0.10 |
| Previous injury history (yes) | 16 (42.1) | 14 (22.2) | χ2 = 4.21 | 0.04 |
Comparison of Participant Demographics Between Injured and Non-injured Volleyball Players a
The comparison of upper quarter tests between injured and non-injured players revealed no significant differences in the YBT-UQ for medial, inferolateral, or superolateral directions (all P > 0.05). However, injured players demonstrated significantly greater inter-limb differences and asymmetries in the seated single arm shot put test (P = 0.02 and P = 0.03, respectively) and the CKCUEST (P = 0.03 for both measures). These findings suggest that inter-limb discrepancies in strength and stability are associated with injury status (Table 2).
| Test | Injured Players (n = 38) | Non-injured Players (n = 63) | P-Value |
|---|---|---|---|
| YBT-UQ | |||
| Medial direction | |||
| Inter-limb difference (cm) | 2.71 ± 6.67 | 3.12 ± 2.39 | 0.52 |
| Inter-limb asymmetry (%) | 2.48 ± 1.41 | 2.97 ± 2.40 | 0.45 |
| Inferolateral direction | |||
| Inter-limb difference (cm) | 2.94 ± 1.75 | 3.1 ± 2.68 | 0.85 |
| Inter-limb asymmetry (%) | 3.02 ± 1.75 | 3.1 ± 2.65 | 0.96 |
| Superolateral direction | |||
| Inter-limb difference (cm) | 3.70 ± 2.47 | 2.97 ± 2.97 | 0.32 |
| Inter-limb asymmetry (%) | 4.92 ± 3.25 | 3.91 ± 3.41 | 0.29 |
| Seated single arm shot put test | |||
| Inter-limb difference (cm) | 17.83 ± 9.37 | 12.18 ± 8.69 | 0.02 |
| Inter-limb asymmetry (%) | 7.78 ± 2.71 | 3.63 ± 2.56 | 0.03 |
| CKCUEST | |||
| Inter-limb difference (cm) | 3.08 ± 1.93 | 2.2 ± 1.74 | 0.03 |
| Inter-limb asymmetry (%) | 10.24 ± 5.91 | 7.52 ± 5.64 | 0.03 |
Comparison of Inter-limb Asymmetry in Y-Balance Test Upper Quarter, Seated Single Arm Shot Put Test, and the Closed Kinetic Chain Upper Extremity Stability Test Between Injured and Non-injured Volleyball Players a
The provided table presents logistic regression analyses examining the relationship between inter-limb differences and asymmetries in various tests and their association with injury risk. Key findings indicate that neither inter-limb differences nor asymmetries significantly predicted injury risk. Specifically, in the seated single arm shot put test, a 1 cm increase in inter-limb difference resulted in a non-significant odds ratio of 1.05 [95% confidence intervals (CI): 0.91 - 1.21] with a P-value of 0.51. Similarly, in the CKCUEST, a 1 cm increase had an odds ratio of 1.82 (95% CI: 0.68 - 4.89), which was not statistically significant (P = 0.24). Additionally, inter-limb asymmetries showed non-significant odds ratios, with P-values exceeding 0.05. Overall, these analyses suggest that neither inter-limb differences nor asymmetries significantly predicted injury risk (Table 3).
| Variables | B | S.E. | Wald | OR (95% CI) | P-Value |
|---|---|---|---|---|---|
| Seated single arm shot put test | |||||
| Inter-limb difference (cm) | 0.05 | 0.07 | 0.44 | 1.05 (0.91 - 1.21) | 0.51 |
| Inter-limb asymmetry (%) | 0.19 | 0.25 | 0.01 | 1.02 (0.63 - 1.66) | 0.94 |
| CKCUEST | |||||
| Inter-limb difference (cm) | 0.60 | 0.51 | 1.40 | 1.82 (0.68 - 4.89) | 0.24 |
| Inter-limb asymmetry (%) | -0.10 | 0.16 | 0.42 | 0.91 (0.66 - 1.23) | 0.51 |
Univariate Logistic Regression Analysis for Predicting Sports Injuries Based on Inter-limb Asymmetry in Volleyball Players
5. Discussion
The results indicate that while the YBT-UQ did not show significant differences between injured and non-injured players, the seated single arm shot put test and the CKCUEST highlighted notable disparities. Specifically, injured players exhibited significantly greater inter-limb differences and asymmetries in these tests, suggesting that these measures may better capture functional imbalances related to injury risk. The lack of significant findings in the YBT-UQ may indicate that this test is less sensitive to the specific deficits linked to upper extremity injuries in this population. Conversely, the seated single arm shot put test, which emphasizes strength and power, and the CKCUEST, which assesses dynamic stability and coordination, appear to reflect imbalances that could predispose athletes to injury or emerge as a consequence of injury.
Our study's injury incidence rate of 4.01 injuries per 1000 hours of play aligns closely with previous research, though variations exist across studies. Augustsson et al. (23) reported a slightly higher rate of 4.91 injuries per 1000 hours, while McGuine et al. (24) documented a higher rate of 5.31 injuries per 1000 hours. Conversely, Verhagen et al. (25) found a lower incidence rate of 2.6 injuries per 1000 hours. These differences may be attributed to variations in sample size, study duration, and injury reporting methodologies. Despite these variations, our findings provide valuable insight into injury prevalence in volleyball, contributing to a better understanding of injury risk in this sport.
In our study, most sports injuries in volleyball players affect the ankle, wrist, and fingers (each 17.64%), as well as the shoulder and scapula (13.7%). These findings are consistent with previous research. Augustsson et al. (23) reported a high prevalence of ankle, knee, and lower back injuries, with ankle injuries being the most common at 23%. Verhagen et al. (25) noted that acute injuries were primarily ankle sprains, with 41 cases, and a significant proportion of players had a history of previous ankle sprains. Additionally, overuse injuries were associated with back and shoulder areas. Cunado-Gonzalez et al. (26) also found that ankle, knee, and shoulder injuries were predominant, with ligament sprains, tendinopathy, and muscle-tendon strains occurring frequently during volleyball activities such as blocking and attacking. Together, these studies underscore the consistent pattern of injury distribution in volleyball, highlighting the need for targeted injury prevention strategies for these specific regions.
Our study found that comparison of upper quarter tests between injured and non-injured players revealed no significant differences in the YBT-UQ for medial, inferolateral, or superolateral directions (all P > 0.05). However, injured players demonstrated significantly greater inter-limb differences and asymmetries in the seated single arm shot put test (P = 0.02 and P = 0.03, respectively) and the CKCUEST (P = 0.03 for both measures). These findings align with previous research by Pontillo et al. (27), which found that inter-limb differences in tests like the CKCUEST were associated with injury status. However, our results do not fully align with studies such as Brumitt et al. (28), which found no significant relationship between the YBT-LQ and injury risk in female university volleyball players. Thus, while some tests show consistent results across studies, others reveal discrepancies in the findings.
The findings highlight the importance of assessing inter-limb differences and asymmetries in upper-body strength and stability for injury prevention in volleyball players. Coaches and sports professionals should focus on regular monitoring and targeted interventions for athletes with greater inter-limb discrepancies, particularly through exercises such as the seated single arm shot put test and the CKCUEST. These assessments can help identify players at higher risk of injury, allowing for early intervention and the development of personalized training programs to reduce the likelihood of acute and overuse injuries. Additionally, incorporating balance and stability exercises into regular training routines can contribute to improving overall player safety and performance.
5.1. Limitations
The study presents several limitations, including a relatively small sample size, which limits the generalizability of the findings. Additionally, the study focuses exclusively on volleyball players, which may restrict the applicability of the results to other sports populations. The lack of long-term evaluations of inter-limb differences and their impact on sports injury occurrence further limits the comprehensiveness of the findings. Furthermore, reliance on self-reported data and the absence of control over other influencing variables, such as overall physical condition and psychological factors, may affect the accuracy and reliability of the results.
To address these limitations, future research should include larger and more diverse samples and investigate the long-term effects of inter-limb differences on injury occurrence. Incorporating more precise control over individual and psychological variables, along with advanced measurement tools, could enhance the accuracy and reliability of findings. Future studies should also explore the impact of corrective exercises in reducing inter-limb asymmetry, assess their long-term influence on injury rates, and examine the role of psychological factors. Conducting similar studies across different sports would further expand understanding, and examining functional differences in various conditions of the YBT could improve injury prediction.
The statistical analysis included logistic regression models to control for potential confounders, such as age, experience level, and previous injury history. Adjusted odds ratios (OR) with 95% CI were calculated for each test, providing more precise estimates of the association between inter-limb asymmetries and injury risk. To minimize potential bias, all measurements were made by the same trained personnel to ensure consistency and reduce measurement bias. Additionally, we adjusted for potential confounders, such as previous injury history, using appropriate statistical methods. To account for attrition bias, we closely monitored participant retention and conducted an intention-to-treat analysis to assess the impact of dropouts. These steps were implemented to enhance the internal validity and reliability of our findings.
5.2. Conclusions
Over a nine-month period, 20.8% of 101 volleyball players sustained 51 new injuries, with an injury incidence rate of 4.01 per 1000 hours of play. Acute injuries comprised 56.7%, and overuse injuries accounted for 43.3%, with incidence rates of 2.28 and 1.73 per 1000 hours, respectively. Comparisons between injured and non-injured players showed no significant differences in YBT-UQ scores. However, injured players exhibited greater inter-limb differences and asymmetries in the seated single arm shot put test and CKCUEST, highlighting a link between inter-limb discrepancies and injury risk.
The study underscores the importance of evaluating inter-limb differences and asymmetries in upper-body strength and stability to reduce injury risk in volleyball players. Assessing tests such as the seated single arm shot put test and CKCUEST can help identify players at higher risk of injury, enabling targeted interventions and personalized training programs to enhance player safety and performance.
