


1. Background
Chronic kidney disease (CKD) is a progressive disorder characterized by the gradual and irreversible decline in renal structure and function, culminating in kidney failure if left unmanaged (1). It is diagnostically defined by the presence of kidney damage evidenced by pathological abnormalities or markers of dysfunction and/or a sustained reduction in glomerular filtration rate (GFR) to below 60 mL/min per 1.73 m2 for a duration exceeding three months (2). This dual criterion (structural impairment and functional decline) underpins the staging and classification of CKD severity, which informs clinical prognosis and therapeutic strategies. The disease's chronicity and progression are marked by persistent pathological changes that compromise the kidneys' filtration, regulatory, and excretory capacities over time (1, 2).
In this regard, ultrasound is a noninvasive and inexpensive examination method with sufficient anatomical details to diagnose kidney diseases without exposing the patient to radiation or contrast (3-5). Early detection and prediction of renal function tests are essential for therapeutic decision-making. Ultrasound identifies the length, thickness, and echogenicity of the renal parenchyma in addition to its role in examining the dilated collecting system (6). These details help to identify the extent of renal parenchymal damage and its reversibility (7, 8) and the decision to perform a kidney biopsy (9). According to a study, abnormal ultrasonographic findings were observed in 67% of CKD cases (10), and in another study, renal echogenicity increased in interstitial fibrosis and glomerulosclerosis due to the presence of collagen (11). Renal morphology can be determined by a number of methods, including measurement of renal length and volume and renal cortical thickness. There has been a significant association between renal length or cortical echogenicity and glomerular sclerosis or tubular atrophy (12). Renal function can also be assessed by renal length and cortical thickness, and important clinical decisions can be made based on these measurements. Therefore, serial ultrasonographic evaluations are performed to determine whether renal disease is progressing or normal (13). Although renal parenchymal volume is a fairly accurate measurement in patients with end-stage renal disease (ESRD), measurement of the longitudinal length of the kidney is sufficient in normal patients (14).
Given the importance of CKD and its diagnosis, and considering that ultrasound is a good method for diagnosing renal failure and disease progression, it is important to investigate the relationship between renal echogenicity and other sonographic parameters with renal function, such as serum creatinine (Cr) level and GFR (15-20).
2. Objectives
Since no comprehensive study has been conducted in this field in this area so far, the aim of the present study was to investigate the correlation between ultrasound findings and serum Cr level in CKD patients referred to the Radiology Department from the Nephrology Ward of Ali bin Abi Taleb (AS) Hospital in Zahedan in the year 2024.
3. Methods
This cross-sectional study was conducted on patients with CKD at Ali Ebn Abi Talib Hospital in Zahedan, Iran, during 2024. The study population consisted of patients referred to the ultrasound department who were diagnosed with CKD and had a GFR of less than 60 mL/min/1.7 m2. This group was selected to reflect individuals with impaired renal function. Patients aged between 18 and 75 years were eligible for inclusion. Patients with underlying kidney diseases, such as polycystic kidney disease or nephrocalcinosis, were excluded. Additionally, those with severe ascites, fatty liver, or undergoing hemodialysis or peritoneal dialysis were not included. Other exclusion criteria included individuals with a history of kidney surgery, traumatic kidney injury, or kidney transplantation, as well as patients with only one kidney.
3.1. Sampling and Sample Size
The sample size was calculated based on data from previous studies, specifically using a correlation coefficient (r) of 0.4, as reported in prior research (2). Considering type I and type II errors set at 5% and 20%, respectively, the minimum required sample size was determined to be 47 participants. To account for potential attrition (estimated at 25%), the sample size was increased to 60 patients, ensuring sufficient power for statistical analysis. An easy and accessible sampling method was employed, meaning participants were selected based on their availability and willingness to participate, provided they met the inclusion criteria and did not meet the exclusion criteria.
3.2. Data Collection Method and Tools
Data collection was conducted via direct observation, with all relevant clinical and demographic information systematically recorded using a structured data collection form. Ultrasound imaging parameters, including echogenicity grade, cortical thickness, parenchymal thickness, and kidney length, were meticulously documented for each participant. To account for potential confounding variables, anthropometric measurements such as height were also obtained. Additionally, venous blood samples were collected from all participants to assess serum Cr levels. Glomerular filtration rate was subsequently calculated using the Cockcroft-Gault formula to evaluate renal function.
3.3. Design Implementation Method
This study was initiated following approval from the Research Council of the Faculty of Medicine at Zahedan University of Medical Sciences, along with formal ethical clearance (ethics code: IR.ZAUMS.REC.1403.324). Eligible patients with CKD, defined by a GFR < 60 mL/min/1.73 m2, were recruited from the ultrasound department of Ali Ebn Abi Taleb Hospital. Participants were enrolled after confirming compliance with inclusion criteria and absence of exclusion factors. Renal ultrasound examinations were performed by a trained radiology resident using a GE Voluson E6 ultrasound system equipped with a curvilinear transducer (3.5 - 5 MHz), operating in standardized B-mode and grayscale imaging. Key sonographic parameters — including echogenicity grade, cortical thickness, parenchymal thickness, and kidney length — were systematically evaluated. Anthropometric data (height) and biochemical markers (serum Cr levels, measured via venous blood sampling) were concurrently recorded. Glomerular filtration rate was derived using the Cockcroft-Gault formula to assess renal function, and all data were documented in a structured case report form.
3.4. Statistical Analysis
All analyses were performed using statistical package for the social sciences (SPSS) version 22. Continuous variables were expressed as mean ± standard deviation (SD), while categorical variables were presented as frequencies and percentages. The normality of quantitative variables was assessed using the Kolmogorov-Smirnov (K.S) test. To compare Cr and GFR measurements across different echogenicity grades, the Kruskal-Wallis test was employed, followed by Dunn’s post-hoc test for pairwise comparisons. Spearman’s correlation analysis was performed to evaluate the association between kidney ultrasound indices (cortical thickness, parenchymal thickness, and kidney length) and serum Cr levels. A multiple linear regression model was used to examine the simultaneous effects of demographic variables (age, gender, and height) and ultrasound indices on serum Cr levels in patients with CKD. Regression coefficients (β) along with standard errors (SE), confidence intervals (CI), and P-values were reported. A P-value < 0.05 was considered statistically significant.
4. Results
Based on the normality test results, Cr and GFR do not have a normal distribution (P < 0.001 and P = 0.006, respectively). Among the patients with CKD, 46.6% were male (n = 28) and 53.4% were female (n = 32). Regarding age, 45% of the patients were under 60 years old, while 55% were over 60 years old. The mean age was 64 ± 11.1 years.
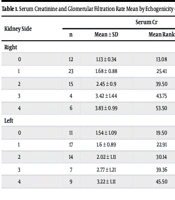
Table 1 presents the mean serum Cr and GFR across different echogenicity grades in the right and left kidneys of patients with CKD. In the right kidney, serum Cr levels increased with higher echogenicity grades, with differences across grades being statistically significant (P = 0.001). Glomerular filtration rate values declined as echogenicity grade increased, with this decreasing trend being highly significant (P < 0.001). In the left kidney, serum Cr levels also increased with higher echogenicity grades, with variation across grades being statistically significant (P = 0.002). Glomerular filtration rate in the left kidney demonstrated a significant decline with increasing echogenicity grade, with this trend being statistically significant (P = 0.013).
| Kidney Side | Serum Cr | GFR | |||||
|---|---|---|---|---|---|---|---|
| n | Mean ± SD | Mean Rank | P-Value | Mean ± SD | Mean Rank | P-Value | |
| Right | 0.001 | < 0.001 | |||||
| 0 | 12 | 1.13 ± 0.34 | 13.08 | 52.58 ± 8.4 | 46.42 | ||
| 1 | 23 | 1.68 ± 0.88 | 25.41 | 43.2 ± 12.3 | 35.43 | ||
| 2 | 15 | 2.45 ± 0.9 | 39.50 | 32.2 ± 11.2 | 22.60 | ||
| 3 | 4 | 3.42 ± 1.44 | 43.75 | 28.1 ± 8.1 | 17.25 | ||
| 4 | 6 | 3.83 ± 0.99 | 53.50 | 18.4 ± 5 | 8.33 | ||
| Left | 0.002 | 0.013 | |||||
| 0 | 11 | 1.54 ± 1.09 | 19.50 | 46.59 ± 16.3 | 38.23 | ||
| 1 | 17 | 1.6 ± 0.89 | 22.91 | 42.9 ± 12.6 | 33.88 | ||
| 2 | 14 | 2.02 ± 1.11 | 30.14 | 41.6 ± 13.8 | 31.36 | ||
| 3 | 7 | 2.77 ± 1.21 | 39.36 | 27.6 ± 11.3 | 17.14 | ||
| 4 | 9 | 3.22 ± 1.11 | 45.50 | 27.3 ± 13.7 | 17.28 | ||
Abbreviations: GFR, glomerular filtration rate; Cr, creatinine.
Table 2 presents pairwise comparisons of Cr and GFR measurements in the right and left kidneys based on echogenicity grades. In the right kidney, significant differences in Cr levels were observed between grades 0 and 2 (Dunn = 26.417, adjusted P = 0.001), between grades 0 and 3 (Dunn = 30.667, adjusted p = 0.023), between grades 0 and 4 (Dunn = 40.417, adjusted P < 0.001), and between grades 1 and 4 (Dunn = 28.087, adjusted P = 0.004). For GFR, significant differences were found between grades 0 and 2 (Dunn = 23.817, adjusted P = 0.004), between grades 0 and 3 (Dunn = 29.167, adjusted P = 0.038), between grades 0 and 4 (Dunn = 38.083, adjusted P < 0.001), and between grades 1 and 4 (Dunn = 27.101, adjusted P = 0.007). In the left kidney, significant differences in Cr levels were observed between grades 0 and 4 (Dunn = 26, adjusted P = 0.006) and between grades 1 and 4 (Dunn = 22.588, adjusted P = 0.012). However, for GFR, no significant differences were detected, as all adjusted p-values exceeded the significance threshold.
| Grade I- Grade J | Dunn Value | P-Value | Adj. P-Value |
|---|---|---|---|
| Cr a | |||
| 0 - 1 | 12.33 | 0.047 | 0.471 |
| 0 - 2 | 26.417 | < 0.001 | 0.001 |
| 0 - 3 | 30.667 | 0.002 | 0.023 |
| 0 - 4 | 40.417 | < 0.001 | < 0.001 |
| 1 - 2 | 14.087 | 0.015 | 0.149 |
| 1 - 3 | 18.337 | 0.052 | 0.522 |
| 1 - 4 | 28.087 | < 0.001 | 0.004 |
| 2 - 3 | 4.25 | 0.665 | 1 |
| 2 - 4 | 14 | 0.096 | 0.965 |
| 3 - 4 | 9.75 | 0.386 | 1 |
| GFR a | |||
| 0 - 1 | 10.982 | 0.077 | 0.77 |
| 0 - 2 | 23.817 | < 0.001 | 0.004 |
| 0 - 3 | 29.167 | 0.004 | 0.038 |
| 0 - 4 | 38.083 | < 0.001 | < 0.001 |
| 1 - 2 | 12.835 | 0.027 | 0.266 |
| 1 - 3 | 18.185 | 0.054 | 0.543 |
| 1 - 4 | 27.101 | 0.001 | 0.007 |
| 2 - 3 | 5.35 | 0.586 | 1 |
| 2 - 4 | 14.267 | 0.09 | 0.904 |
| 3 - 4 | 8.917 | 0.428 | 1 |
| Cr b | |||
| 0 - 1 | 3.412 | 0.601 | 1 |
| 0 - 2 | 10.643 | 0.117 | 1 |
| 0 - 3 | 19.857 | 0.015 | 0.149 |
| 0 - 4 | 26 | 0.001 | 0.006 |
| 1 - 2 | 7.231 | 0.235 | 1 |
| 1 - 3 | 16.445 | 0.03 | 0.299 |
| 1 - 4 | 22.588 | 0.001 | 0.012 |
| 2 - 3 | 9.214 | 0.238 | 1 |
| 2 - 4 | 15.357 | 0.033 | 0.33 |
| 3 - 4 | 6.143 | 0.47 | 1 |
| GFR b | |||
| 0 - 1 | 4.345 | 0.506 | 1 |
| 0 - 2 | 6.87 | 0.312 | 1 |
| 0 - 3 | 21.84 | 0.01 | 0.097 |
| 0 - 4 | 20.949 | 0.006 | 0.057 |
| 1 - 2 | 2.525 | 0.678 | 1 |
| 1 - 3 | 16.739 | 0.027 | 0.271 |
| 1 - 4 | 16.605 | 0.017 | 0.169 |
| 2 - 3 | 14.214 | 0.069 | 0.686 |
| 2 - 4 | 14.079 | 0.051 | 0.507 |
| 3 - 4 | 0.135 | 0.987 | 1 |
Abbreviations: GFR, glomerular filtration rate; Cr, creatinine.
a Right kidney.
b Left kidney.
Table 3 shows that cortical thinning is strongly linked to impaired kidney function in CKD patients, with the right kidney showing a stronger association. In the right kidney, there was a moderate negative correlation between cortical thickness and serum Cr (r = -0.44, P = 0.001). Similarly, the left kidney exhibits a significant but weaker negative correlation (r = -0.36, P = 0.005). Kidney length also correlates with serum Cr, but this relationship varies by side and adjustment for height. The right kidney's unadjusted length shows a significant negative correlation with serum Cr (r = -0.41, P = 0.001), meaning shorter kidneys correlate with higher Cr levels, whereas the left kidney shows no significant correlation (r = -0.23, P = 0.1). After adjusting for height, the correlation in the right kidney becomes non-significant (r = -0.073, P = 0.61), and the left kidney remains non-significant (r = -0.23, P = 0.1). Additionally, parenchymal thickness does not have a significant correlation with serum Cr in either kidney (right: r = -0.167, P = 0.2; left: r = -0.107, P = 0.4).
| Ultrasonographic Indices | Right Kidney | Left Kidney | ||
|---|---|---|---|---|
| r | P-Value | r | P-Value | |
| Cortical thickness | -0.44 | 0.001 | -0.36 | 0.005 |
| Parenchymal thickness | -0.167 | 0.2 | -0.107 | 0.4 |
| Kidney length (without height control) | -0.41 | 0.001 | -0.23 | 0.1 |
| Kidney length (with adjusting for height) | -0.073 | 0.61 | -0.23 | 0.1 |
Table 4 shows how demographic factors and ultrasound indices impact serum Cr levels in CKD patients. For the right kidney, the regression model indicates that age, kidney grade, and GFR are significant predictors of serum Cr levels. Specifically, each additional year in age is associated with an increase of 0.015 in Cr (SE = 0.006, 95% CI: 0.003 to 0.028, P = 0.017). Similarly, a one-unit increase in the right kidney grade is linked to a 0.21 increase in Cr (SE = 0.082, 95% CI: 0.047 to 0.37, P = 0.013). Notably, GFR showed a strong inverse association with serum Cr, with a coefficient of -0.062 (SE = 0.006, 95% CI: -0.074 to -0.05, P = 0.0001). In the left kidney model, age, kidney grade, and GFR were also significant predictors of serum Cr. Each additional year of age was associated with an increase of 0.019 in Cr (SE = 0.007, 95% CI: 0.005 to 0.033, P = 0.009). The left kidney grade has a notably higher impact with a coefficient of 0.41 (SE = 0.082, 95% CI: 0.047 to 0.57, P = 0.009), and GFR shows a strong negative relationship (β = -0.072, SE = 0.006, 95% CI: -0.083 to -0.061, P = 0.0001).
| Variables | β | SE | CI | P-Value |
|---|---|---|---|---|
| Right kidney | ||||
| Gender | ||||
| Female | -0.257 | 0.16 | -0.069 to -0.58 | 0.119 |
| Male | 1 | - | - | - |
| Age | 0.015 | 0.006 | 0.003 to 0.028 | 0.017 |
| Grade | 0.21 | 0.082 | 0.047 to 0.37 | 0.013 |
| Cortical thickness | -0.02 | 0.034 | -0.048 to 0.089 | 0.55 |
| Parenchymal thickness | -0.014 | 0.015 | -0.045 to 0.017 | 0.38 |
| GFR | -0.062 | 0.006 | -0.074 to -0.05 | 0.0001 |
| Height | 0.009 | 0.009 | -0.01 to 0.028 | 0.33 |
| Length | 0.009 | 0.007 | -0.006 to 0.024 | 0.21 |
| Left kidney | ||||
| Gender | ||||
| Female | -0.32 | 0.17 | -0.029 to -0.68 | 0.071 |
| Male | 1 | - | - | - |
| Age | 0.019 | 0.007 | 0.005 to 0.033 | 0.009 |
| Grade | 0.41 | 0.082 | 0.047 to 0.57 | 0.009 |
| Cortical thickness | -0.026 | 0.033 | -0.093 to 0.042 | 0.44 |
| Parenchymal thickness | -0.001 | 0.021 | -0.044 to 0.042 | 0.95 |
| GFR | -0.072 | 0.006 | -0.083 to -0.061 | 0.0001 |
| Height | 0.007 | 0.007 | -0.007 to 0.02 | 0.31 |
| Length | 0.007 | 0.007 | -0.007 to 0.02 | 0.31 |
Abbreviation: GFR, glomerular filtration rate.
5. Discussion
The study aimed to enhance the clinical use of renal ultrasound in monitoring CKD progression by highlighting imaging features (e.g., cortical thickness, echogenicity) and demographic factors (e.g., age) in 60 patients. The study demonstrated that echogenicity grades significantly impact kidney function in CKD patients, with higher grades associated with elevated Cr and lower GFR levels. Cortical thinning and kidney length were moderately associated with kidney function, particularly in the right kidney. Regression analysis confirmed that age, kidney grade, and GFR were the most significant predictors of Cr levels, while other ultrasound indices showed limited impact. These findings emphasize the importance of kidney ultrasound parameters in assessing CKD progression and highlight the need for further research into their predictive value. This result is consistent with studies by Chen et al. (21) and Wilson et al. (22). This result can be considered alongside other findings, such as parenchymal dysfunction, in predicting or requesting necessary tests for these patients. The use of different probes based on frequency and penetration power (surface probe and deep probe) can play a role in examining and evaluating these changes (23).
The present study showed that serum Cr level is significantly related to echogenicity grade in both the right and left kidneys, with mean serum Cr increasing with increasing grade. In the right kidney, this difference was observed between grades 3 and 4 with the rest of the groups, and in the left kidney between grade 4 with the rest of the groups. There was a direct and significant correlation between echogenicity grade and serum Cr in both kidneys in patients with CKD, with increasing echogenicity grade associated with increased serum Cr levels. This result, which was one of the main hypotheses of the present study, is consistent with the results of studies by Gupta et al. (19) and Garg et al. (24). Therefore, it can probably be concluded that renal echogenicity and its grading have a better relationship with serum Cr in CKD than other ultrasound parameters such as longitudinal size, parenchymal thickness, and cortical thickness. Renal echogenicity is a better parameter than serum Cr for estimating renal function in CKD and can be considered by physicians and specialists. Since changes in renal echogenicity are somewhat irreversible, sonological grading is recommended periodically and regularly in CKD patients (21-24).
In the present study, analyses showed that GFR also has a significant inverse correlation with echogenicity grade in both kidneys, with GFR decreasing as echogenicity grade increases. This result is consistent with studies by Hajalioghli and Zafarmand (25) and Gupta et al. (19). Considering the association of echogenicity grade with Cr and GFR in both kidneys simultaneously, it can be said that the grading of renal echogenicity has the strongest correlation with renal function in CKD patients and can be considered an appropriate indicator. Since serum Cr and GFR are important indicators of renal function, the degree of renal echogenicity in ultrasound is a better parameter for estimating renal function for early diagnosis, grading, and monitoring of renal disease. Renal ultrasound remains a valuable tool for rapid renal evaluation, especially in renal patients, and is usually recommended for anyone, especially patients suspected of having renal disease, on a regular and periodic basis, in addition to routine tests.
The Pearson correlation coefficient test showed that with increasing cortical thickness in both kidneys, serum Cr levels decrease. Although serum Cr level decreased with increasing parenchymal thickness, this relationship was not statistically significant. In this study, Cr level decreased with increasing kidney length. This result is consistent with studies by Chen et al. (21) and Garg et al. (24). Although sonographic indices such as cortical and parenchymal thickness and kidney length are affected by variables such as height, age, and even gender (25), due to the direct relationship with kidney function, these indices can be considered in kidney patients, and further studies can be conducted in patients in whom the cortical and parenchymal sizes have decreased. However, to achieve definitive and helpful results, more studies with a large sample size are needed.
In the present study, multiple linear regression was used to control the confounding of age and gender and determine the variables affecting serum Cr levels. Linear regression showed that in the presence of age and gender variables, as well as sonographic indices and echogenicity grade of both kidneys simultaneously in the model, the variables of age, echogenicity grade, and GFR are significantly related to serum Cr level. With increasing age, increasing echogenicity grade in both kidneys, and decreasing GFR, serum Cr level also increases. However, in this regression model, the thickness of parenchyma and cortex and the length of both kidneys did not show a significant relationship with serum Cr. Therefore, among the sonographic indices, the most important factor in determining and predicting the status of kidney function is the echogenicity grade. Regarding GFR, it can be said that a similar value of GFR can be normal for one sex. Therefore, examining several indices in the presence of each other is necessary to assess the severity of the disease (18, 19). Parenchymal and cortical thickness, which has emerged as a new parameter for evaluation, is thinned in CKD patients with glomerular damage, and over time, both glomeruli and collecting ducts are affected, leading to a decrease in kidney volume and loss of corticomedullary differentiation. Therefore, renal length has always been considered a parameter for evaluating CKD (1, 18).
In the present study, a significant inverse relationship was observed between cortical and parenchymal thickness and echogenicity grade, with increasing thickness associated with decreased echogenicity grade in both kidneys. This result is consistent with studies by Sutikno and Baskoro (26), Singh et al. (17), and Kasap et al. (27). Although these variables were not significantly associated with renal function, Cr level, and GFR index, given the relationship of these indicators with echogenicity grade, it is better to consider all sonographic indicators in the presence of each other in decision-making to determine the status of renal disease. Each of these indicators can predict part of renal function and help the doctor in making treatment decisions. However, in CKD, histological findings show glomerular sclerosis, atrophy, and fibrosis of interstitial tubules, which can lead to a decrease in kidney size (17, 19). In a study by Ahmed et al. (15), a significant relationship was found between increased renal echogenicity grade and serum Cr level. The echogenicity grade was also related to the length and thickness of the parenchyma. In the study by Siddappa et al. (16), there was also a positive relationship between the level of kidney echogenicity and serum Cr in these patients, and the thickness of the cortex and parenchyma and the length of the kidney also showed a positive statistical relationship with kidney function. The study by Singh et al. in India also showed a relationship between the increase in the level of kidney echogenicity grade and serum Cr, but in other sonographic parameters (kidney length, cortex, and parenchyma thickness) there was no relationship with serum Cr (17), which is consistent with the present study. In the study by Okoye and Ekeme (18), the serum Cr level increased with the increase in the level of cortical echogenicity, but there was no relationship between the length of the kidney and the level of echogenicity and serum Cr, which is also consistent with the present study. A 2020 study by Gupta et al. (19) showed that the degree of renal echogenicity and parenchymal thickness were significantly correlated with GFR, and all four renal ultrasound parameters showed a significant correlation with serum Cr level, but the renal echogenicity grading showed the strongest correlation with serum Cr and GFR, which is consistent with the present study.
5.1. Limitations
This study has several limitations. First, the cross-sectional design precludes the establishment of causal relationships or longitudinal assessment of CKD progression. Second, the use of convenience sampling from a single tertiary center may limit generalizability to broader CKD populations, particularly those with excluded comorbidities (e.g., polycystic kidney disease) or demographic diversity. Third, the reliance on ultrasound parameters, while standardized, may introduce inter-observer variability despite being performed by a trained resident. These factors highlight the need for larger, multicenter longitudinal studies to validate these findings.
5.2. Conclusions
The study concluded that renal echogenicity and its grading correlated better with serum Cr and GFR in renal patients than other ultrasound parameters such as longitudinal size, parenchymal thickness, and cortical thickness. Since Cr is an indicator of renal function, renal echogenicity is a better parameter to estimate the status of renal function. The study highlighted that ultrasound wasn’t just for imaging; it could reveal functional clues. By focusing on echogenicity and cortical thickness, clinicians could better gauge CKD progression. Meanwhile, age and GFR remained critical pieces of the puzzle. Together, these insights helped tailor monitoring and treatment for CKD patients, ensuring doctors prioritized the most telling signs of decline.
