1. Background
Breast cancer is the most common cancer in women and the main cause of death due to malignance in women aged 20-59 years so that 30% of all cancers and 15% of deaths due to cancer among women is related to it [1]. In Iran, 21.4% of all reported cancer cases is dedicated to breast cancer [2]. Since 1999, breast cancer, ranked first among all the recorded cancers in Iran [3]. In recent decade, the incidence of cancer has shown an increasing trend especially breast cancer in Guilan province. According to statistics of health centers in Rasht city (capital of Guilan), the number of cases with breast cancer was 40 in 2001, 100 in 2002, 140 in 2003, 156 in 2004, 185 in 2005, 211 in 2006, 185 in 2005 and 250 in 2007 [4].
Top of form today, the prevention and diagnosis of this malignant disease is of immediate necessity to control it since many patients die due to advanced level of the disease. Current methods for diagnosing breast cancer are based on mammography which is an effective and efficient screening method to detect breast cancer before clinical symptoms manifestation [5]. However, given that at the time of mammography, the size of tumors already reach to a few millimeters, based on studies by world health organization (WHO), it’s not a good tool for screening.
Thus, there is a strong need to identify pathological markers of this disease so as to be helpful in treatment and determining its type in addition to early diagnosis. At present, none of the valid markers and the used one, CA 15-3, has clinically diagnostic and prognostic value. Markers are effective not only in early diagnosis but also in predicting the therapeutic response to chemotherapy [6].
Many studies have shown that two-dimensional electrophoresis (2-DE) can determine the differences between normal and cancerous proteomes of cells and the extent of these changes is worth it [7]. On the other hand, only a few proteomic studies have been conducted based on 2-DE to search for biological markers of breast cancer in serum samples of patients with breast cancer [5]. In this study, for the first time, using the proteomic techniques, protein factors of breast cancer tissue have been studied and analyzed and the difference between its gene expression and normal breast cells was studied.
On the other hand, breast cancer is the most common cancer in women in most areas of the world. In Iran and Guilan province, frequency of this type of cancer has shown an increasing rate according to statistics of health centers of province in recent years. Despite of efforts on early diagnosis and treatment, this type of cancer is still the second leading cause of deaths due to cancer in women.
2. Objectives
This study aimed at obtaining protein biomarkers that may be useful in diagnosis and treatment of breast cancer.
3. Patients and Methods
In this experimental study, 10 women with and 10 women without breast cancer who were referred to the Porsina and Razi hospitals of Guilan university of medical sciences in Rasht since 2011 to 2012 were sampled. Examples of scientific information relevant to the study variables, without restriction of any kind, patient and personal information are used only by a specific code and is normally archived.
After obtaining written informed consent forms, 10 healthy volunteers entered in the study during breast tissue surgery, a sample size of 1 × 1 cm was taken. A portion of it was sent to a pathology laboratory to confirm the normal tissue. The other portion was immediately transferred to the liquid nitrogen tank to be transferred to the proteomics laboratory of clinical proteomics research center of Shahid Beheshti university. Tumor sampling was conducted on 10 patients during surgery. A part of tissue was sent to the same pathology laboratory to be pathologically tested (cancer confirmation). The other part of the sample was then transferred to the tank of liquid nitrogen with 96ºC temperature in less than 2 min and sent to proteomics laboratory of clinical proteomics research center of Shahid Beheshti university for the study of proteomics. For protein extraction, frozen healthy and cancerous tissues of patients under liquid nitrogen condition were powdered completely. The resulting powder with lubricating buffer containing Tris-Hcl, magnesium chloride, Ethylenediaminetetraacetic acid (EDTA) and phenyl methyl sulfonyl fluoride (PMSF) and 5 mm β-mercaptoethanol, 0.5% CHAPS) 3-Cholamidopropyl-dimethylammonio-1-propanesulfonate and 10% glycerol was kept in ice for 30 minutes. Then, the solution was centrifuged in 16000 G round at 4ºC for 30 min and protein assay was performed by Bradford technique [7]. For a two-dimensional electrophoresis, the sample was washed three times with PBS buffer and placed in 300 μL of lubricating buffer (7 M urea, 2 M Thurea urea, 4% CHAPS, DTT 0.2% - 0.3%, 1% - 2% ampholine® with pH = 3 - 10) and was shaken for an hour in room temperature. Then, the lysed solution was centrifuged by 10,000 G rounds. The solution was maintained in 20ºC. In order to test the accuracy, for each healthy and ill case, it was repeated 3 times. Dry strip was placed in the buffer for a single night to be dewatered. Sample was also taken during the dewatering. Then, based on (Bio-rad) IEF-IPG system, two-dimensional electrophoresis was performed. Next, gels were placed in balancing buffer for second level of electrophoresis. Strip was placed on the second level (surface) gel with and was fixed with 0.5% agarose in electrophoresis buffer containing SDS (sodium dodecyl sulfate) (25 mM Tris, 192 mm glycine, 0.1% SDS), then started to work vertically. For protein staining by Coomassie Blue stain, following electrophoresis gel was placed for 6 h in a solution of 40% methanol, 10% acetic acid and 0.025% Coomassie color which is filtered by using Whatman paper filter. Gel was placed in bleaching solution continuously until the discoloring of the entire field. Analysis of image spots (proteins) which appeared on the gel was done based on following steps: scanning the gel image, identifying protein spots and quantifying (evaluating the color intensity of spot), matching gels, data analysis, data interpretation and finally creation of 2-DE databases [7]. We used χ2 test, ANOVA, Post Hoc test by LSD method for statistical analysis. The data were analyzed by using the SPSS-16 software. We considered significant P-value < 0.05.
4. Results
After extraction, breast tissue and its proteome were studied by 2-DE technique. The results obtained in this study are based on comparing the pooling gels obtained from 10 healthy and 10 cancerous tissue; the changes were calculated by mean and standard deviation (SD). The mean ± SD of age were respectively 38 ± 12.3 years in healthy group and 47.3 ± 8.95 years in cancerous individuals. Out of 10 healthy individuals of this study, 8 patients (80%) had benign pathology, and 2 patients (20%) were diagnosed with fibroadenoma. Moreover, in patients with breast cancer, 9 patients (90%) had invasive ductal pathological and 1 (10%) had labular carcinoma. With respect to the levels of cancer, out of 10 patients with breast cancer, 2 patients (20%) level I, 1 patient (10%) Level IIA, 5 patients (50%) level IIB, 1 patient (10%) level IIIA and 1 patient (10%) level IIIB.
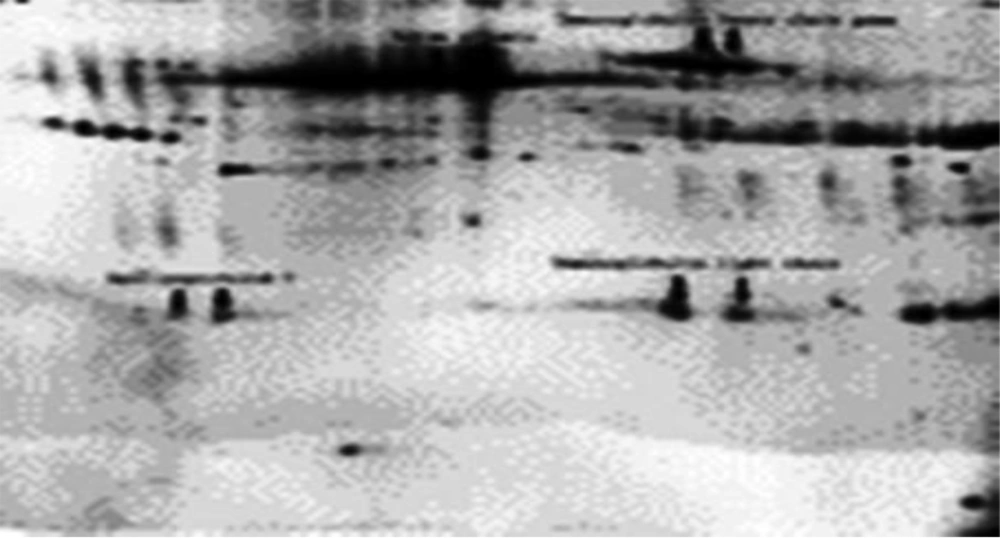
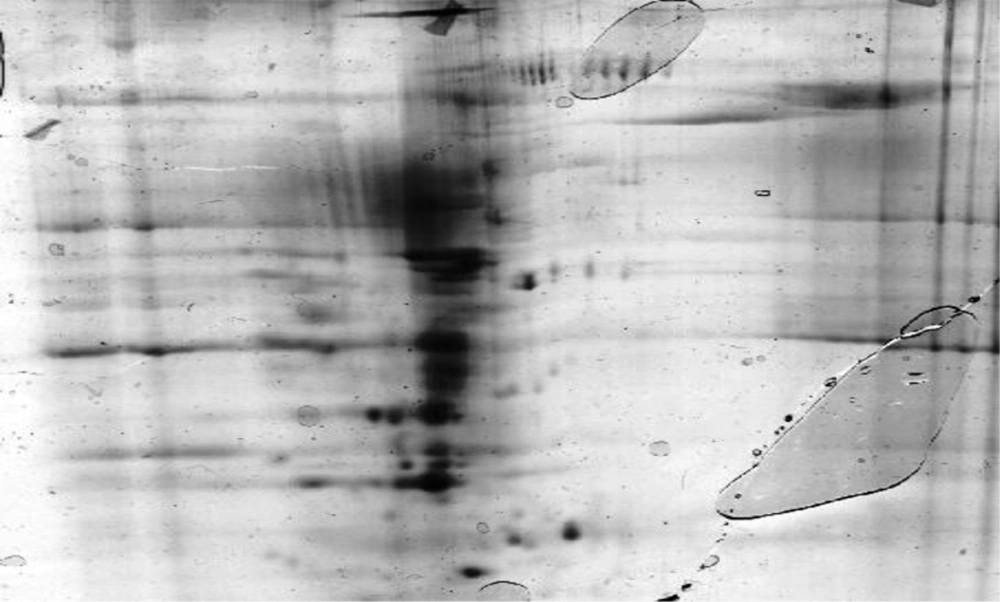
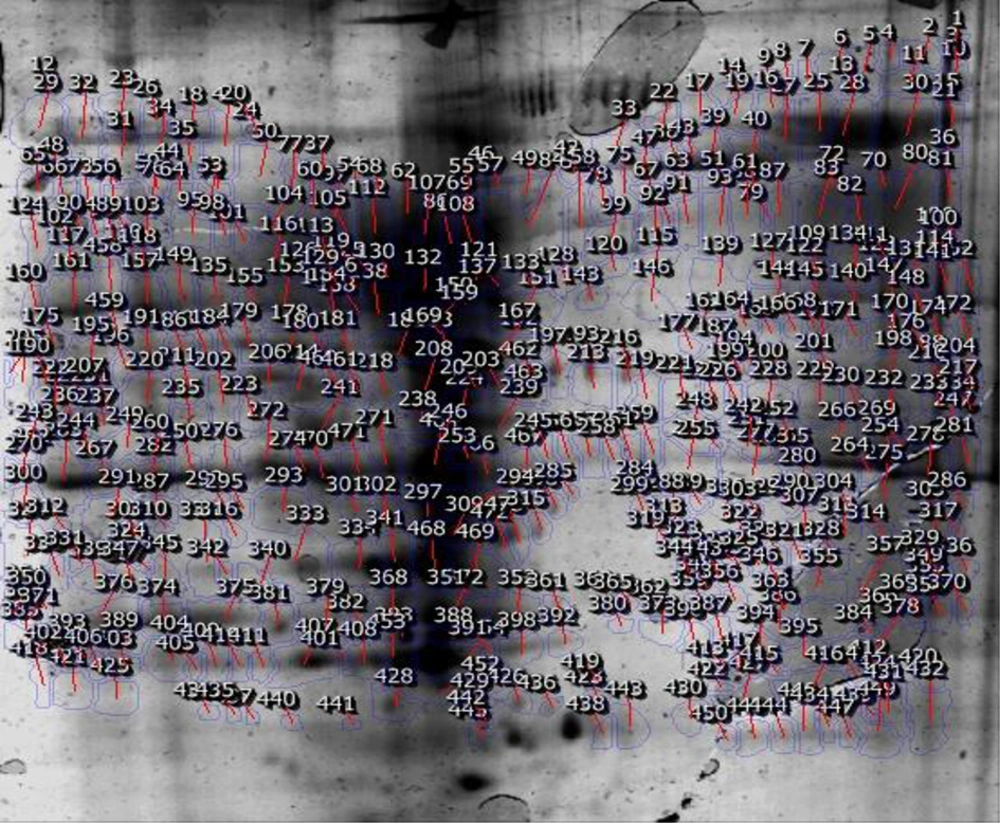
Figure 1 shows the separated proteins by 2-DE and the tested sample is of a normal breast tissue. Figure 2 portrays the sample of a cancerous breast tissue. The gels shown in figures have the ability to be compared and bioinformatically analyzed, so the spots on two gels were compared by Flicker software. In this study, 454 spots on normal tissue and cancerous tissue of breast were founded which had expression changes. On the basis of statistical comparisons made on electron load and molecular weight proteins it was observed that the more malignant the proteins become, the more acidic their electron load and the less their molecular weight would be. Thus, 138 different spots due to cancerous and normal tissues of breast show a massive change which happen in body following the tissue becoming tumorous. As is shown in the Figure 3, 454 proteins were identified, 138 of which had changes in protein expression in cancer state. The expression of 61 proteins was suppressed in cancerous group. Three proteins in cancer sample showed increase in expression and 74 proteins reduced expression in cancerous tissue. After grouping proteins, it was observed that 125 (27.5%) proteins were severe malignant, 93 (20.5%) moderate malignant, 71 (15.6%) changing healthy proteins and 165 (36.3%) normal healthy proteins (Table 1).
In terms of mean ± SD of electron loads among groups, severe malignant proteins (6.97 ± 1.94), moderate malignant proteins (6.04 ± 2.26), changing healthy proteins (2.38 ± 6.59) and normal healthy proteins (7.02 ± 2.10) were observed. In terms of mean and SD of molecular weight among groups, severe malignant (51.9 ± 22.5), moderate malignant (62.89 ± 20.4), changing healthy (56.14 ± 6.59) and normal healthy proteins (58.12 ± 24) were observed (Table 2).
|
Values
| |
|---|---|
| Valid | |
| Serious cancer pro | 125 (27.5) |
| Moderate cancer pro | 93 (20.5) |
| Mild healthy pro | 71 (15.6) |
| Normal healthy pro | 165 (36.3) |
| Total | 454 (100.0) |
aData are presented as No. (%).
|
Values | P-Value | ||||||
|---|---|---|---|---|---|---|---|
| Lower Bound | |||||||
| 0.009 | |||||||
| Serious cancer pro | 117 | 6.7287 ± 1.94336 | 6.3729 | 7.0846 | 3.24 | 10.00 | |
| Moderate cancer pro | 84 | 6.0445 ± 2.26788 | 5.5524 | 6.5367 | 3.00 | 9.98 | |
| Mild healthy pro | 68 | 6.5943 ± 2.38209 | 6.0177 | 7.1709 | 3.10 | 10.00 | |
| Normal healthy pro | 156 | 7.0256 ± 2.10201 | 6.6932 | 7.3581 | 3.05 | 10.00 | |
| Total | 425 | 6.6810 ± 2.16281 | 6.4748 | 6.8872 | 3.00 | 10.00 | |
| 0.006 | |||||||
| Serious cancer pro | 120 | 51.908 ± 22.5295 | 47.836 | 55.981 | 16.0 | 98.0 | |
| Moderate cancer pro | 92 | 62.891 ± 20.4968 | 58.647 | 67.136 | 18.0 | 95.0 | |
| Mild healthy pro | 71 | 56.141 ± 23.7465 | 50.520 | 61.762 | 16.0 | 98.0 | |
| Normal healthy pro | 158 | 58.120 ± 24.0057 | 54.348 | 61.892 | 16.0 | 100.0 | |
| Total | 441 | 57.107 ± 23.1168 | 54.943 | 59.270 | 16.0 | 100.0 | |
aAbbreviations: IP, Isoelectric point; MW, Molecular weight.
bData are presented as mean ± SD.
5. Discussion
In our study, 454 proteins were recognized, 138 of which were identified with changes in protein expression while cancerous. The expression of 61 proteins in tumorous group was suppressed. Three proteins showed increased expression while cancerous and 74 proteins showed decreased expression in cancerous tissue.
It seems that in this disease, the expression of a large number of proteins in cancerous tissues changed, most of them decreased or not expressed at all. These changed proteins can be effective as biomarker in diagnosis and treatment of this disease.
Because this study was the first study on breast cancer by this methods’ of proteomics we could not compare that with previous study [8]. Advances in proteomic-based diagnosis have revolutionized the field of molecular medicine, which can be used not only to diagnose diseases but also used clinically [9]. Many researchers using proteomics technology to study cancer and identification of polypeptides in healthy and cancerous tissue have achieved appropriate biochemical markers to diagnose the degree, type and extent of damage [10]. Now, with effective methods such as 2-DE, steps can be taken for detection of markers of this type of cancer in order to take the most effective treatments before the advancement of disease such as in treatment of lung cancer by identifying markers and diagnosis by two-dimensional electrophoresis [11, 12].
In our study, 454 proteins were recognized, 138 of which were identified with changes in protein expression while cancerous. The expression of 61 proteins in tumorous group was suppressed.
In other words, differences in expression of proteins while developing tumor, demonstrates that the regulation of a large number of genes had altered. Difference in gene expression of the two gels can be useful for achieving protein markers for diagnosis and treatment of patients with this type of tumor. On the other hand, our results showed that most of the subjects were 38 - 47 years old.
These people were socially and sexually at active age. Age is considered as the most important factor. The rate of incidence for those less than 40 years old was low and high for 50 years and above [13]. In less than 7% of cases, breast cancer occurs in women younger than 25 years of age. However, there is a sharp increase in incidence of breast cancer. The incidence increases as age [6].
In our study, the highest incidence of breast cancer was seen in 47 years old subjects. Simultaneous change of many proteins in this disease can indicate biochemical and mechanisms involved in incidence of it which can be effective for medicinal purposes in the treatment process [14]. This study was conducted for the first time in Iran. Therefore, since more today diagnoses are based on detection of protein, changes in gene expression can be more helpful in identifying the biomarkers of the disease more effectively [15, 16].
Thus, reducing or suppressing the expression of a large number of tissue proteins in breast cancer tissue makes these changed proteins be used as biomarker of the disease and thus effective in diagnosis and treatment.


