


1. Background
Thyroid hormones, including tetraiodothyronine or thyroxine (T4) and triiodothyronine (T3), play critical roles in intermediary metabolism and energy expenditure through affecting carbohydrates, proteins, and lipids metabolism. They may either modulate the metabolic pathway flux directly or modulate the effects of some regulatory hormones on their target cells indirectly (1). For instance, T3 and T4 hormones induce agonistic or antagonistic effects on insulin levels in different tissues. Therefore, the interactions between insulin and thyroid hormones lead to a balance in glucose metabolism in these tissues. Accordingly, any abnormal alterations in thyroid hormones levels in hypo/hyperthyroidism disease distort this balance and lead to impaired glucose metabolism (2). It has been shown that T3 in the liver acts opposite to insulin and increases glucose output either by enhancing gluconeogenesis or by accelerating glycogenolysis at the expense of decreasing glycogen content (2, 3). Nevertheless, there are conflicting reports that T3 acts similar to insulin in the expression of glycogen synthase (4, 5).
Hypothyroidism is age-dependent and occurs at a higher incidence in women suffering from insufficient production of T3 and T4 hormones in the thyroid gland (6). Thyroid stimulating hormone (TSH) increases highly in this condition to stimulate the thyroid gland for more production of T3 and T4 hormones. High risk of dyslipidemia and cardiovascular complications are the known consequences in these patients (7). The liver is the place where T4 is deiodinated and converted to T3, wherefore it plays an important role in the metabolic effects of thyroid hormones (8). Although the liver is the major site for lipid metabolism, lipid deposition is expected to increase in hypothyroidism (9). Insufficient secretion of insulin in type 1 diabetes mellitus or decreased levels of T3 and T4 hormones in hypothyroidism can cause the same alterations in hepatic lipid metabolism and deposition in the liver. Therefore, one may expect a rise in the prevalence of diabetes mellitus among hypothyroid patients. Nevertheless, there is a serious disagreement among researchers in this context.
2. Objectives
3. Methods
3.1. Animals
For this study, 20 adult male Wistar rats, aged eight weeks and weighing 180 - 222 grams each, were obtained from the Animal Breeding House of the Faculty of Veterinary Medicine, Shahid Chamran University of Ahvaz (Iran). The animals were placed in four cages under strict care and cleaning measures. The study was approved by the Ethics Committee of the Shahid Chamran University of Ahvaz. The animals were handled according to the standard principles of laboratory animal care (11). All animals were kept under controlled conditions of light (12-hour light/dark cycles) and temperature (22 ± 3°C) and fed ad libitum.
The animals were randomly divided into two groups including control (n = 10) and hypothyroid (n = 10) groups. The hypothyroid group received 0.02% (200 ppm) PTU dissolved in their drinking water to induce hypothyroid (11, 12) while the control group received tap water. Food and water consumptions and weight changes were monitored daily throughout the experiment.
3.2. Measurement of Serum Hormones of T3, T4, TSH, and Insulin
In order to monitor the hypothyroidism induction, thyroid hormones were measured two months after PTU consumption. After a fasting period of 15 - 16 hours, the animals were anesthetized using diethyl ether for blood sample preparation. Blood samples were taken from the hearts of deeply anesthetized animals. After coagulation, the samples were then centrifuged at 3000 rpm for 10 minutes. The levels of T3, T4, and TSH in sera were measured using IDEAL kits (www.mgmkala.com) and the insulin hormone was measured using insulin-R Monobind kit (www.mgmkala.com) by the ELISA method.
3.3. Measurement of Serum Lipids
The serum lipid profile including triglycerides, total cholesterol, and HDL-cholesterol was measured in both groups. The commercially available kits of PARS AZMUN (www.mgmkala.com) were used for these measurements. Serum LDL-cholesterol concentration was calculated using the following equation (1, 13):
[LDL] = [Total Cholstrol] - [HDL - Chol] - [TG] / 5
Serum VLDL-cholesterol also was calculated using the following equation (9):
[VLDL - Chol] = [TG] / 5
3.4. Histological Study
Following blood collection, the animals were euthanized, dissected, and liver samples were taken for histological study. The liver samples were fixed in 10% formalin adjusted to neutral pH for at least 48 hours. To remove the fixative, the samples were washed with running water overnight. The paraffin blocks were trimmed and cut into 5-µm sections. The tissue sections were stained by hematoxylin and eosin (HE) and periodic acid-Schiff (PAS) staining (Bancroft) (14). The section slides were then studied using a light microscope (Olympus BX51, Japan) and slide images were taken by a digital camera (Olympus DP71, Japan) attached to the microscope.
3.5. Instrumentation
A UV-Vis spectrometer from Biowave II, Biochrom Ltd. Cambridge, England, Plate Reader from BioTek Instruments Inc. USA, and a pH meter Model MTT65 made in Iran along with other routine instruments were used in this work.
3.6. Statistical Analysis
The data obtained were subjected to normality test by the Kolmogorov-Smirnov test and statistical analysis by independent samples t-test and Pearson two-tailed correlation using SPSS version 21 statistical package. The data obtained were expressed as means ± SD. Differences were considered significant against the control group at a P value of less than 0.05.
4. Results
4.1. Hormone Assay
Table 1 represents the serum concentrations of insulin and thyroid hormones in hypothyroid and control groups. As indicated, the TSH hormone increased significantly from 0.25 ± 0.01 mIU/L in the control group to 1.21 ± 0.16 mIU/L in the hypothyroid group (P < 0.01). As expected, T4 significantly decreased from 3.08 ± 0.43 μg/dL in the control group to 1.96 ± 0.17 μg/dL in the hypothyroid group. In the same manner, T3 decreased from 0.77 ± 0.03 ng/mL in the control group to 0.48 ± 0.05 ng/mL in the hypothyroid group (P < 0.01). Table 1 also shows that the insulin concentration in sera decreased from 0.12 ± 0.02 mIU/L in the control group to 0.06 ± 0.03 mIU/L in the hypothyroid group (P < 0.01).
| Control | Hypothyroid | P value | |
|---|---|---|---|
| Insulin (mIU/L) | 0.12 ± 0.02 | 0.06 ± 0.03 | 0.008 |
| TSH (mIU/L) | 0.25 ± 0.01 | 1.21 ± 0.16 | 0.001 |
| T4 (μg/dL) | 3.08 ± 0.43 | 1.96 ± 0.17 | 0.001 |
| T3 (ng/mL) | 0.77 ± 0.03 | 0.48 ± 0.05 | 0.001 |
4.2. Correlation Studies
The strength of the association between insulin and thyroid hormones in the hypothyroid and control groups was studies and the results of Pearson tests are summarized in Table 2. As tabulated, there was a clear positive correlation between T3/T4 and insulin hormones in both groups of control and hypothyroid. This finding indicates that T3/T4 changes in the same direction with insulin; that is, they increased or decreased simultaneously so that a decrease in the T3/T4 level in hypothyroid animals may lead to the attenuated secretion of insulin. On the other hand, unlike the control group (P value < 0.05), there was a negative significant correlation between TSH and insulin in the hypothyroid group. The 4.82-fold increase in the TSH level in the hypothyroid group, as compared to the control group, and its negative correlation with insulin highlight the importance of TSH as the main suspected factor exposing hypothyroid animals to diabetes mellitus.
| Variables | Correlation (Control-Hypo) | P Value |
|---|---|---|
| Insulin-TSH | - 0.857 | 0.002 |
| Insulin-T3 | 0.789 | 0.007 |
| Insulin-T4 | 0.815 | 0.004 |
4.3. Biochemical Studies
In order to monitor changes in lipid profiles of control and hypothyroid groups, we examined the very low-density lipoprotein (VLDL), triglyceride (TG), cholesterol, low-density lipoprotein (LDL), and high-density lipoprotein (HDL) concentrations in both groups. Table 3 presents the obtained data for these parameters. Table 3 indicates that none of the determined parameters changed significantly in the hypothyroid group when compared to the control group. Slight increases were observed in parameters such as VLDL, TG, cholesterol, and LDL in the hypothyroid group and slight decreases in HDL values, though insignificant in both cases. Hence, the lipid profile seems to resist any alteration due to hypothyroid and/or diabetes-like conditions during the two-month period of our study.
| Control | Hypothyroid | P Value | |
|---|---|---|---|
| VLDL | 13.48 ± 0.45 | 15 ± 1.46 | 0.125 |
| TG | 67.41 ± 2.25 | 75 ± 7.30 | 0.125 |
| Cholesterol | 71.67 ± 5.13 | 74.29 ± 10.72 | 0.704 |
| LDL | 19.19 ± 4.48 | 25.71 ± 11.68 | 0.238 |
| HDL | 39 ± 8.72 | 33.57 ± 4.93 | 0.233 |
4.4. Histological Findings
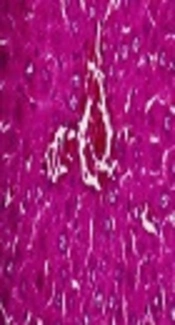
Light Microscopic examination of liver slides (Figures 1 and 2) revealed that in both groups including normal control (Figure 1A and 2A) and hypothyroid (Figure 1B and 2B) groups, the liver retained its normal architecture with hepatic lobules. As seen, there are sections of central vein in the center with hepatic cords of hepatocyte located radially around the central vein with sinusoids lain between them. Moreover, the portal regions for the two groups contained portal triad seen through interlobular spaces. Hepatocytes were hexagonal with an obvious border and an acidophilic cytoplasm containing round euchromatin nucleus with one or two nuclei. There are some colorless spherical vesicles with regular borders in the cytoplasm of some hepatocytes, especially those located around the portal regions. These structures seemed to disclose fat droplets of different sizes. The existence of these vesicles inside the cytoplasm of hepatocytes in the hypothyroid group showed mild steatosis. These vesicles were absent in the control group (Figures 1 and 2).

Light micrograph of the liver tissue section. A, Control group; B, Hypothyroid group obtained by the HE staining method. F indicates fat vesicles, H indicates hepatocytes, and P indicates the portal region
 seen in the B, hypothyroid group and absent in the A, control group")
Liver tissue section with high magnification: Fat vesicles of different sizes (yellow arrows) seen in the B, hypothyroid group and absent in the A, control group
The staining method of periodic acid-Schiff (PAS) is a method used to detect polysaccharides containing aldohexose sugars such as glycogen polysaccharides. Here, using the PAS staining method, we studied the accumulation of glycogen in livers of hypothyroid and control groups. Figure 3 depicts the light micrographs of liver tissue sections for both groups. As shown, in hypothyroid rats, there was no remarkable change in glycogen storages compared to the control group (Figure 3). This finding confirmed that hypothyroidism induced by 0.02% PTU over a two-month period did not affect the glycogen metabolism significantly.

Histology section of the liver in the A, control and B, hypothyroid group. PAS reaction was nearly the same in both groups
5. Discussion
In line with previous studies, the current work confirmed the occurrence of hypothyroidism in PTU-treated animals via the measurement of TSH, T4, and T3 hormones (4, 5, 11). As indicated (Table 1), a two-month administration of 0.02% PTU caused 36.57% and 37.48% reductions in T4 and T3 levels, respectively, as compared to their normal levels in the control group. However, the TSH hormone increased by about 4.82 folds reflecting a condition consistent with mild hypothyroidism (15, 16). On the other hand, our data indicated a decrease in the insulin level (about 50%) in the PTU-treated group suggesting the presence of diabetic-like conditions due probably to hypothyroidism (Table 1). This is despite the fact that the glucose tolerance test indicated a slight increase in resistance in the hypothyroid group (data not shown). There are reports of a significant decrease in the insulin level of hypothyroid rats (13, 17, 18), while others suggest the occurrence of insulin resistance and/or a slight increase in insulin levels in similar cases (19, 20).
Pearson tests revealed positive significant correlations between insulin and T3 and T4 variables on the one hand, and negative correlations between insulin and TSH hormone on the other hand (Table 2). These findings reconfirm our claim that the presence of hypothyroidism, i.e. increased levels of TSH, in the treated group was in correlation with decreased levels of T4, T3, and insulin. This may be interpreted as facilitating conditions for diabetic disorder induction.
Given the effective roles of T3/T4 hormones in promoting hepatic lipogenesis in healthy rats, it is expected that decreased T3/T4 levels in our hypothyroid animals attenuated lipid biosynthesis and lipid deposits in the liver. However, because of the two-way effect of T3 on lipid metabolism in diabetic (reduced insulin) or even in hypothyroid conditions, the hormone may lead to dyslipidemia and fat deposition in the liver as indicated previously (2, 21, 22). Our histological data (Figures 1 and 2) are in agreement with previous reports (23) suggesting that PTU-induced hypothyroidism leads to fat deposition and mild steatosis in the liver. There are miscellaneous reports in conformity with our findings, which show lipid depositions in drug-induced hypothyroid models (22, 23), whereas there are also some in contrast (24, 25). Our histological studies indicated the accumulation of glycogen depositions in the liver of the hypothyroid group as suggested by others (26).
The measurement of serum lipids and lipoproteins in the hypothyroid group showed a slight increase in the average concentrations of triglyceride, cholesterol, VLDL, and LDL, but a slight decrease in HDL. The averaged measurements did not significantly deviate from the normal levels although this may not be true if the hypothyroid state continues for a longer period (24-28).
5.1. Conclusions
Based on our findings, we can conclude that hypothyroidism may facilitate diabetes mellitus or induce diabetic-like conditions of reduced insulin that may develop to diabetes mellitus over time. Mild experimental hypothyroid increases lipid and glycogen deposits in the liver with subsequent steatosis, which may affect intermediary metabolism. Our main finding is that diabetes mellitus and progressing fatty liver comprise two threatening factors for hypothyroid individuals at old ages.
