


1. Background
Physical activity/exercise is a well-established therapeutic tool to protect against type 2 diabetes (1). Adipose tissue, particularly visceral adipose tissue, expresses, synthesizes, and releases a variety of metabolically active molecules, called adipocytokines such as leptin, tumor necrosis factor alpha (TNF-α), monocyte chemoattractant protein 1 (MCP-1), interleukin-6 (IL-6), chemerin, omentin, vaspin, visfatin, and apelin (2, 3) that act in an autocrine, paracrine, and endocrine manner to regulate metabolic and inflammatory biological processes (4) in some metabolic syndromes (5). It has been shown that adipokine dysfunction is one of the leading mechanisms associated with type 2 diabetes (6). However, the effect of exercise training on diabetes type 2-induced dysregulated adipocytokines depends on the type, intensity, and duration of exercise training. Hence, it is difficult to compare the findings reported by previous studies (7). There is an increasing evidence that glycemic control is improved by intensities above recommended prescription in type 2 diabetic individuals (8). We hypothesized that these combined and high-intensity interval training would exert beneficial effects for diabetic patients.
2. Objectives
The purpose of this study was to examine the effects of high-intensity interval vs. moderate intensity combined resistance and aerobic training on some adipokines related to insulin resistance (interleukin-6 [IL-6], apelin, and MCP-1) in type 2 diabetic women.
3. Methods
This study was a single-blind randomized clinical trial conducted in Shahrekord University (2016) based on the CONSORT statement (9). The protocol was registered in the Iranian Clinical Trial Registry, IRCT: IRCT20141118019995N10. The Ethics Committee of Shahrekord University (code No.: SKU94/210) granted the ethical approval of the study. Participants were recruited from patients registered in Shahrekord Diabetes Association (Shahrekord, Iran) according to the following inclusion criteria: Diagnosed with T2D by a physician based on the American Diabetes Association criteria (HbA1C ≥ 6.5%, fasting blood glucose ≥ 126 mg/dL (7.0 mmol/L)) (10), being sedentary (defined as having no more than 20 min exercise per week over the past six months) (11), being a 45 - 60-year-old pre-menopausal woman with a body mass index (BMI) between 25 and 35 kg/m2, having no diagnosed type I diabetes, and having lost or gained no more than 5 kg in weight during the previous six months. The participants were excluded if they had blood pressure ≥ 160/100 mmHg, fasting triglyceride ≥ 500 mg/dL, serious cardiovascular or musculoskeletal problems, thyroid disorder, cancer, hormonal disorder, kidney and liver diseases, and history of surgery or if they were smokers or used drugs or alcohol. We concluded that a sample size between 10 and 20 could provide the statistical power of 80% into the effect of HIIT versus combined training clinically and detect the potential difference in the means of 2% after a 10-week training. The power and sample size calculation of this study determined 17 subjects per group based on a predicted expected dropout rate of 20%. Every participant provided written informed consent.
Of 150 recruitments, only 54 subjects met the inclusion criteria (Figure 1). Eligible subjects were explained about the study protocol and informed about the risks and benefits of this study, both verbally and in writing. They were assured that all answers would be kept strictly confidential.

Consort 2012 flow diagram
Concealed randomization in the variable blocks of six was conducted by a research assistant not involved in the research by using a computer-generated random number sequence. The participants were stratified according to the HbA1c level. Sequential treatment allocations were enclosed in numbered, opaque, sealed envelopes, and distributed by the same research assistant to the groups after the baseline assessment. The participants were randomly assigned to the HIIT group (n = 17), the A + R group (n = 17), or the control group (n = 18) (Figure 1).
3.1. Exercise Training Protocols
Combined aerobic and resistance training: Through aerobic training program, the participants were free to exercise on a treadmill or ergometer. Aerobic training progressed from 20 min/session at 60% maximum heart rate (HR) in the weeks 1 - 2 to 30 min/session at 70% max HR in the weeks 3 - 10. Hear rate monitors (Polar T31, Oy, Kempele, Finland) were used to adjust workload to achieve the target heart rate. The aerobic training was personalized by individualized increments. Resistance training was performed at one set of 15 max reps with 15 repetitions for the first two weeks. Then, the intensity was increased from 2 - 3 sets of 12 to 10 max reps with 12 to 10 repetitions between the weeks 3 and 10 (Table 1) (12). All resistance-training sessions were performed on weight machines and included bench pressing, leg pressing, bending over the lateral pull down, bilateral biceps curling, and bilateral triceps pushing down.
| Variables | Pretest | Posttest | P Value Within Group | F | P Value Between Groups |
|---|---|---|---|---|---|
| Apelin (pg/mL) | 0.511 | 0.12 | |||
| HIIT | 256.65 ± 25.12 | 279.12 ± 50.08 | 0.13 | ||
| Combined training | 286.56 ± 42.12 | 266.26± 56.00 | 0.09 | ||
| Control | 302.44 ± 38.03 | 312.23 ± 63.03 | 0.732 | ||
| MCP-1 (pg/mL) | 5.011 | 0.009b | |||
| HIIT | 260.14 ± 20.14 | 190.26 ± 15.12 | 0.001b | ||
| Combined training | 251.20 ± 15.26 | 212.74 ± 19.95 | 0.045c | ||
| Control | 263.78 ± 32.12 | 266.11 ± 12.20 | 0.562 | ||
| IL-6 (pg/mL) | 5.511 | 0.008b | |||
| HIIT | 1.89 ± 0.95 | 1.21 ± 1.11 | 0.009b | ||
| Combined training | 2.03 ± 1.08 | 1.50 ± 1.32 | 0.019b | ||
| Control | 2.12 ± 1.24 | 1.88 ± 2.01 | 0.261 |
The Comparison of Changes in Adipokine Related to Insulin Resistance Before and After 10 Weeks of Exercise Interventionsa
3.2. High-Intensity Interval Training
The HIIT training consisted of exercising on cycle ergometers (Ergomedic 894E Peak Bike, Monark EB; Varberg, Sweden). Each session consisted of a 5-minute warm-up, with 4 × 30 second maximum intensity intervals at the breaking wattage of the individual; this was followed by 2 minutes of recovery and 4 minutes of cool-down. The wattage was adjusted upward by 10% based on the performance and the perceived effort in participants who had completed the three intervals at the first HIIT session. However, the wattage was adjusted down by 10% based on the same criteria for those who were not capable of maintaining the required 120 rpm for any interval. In addition, during the 10 weeks of HIIT, the wattage was adjusted upward in 10% increments to ensure that the maximum intensity was being exerted during each trial if a patient had completed three intervals by maintaining more than 120 rpm at two consecutive sessions (13).
3.3. Anthropometric Measures
Body fat percentage (BF%) was measured to the nearest 0.5 mm at three sites: Abdominal, thigh, and suprailiac (Lafayette Instrument Skinfold Caliper, model 01128) (14). Body mass was measured by a calibrated digital scale to the nearest 0.1 kg. The BMI was also calculated (kg/m2). Waist circumference was measured at the midpoint between the iliac crest and the lower rib margin and recorded to the nearest centimeter. Hip circumference was measured at the point of the maximal gluteal protuberance from the lateral view to the nearest centimeter. The waist/hip ratio (WHR) was calculated by dividing the waist circumference by hip circumference (Table 2) (15).
| Variables | Pretest | Posttest | P Value Within Group | P Value Between Groups |
|---|---|---|---|---|
| Body mass (kg) | 0.017b | |||
| HIIT | 73.06 ± 21.62 | 77.00 ± 12.34 | 0.005c | |
| Combined training | 76.30 ± 9.58 | 75.55 ± 9.23 | 0.003c | |
| Control | 71.44 ± 13.20 | 71.26 ± 13.06 | 0.000c | |
| BMI (kg/m2) | 0.023b | |||
| HIIT | 29.57 ± 2.77 | 28.97 ± 3.39 | 0.005c | |
| Combined training | 30.57 ± 2.97 | 31.58 ± 8.61 | 0.003c | |
| Control | 29.70 ± 4.17 | 29.13 ± 4.41 | 0.42 | |
| Body fat (%) | 0.08 | |||
| HIIT | 42.64 ± 2.23 | 41.14 ± 4.34 | 0.000c | |
| Combined training | 31.32 ± 4.63 | 27.99 ± 2.36 | 0.000c | |
| Control | 43.92 ± 2.49 | 42.64 ± 4.95 | 0.08 | |
| WHR | 0.006c | |||
| HIIT | 1.01 ± 0.13 | 0.93 ± 0.06 | 0.000 c | |
| Combined training | 1.01 ± 0.25 | 0.97 ± 0.07 | 0.008c | |
| Control | 1.01 ± 0.018 | 0.98 ± 0.07 | 0.22 |
The Comparison of Changes in the Anthropometric Variables Before and After 10 Weeks of Exercise Interventionsa
3.4. Blood Analysis
Blood samples (10 cc) from the antecubital vein in a sitting position were collected 24 hours before the exercise protocol and 48 hours after the last session of the training program within 12 hours of the fasting state.
Fasting blood glucose was measured using the glucose oxidase method kit (Pars Azmoon, Tehran, Iran) by auto-analyzer devices (Hitachi®, model 704, 902 made in Japan). Serum insulin concentrations were determined by the ELISA technique using a microplate reader. HOMA-IR was calculated by computing the following equation (16):
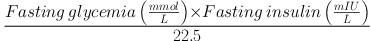
Participants who used insulin injection were excluded for the HOMA-IR analysis. Interleukine-6 [IL-6], apelin, and MCP-1 levels were measured by using commercial Elisa kits (Table 3).
| Variables | Pretest | Posttest | P Value Within Group | F | P Value Between Groups |
|---|---|---|---|---|---|
| FFA (µmol/L) | 0.813 | 0.451 | |||
| HIIT | 560.56 ± 90.56 | 542.52 ± 86.48 | 0.12 | ||
| Combined training | 600.71 ± 73.52 | 589.50 ± 80.14 | 0.09 | ||
| Control | 555.14 ± 86.19 | 539.54 ± 89.11 | 0.231 | ||
| FBG (mg/dL) | 1.853 | 0.171 | |||
| HIIT | 210.07 ± 32.90 | 147.92 ± 41.17 | 0.000b | ||
| Combined training | 216.00 ± 63.08 | 163.85 ± 71.47 | 0.062 | ||
| Control | 177.28 ± 47.09 | 183.28 ± 60.70 | 0.690 | ||
| Serum insulin (μU/mL) | 3.622 | 0.036c | |||
| HIIT | 7.72 ± 2.63 | 4.97 ± 1.30 | 0.000b | ||
| Combined training | 9.10 ± 2.62 | 5.93 ± 2.24 | 0.000b | ||
| Control | 6.57 ± 2.06 | 6.21 ± 2.06 | 0.08 | ||
| HOMA-IR | 5.511 | 0.008b | |||
| HIIT | 98.33 ± 3.08 | 93.44 ± 3.03 | 0.000b | ||
| Combined training | 95.40 ± 3.08 | 92.50 ± 3.18 | 0.000b | ||
| Control | 97.44 ± 4.36 | 97.00 ± 4.53 | 0.732 |
The Comparison of Changes in Some Serum Variables Before and After 10 Weeks of Exercise Interventionsa
3.5. Statistical Analyses
All values are represented as means ± SD. For testing the normality of distribution, the Kolmogorov-Smirnov test was used. Data were analyzed by a Dependent t-test to compare pretest and posttest results in each group. An ANCOVA test was used to compare the changes in the experimental and control training groups after 10 weeks. When a significant F value was achieved, the Fisher’s Least Significant Difference (LSD) test was used to find the differences between various groups.
4. Results
Data from 10 participants who did not take part in the post-test assessment were excluded. Thus, only the available data of 42 participants with the mean age of 55.07 ± 5.92 years (drop-out of 19.2%) who had completed the pre and post assessment was analyzed. The participants flow through the study can be found in the CONSORT flowchart in Figure 1. Subjects were being treated with oral hypoglycemic medications, 20 with insulin injections, and five with the combination therapy of insulin injection and oral drugs. The baseline characteristics are represented in Table 1. One-way ANOVA showed that there were no significant differences in terms of baseline characteristics between the groups, except for FBS (P = 0.021) and HbA1c (P = 0.005)
4.1. Adverse Events
No clinically severe adverse events were identified and reported during the 10-week intervention. However, most patients reported muscle soreness in the legs during HIIT (76%) and A+ R training (82%). The results were based on 14 participants in the control, 14 in HIIT, and 14 in combined training groups.
The effects of the 10-week combined resistance/endurance training and HIIT program on serum adipokine concentrations of diabetic female patients are shown in Table 1.
The data revealed that after 10 weeks of exercise training, there were significant changes in the fasting blood glucose in the HIIT group (P < 0.000). Paired t-test conducted on the data from experimental groups showed that the serum insulin levels showed significant increases in the HIIT (P < 0.000) and combined training (P < 0.000) groups following exercise training.
When comparing within-group changes, the HIIT and combined training groups had significantly lower MCP-1 levels at week 10 compared to baseline (P = 0.001 and P = 0.015, respectively). In the HIIT and combined training groups, changes in IL-6 were significantly lower compared to baseline at week 10 (P = 0.009 and P = 0.019, respectively) and MCP-1 in the combined training (P = 0.045) and HIIT (P = 0.001) groups at week 10 (P = 0.015). Changes in apelin were not significantly different within HIIT and combined training groups (P = 0.13 and P = 0.09, respectively). Furthermore, the ANCOVA test showed that there were no significant differences in fasting blood glucose concentrations (F = 1.853, P = 0.171) and apelin (F = 0.511, P = 0.12). Nevertheless, the ANCOVA test showed that significant differences were seen between groups in MCP-1 (F = 5.011, P = 0.009), IL-6 (F = 5.511, P = 0.008), insulin (F = 3.622, P = 0.036), and HOMA-IR (F = 5.511, P = 0.008).
5. Discussion
To the best of our knowledge, this is the first study to evaluate the glycemic indices and related adipokines such as IL-6, apelin, and MCP-1 levels among diabetic women and to show how they are affected by HIIT and combined training.
The above-mentioned findings are consistent with the results of studies showing a reduction in IL-6 levels (17-19). Due to the body weight and body fat losses, decreases in the IL-6 concentrations were observed in both HIIT and combined training groups in type 2 diabetic patients (20-22). It seems that a reduction in the IL-6 level as an inflammation factor is an independent predictor and a potential mechanism in the improvement of insulin resistance (23), as seen in our both training groups.
The results from our trials about apelin are inconsistent with those of Kadoglou et al. (24), that demonstrated a significant increase in serum apelin following aerobic exer-cise intervention in the diabetic patients. However, Kadoglou et al. also found that aerobic exercise is effective for apelin levels, even in the absence of significant weight loss in type 2 diabetic women. Sheibani et al. (25) also observed that aerobic exercise for eight weeks was effective in decreasing plasma levels of apelin, body mass index, and body fat mass in obese women.
In the present study, consistent with significant changes in the serum MCP-1 level, there were also significant changes in body mass, BMI, body fat percentage, and WHR following 10 weeks of both HIIT and combined training. Previous findings have shown an association between gene expression of MCP-1 in human adipose tissue, circulating MCP-1, and BMI. In addition, there were significant decreases in MCP-1 after weight loss-induced diet and moderate exercise training in morbidly obese subjects (26).
It seems patients with type 2 diabetes respond quite differently to HIIT and combined training. The mechanisms for the improvement in adipokine observed after HIIT and combined training in the current study are unclear. It has been suggested that the improved serum adipokine levels after HIIT and combined training occur via different mechanisms from aerobic and resistance training. It is probable that HIIT and combined-induced abdominal subcutaneous adipose tissue reduction could be explained by the lowering of serum adipokine levels (27).
The mechanism by which HIIT improves adipokine concentrations may lay in its ability to activate the peroxisome-proliferator-activated receptor γ coactivator (PGC-1α). Studies suggested that exercise intensity is the key factor influencing PGC-1α activation (28). It seems PGC-1α signaling is affected by every major signaling pathway that is activated in a contracting muscle fiber via myokines (29). A previous study showed that PGC-1 expression was greater in skeletal muscle fiber type IIa than in type I/IIx fiber (30). Furthermore, several studies illustrated shifts of type I and IIx fibers to type IIa fibers after HIIT (31).
Taken together, the results of the present study support the importance of high-intensity training and combined training program to improve type 2 diabetes and adipokines related to insulin resistance, despite the fact that some studies showed that combined training (aerobic and resistance) and HIIT interventions could improve glucose homeostasis in overweight women with type 2 diabetes. The results highlighted that exercise training, independent of the mode of training (HIIT vs. combined training), is an effective training method to improve body composition, glycemic control, and adipokines related to insulin resistance in overweight individuals with type 2 diabetes.
