1. Background
Alzheimer’s disease is the most common form of dementia [1, 2]. This disease was described for the first time in 1906 by Alois Alzheimer, a German psychiatrist and neuropathologist, by observing the pathological feature of this disease in the brain pathology of a patient diagnosed with verbal and behavioral disorders [1, 2]. Alzheimer in itself impairs brain abilities such as memory, judgment, language and the power of decision making. It causes negative tensions, sleeping problems and destructive behaviors, such as isolation, depression, agitation and aggression, As the Alzheimer’s disease progresses, other symptoms such as impairment in reality testing, confusion and anxiety adds to the previously mentioned problems [3]. One of the major challenges that communities face today is the increase in patients with Alzheimer’s disease [4]. Behavioral disorders in patients diagnosed with Alzheimer’s disease is one of the common issues [5, 6] that has unpleasant effects not only on the patient but also on caregivers of those patients and their supporting system [7]. DNA Micro-arrays are usually identified as DNA chips or biochips. They are a collection of microscopic DNA spots attached to a solid surface. Scientists use DNA Micro-arrays to measure the expression levels of a large numbers of genes simultaneously, or use it in the genotype of a gene’s multiple regions [8].
In a study entitled "gene expression profiles of multiple genes in single neurons of Alzheimer’s disease [9]", Northern blot, dot-blot have shown transcriptase along with analyzing reverse polymerase chain reaction, altered levels of expression in several messages in the brain of individuals diagnosed with Alzheimer’s disease. Since not all the cells are equally affected, this method clearly can study changes associated with this disease in single cells. Gene expression in single neurons in the early and later stages of Alzheimer’s disease is presented using single cells’ antisense RNA profile and statistical tools for data analysis has been described. In this report, we can diagnose this disease based on altered expression of several messages with the multivariate standard analysis. We compare the results of this method with results obtained from analyzing in situ hybridization to validate this method. When the average sub-units of nerve fibers were used as a biomarker, results obtained from an anti-sense RNA profile showed no change in the average sub-units of nerve fibers between the early and latter stages of Alzheimer’s disease. These findings is consistent with the results obtained from situ hybridization. However, results obtained from the both analysis in the single-cell level is different from the reported decrease in the Neocortex Alzheimer’s disease by Northern blot [9]. We can refer to the standard multivariate analysis from the sample studies conducted in 2002, which can diagnose the disease based on altered expression of several messages. We compared results of this method with results obtained from analyzing in situ hybridization to validate this method. When the average sub-units of neuron fibers were used as the biomarker, results obtained from a sense RNA profile showed no change in the expression of the average sub-units of the neuron fiber between the early and latter stages of Alzheimer’s disease which is consistent with results obtained with situ hybridization. However, results obtained from both cases of the analysis in the single-cell level is different from the reported decrease in the Neocortex Alzheimer’s disease obtained from Northern blot [10]. Therefore, the strategy of using single cell RNA sensor method to identify the altered gene expression in the brain of patients diagnosed with Alzheimer’s disease after death precisely with situ hybridization studies to find the related genes is a valuable research. One year later, Marcotte and Srivastava summarized the relationship between Alzheimer’s disease and Schizophrenia as the representative studies on neurological areas through a research of earlier studies on microarray cDNA and Proteomic [11].
2. Objectives
According to the importance of Alzheimer’s disease and lack of a definite treatment for this disease, we decided to identify the effecting genes on this disease by using Micro-array technology.
3. Methods
In this analytical study first, experiments relevant to the subject matter were conducted by the microarray method in order to build the corresponding database. Then, we search the microarray libraries appropriate to the subject under study. To do this, we should visit the (national center for biotechnology information) NCBI site. Anybody can access and download public GEO data. The GEO database is designed to provide and encourage access within the scientific community to the most up to date and comprehensive gene expression .The gene expression omnibus (GEO) is a public repository that archives and freely distributes microarray, next-generation sequencing, and other forms of high-throughput functional genomic data submitted by the scientific community. Alzheimer’s disease is the subject of our study, so we continue our work by searching Micro-arrays relevant to Alzheimer’s disease. Each library consists of three subcategories and their codes are also presented with their abbreviations.
Sample: each microarray library consists of a set of conducted experiment samples and is formed in different times and situations and starts with the letters GSM. (Eg: GSM 32536).
Series: A set of samples that are placed alongside each other to create a complete microarray experiment starting with the letters JSE (e.g.: GSE 8322).
Platform: Starts with the extension JPL and is a collection of series. In figure 1-3, the platform of an experiment is seen.
To download the library, firstly, we entered in the series. For this user, we click on codes with GSM.
For this user, click on the codes with GSA abbreviation suffix and when the library profile opens, we can download a complete library in a zip format in the bottom of the page. From among the libraries found from our search, 5 libraries had our preferred conditions. We will explain each of them in the Table 1, respectively: First, we should normalize the data by expression console software, the reason for data normalization is that this data have some noise normally, and to remove the light intensity noise at the time of the experiment, data must be normalized.
| Sampled Region | Sample Number | Study Item | Year | Series | |
|---|---|---|---|---|---|
| Diseased | Control | ||||
| Hippocampal genes | 22 | 9 | Alive human | 2004 | GSE1297 |
| Entorhinal cortex | 10 | 10 | Alive human | 2006 | GSE4757 |
| Hippocampal genes | 22 | 8 | Alive human | 2011 | GSE28146 |
| Hippocampal genes | 8 | 8 | Alive mouse | 2012 | GSE32536 |
| Frontal cortex- Hippocampal Temporal cortex | 32 | 47 | Alive human | 2013 | GSE6980 |
3.1. Data Normalization by Expression Console Software
Firstly, we must normalize the data using expression console™ software 1.3.1. The reason for data normalization is that this data have a little noise normally, we must normalize the data to remove the noise caused by light intensity at the time of the experiment. The powerful multi-array average algorithm is a powerful linear model in the probe level for minimizing the effect of affinity difference between specific probes. This approach increases the sensitivity to small changes in test and control samples. RMA is a multi-chip approach; therefore, all intended arrays for comparison must be included together in the summarization stage (last stage). In the last stage of working with Expression Console Software, output must be taken from the normalized data.
3.2. Micro-Array Analysis by Flex-array Software
In the next step, by designing an experiment and performing it on control and diseased samples, we identified genes with expression change. In order to do this, we entered normalized data into the Felx-array software 1.6.3.
3.3. Designing the Experiment
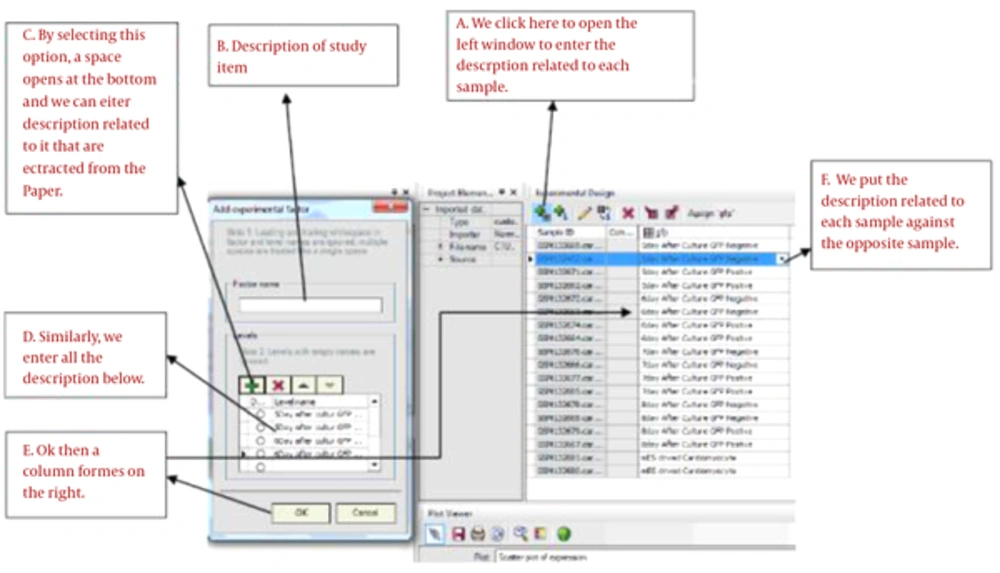
First, samples must be divided based on the method provided in this paper. In order to do this, first we referred to the method in this paper and then we named the samples in Micro-array description field. In the cases we studied, designing tests for diseased samples and control samples were extracted from the paper and were named. The complete test steps are described in Figure 1.
Some experiments must be designed for each 5 libraries. 1297GSE in this library, required samples from the Hippocampal region of alive human has been sampled. Samples consisted of 4 groups which included the healthy samples and the diseased samples divided into 3 groups of severe, medium and weak disease intensity. The healthy group was compared with each diseased samples and samples having over expression and down expression were identified. 4757GSE of this sampling was conducted from the Entorhinal cortex of alive human brain. Sampling was conducted in both groups of healthy and diseased. 28146GSE in this experiment, required samples from the Hippocampal region of alive human have been sampled. Samples consisted of 4 groups which included the healthy samples and the diseased samples divided into 3 groups of severe, medium and weak disease intensity. The healthy group was compared with diseased samples and samples with over expression and down expression than the healthy group were identified. 32536GSE of this experiment sample was sampled from alive mouse. 16 samples cases exist in this experiment which 8 cases are diseased and 8 cases are healthy. 6980GSE in this open experiment was the alive human sample again, with the difference that the sampled region was from the three part of temporal cortex, frontal cortex and hippocampus. There are 79 samples in this experiment including 47 healthy samples and 32 diseased samples.
3.4. Conducting the Experiment
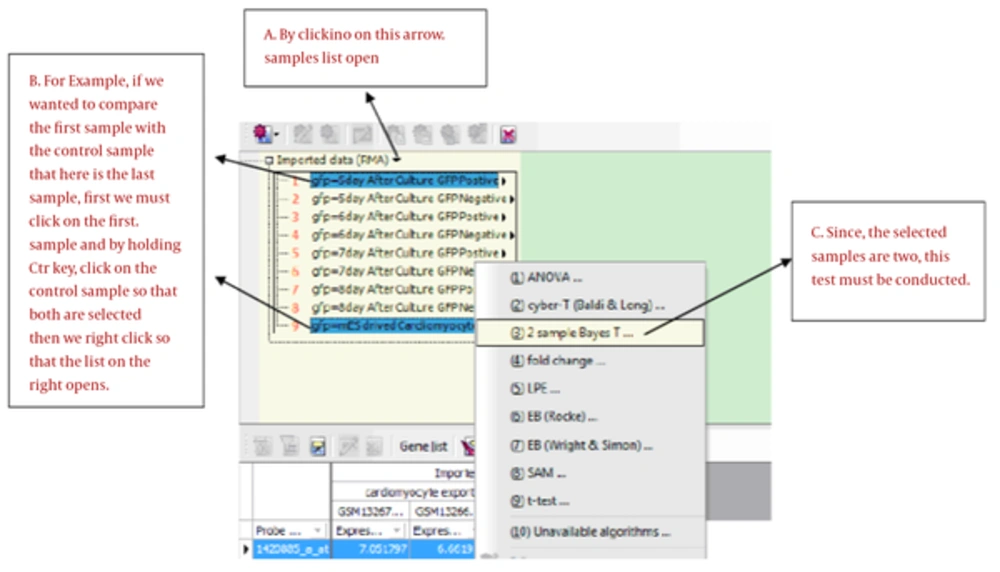
In this stage, Bayes t-test was conducted on each sample V.S. the control sample. According to the method mentioned in the paper, we can categorize, compare and perform the algorithms. Bayes T Test is in a way that an analogy must be made between the two groups. In each experiment, a control sample (healthy) is compared with diseased samples of weak, average and severe disease intensity. So, in each library, 3 experiments were conducted. We can see in Figure 2 how the experiment is conducted.
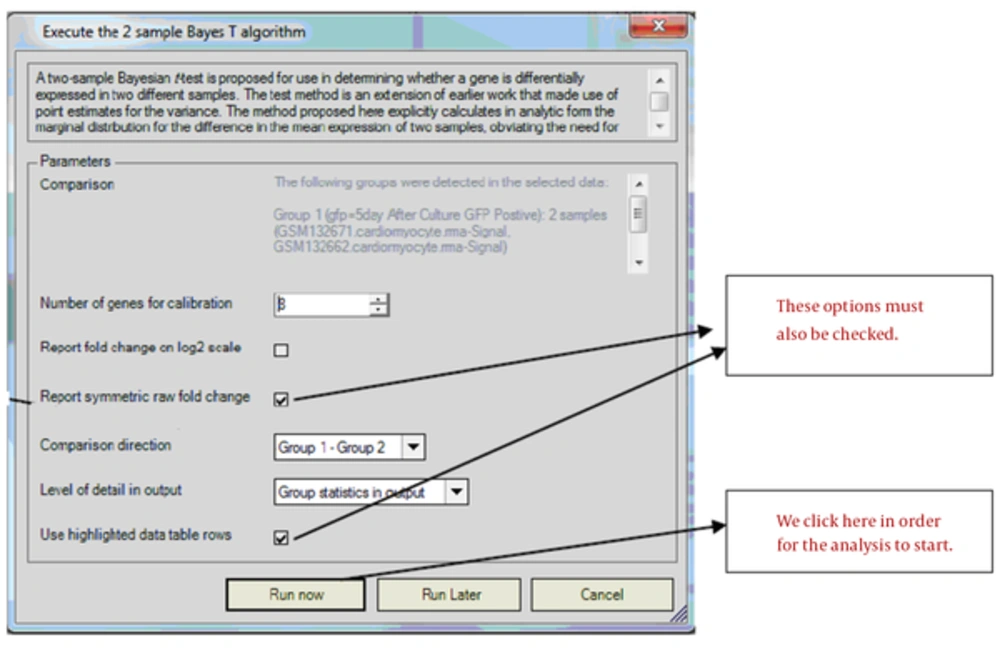
Then, the window in Figure 3 opens, we checked the necessary options and specified that the comparison should be made between which groups.
3.5. Applying Limitations on the Analysis Results
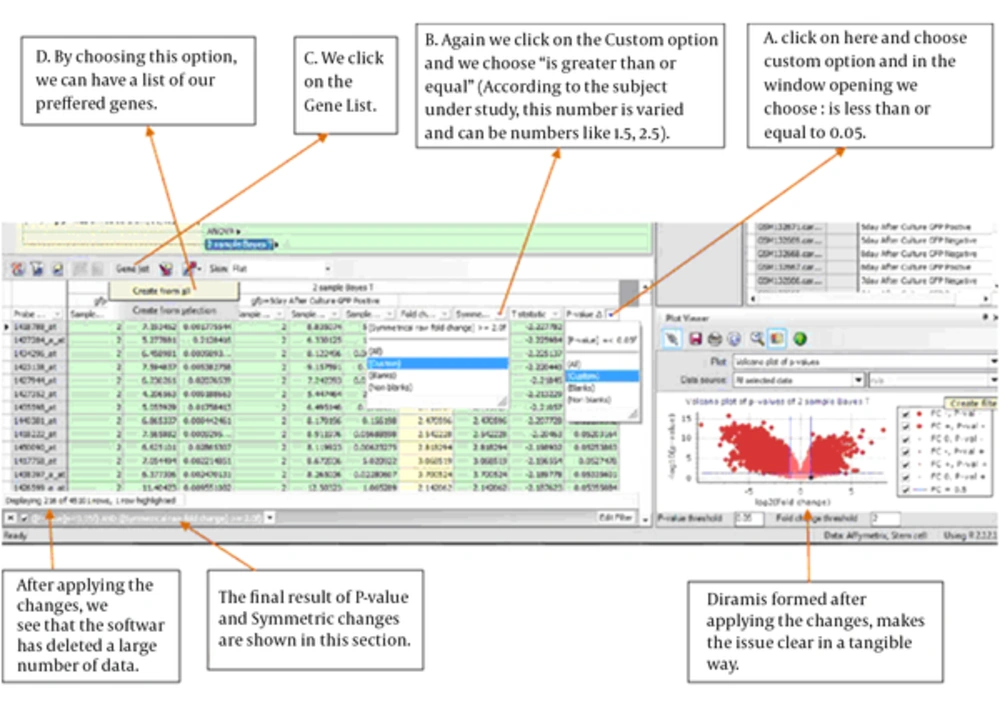
In order to specify gene expression changes or lack of change and the level of it in the test against control sample, the expressed values of the same gene in a test sample is divided by the expressed values of that same gene in the control sample. This method is called fold change, if this is more than a specified values (Here more than +1/5 and less than -1/5), gene is expressed altered. We used Bayes T to perform the analysis and corrected P-value are used to show the significance of changes in the data collection. R software is used to perform the analysis of this research. The stages of applying the limitations on Figure 4 is shown as is shown below. We conducted this stage once with +1/5 and once with -1/5 values.
4. Results
We examined 5 libraries related to the Alzheimer’s disease, in each of these tests, specific regions of the brain have been sampled. This shows that extensive results have been obtained. After conducting the experiment on each of the 5 libraries and comparing healthy and diseased genes in different cortical layers of the brain, between samples with different disease intensity, it was observed that a few genes in these tests are in common. After removing all the iterations and after obtaining all the test results from the library, we found that genes having gene expression have the most changes which are shown in the tables below. After integrating all the test results and removing the repeated results, we identified 5 genes with over expression which are shown in the Table 2. In the tabulation, we can see that over expression belongs to XIST X inactive specific transcript with 8/68652 change in value.
| Probe Set ID | Gene Name | Fold Change |
|---|---|---|
| 235446_at | XIST X inactive specific transcript | 8.68652 |
| 221728_x_at | XIST X inactive specific transcript | 5.361924 |
| 224588_at | XIST X inactive specific transcript | 4.702068 |
| 243712_at | XIST X inactive specific transcript | 3.330641 |
| 33323_r_at | SFN | 3.823175 |
| 214218_s_at | XIST X inactive specific transcript | 3.73422 |
| 1565483_at | EGFR | 3.626728 |
| Probe Set Id | Gene Name | Fold Change |
|---|---|---|
| 221730_at | COL5A2 | -4.561804 |
| 221805_at | NEFL | -4.432566 |
| 221729_at | COL5A2 | -4.353842 |
| 203798_s_at | VSNL1 | -4.080669 |
| 213436_at | CNR1 | -3.972829 |
We followed this method to find the highest levels of decrease in expression. We identified them after the integration of the results of all tests and removing duplicate results of 5 genes with the highest decrease in expression which are shown in Table 3.
In the tabulation we can see that the highest decrease in expression belongs to 2A5COL gene with low rates of 4/561804 negative changes.
5. Discussion
Alzheimer’s disease is the most important degenerative brain disease which equally can be seen in both men and women. It appears both hereditary and accidental. The accidental kind is the most common and the most causes for it is the effect of unknown environmental and metabolic factors [12]. The increasing rates of Alzheimer incidence is warning which is becoming a social concern of many countries [1, 2]. In America, this disease is considered as one of the ten causes of mortality. In a study recently conducted in Hopkins university, it has been estimated that in 2050 from each 85 individuals from the earth population, one will be diagnosed with Alzheimer’s disease [13]. Micro-array technology is a very powerful method providing the opportunity for studying the expression of thousands of genes simultaneously and identifying thousands of protein interaction [14].
This technology has two major sub-categories: DNA possibility and protein. Using DNA micro-array provides the micro-array for studying the expression of thousands of genes simultaneously. The aims of such gene analysis are as follows: First: How to explain the effect of any single gene on other genes, second: How gene is expressed in healthy and diseased cells. For example, different types of cancer have similar morphologic symptoms, so we can provide direct diagnosis methods by using gene expression data.
On the other hand, protein array is a kind of measuring method which can provide help for medical experts with measuring and existence of proteins in the biological sample including blood [14]. Analyzing gene expression and its changes are effected by factors like: treatment, pathogens, and cell damage [15].
Since 1998, researches have been conducted by micro-arrays about Alzheimer’s disease and as an example, a study entitled "gene expression profiles of multiple genes in single neurons of Alzheimer’s disease [9]", is the Genotype of a cell’s genetic makeup, an organism or an individual with an indication to a certain preferred features, in this research Northern blot, dot-blot and transcriptase along with analyzing reverse polymerase chain reaction have shown altered levels of expression in several messages in the brain of individuals diagnosed with Alzheimer’s disease. Since, all the cells are not affected by this disease, this method clearly can study the changes in relation to the disease in the individual’s cells.
Our study aimed to identify the biomarker, first, using the pre-prepared samples taken from different areas of the brain of those affected by Alzheimer’s disease, using the RMA algorithm, we started to normalize the samples and then by designing tests comparing healthy samples with control samples, we identified genes with change in their expression. These tests were designed with Flex array software and T Bayes test, a powerful algorithm for the comparison between the two groups, was used to identify the genes with change in their expression. Due to the large number of results were obtained, and to increase the accuracy of test, results were limited to values with change in expression that is more than 5.1 and less than 5/1. Identifying these biomarkers is important in a way that they accelerate disease diagnosis process and in many cases inhibit disease incidence in the individual and its progress with preventive actions.
The important effect of Beta Amyloid and E- T PAZ and Kinase and microglobulin genes in Alzheimer’s disease is validated in the previous researches too. In a research conducted in 2001 in Saint Mateu, California on Alzheimer’s disease, 31 genes had an over expression and 87 genes had a down expression which was completely consistent with our samples and some of the unknown genes also were added to the list of genes previously had a role in the incidence of Alzheimer’s disease [16].
In this research, some xist genes were observed between genes with over expression or down expression in their gene, which were not present in the results of the previous studies and this shows the adding of this list to the effecting genes in the incidence of this disease.
According to the differences in the samples and difference in the disease intensity between the used samples in this study and other studies, differences in the intensity of expression are shown. In a research conducted in 2001, researchers identified Alzheimer’s biomarkers in a few mice [17], and again we had common results to an extent. However, it was necessary to find more accurate and more reliable results, so that this study would be conducted on human samples and with sampling of different brain segments. In this study, as already expressed, samples included human and mouse with different disease intensity and male and female gender and also sampled regions in the brain including, temporal and frontal and hippocampal brain cortexes which will present comprehensive results which no study has been conducted to this extent.
Early studies similar to this study worked on a certain cortex of the brain or a certain sample, such as dead or alive human and/or mouse. That is the reason our results are more comprehensive than other studies and genes besides the previously identified samples have been added to the list of biomarkers. As an example, in 2004 a study conducted entitled Micro-array analysis in Alzheimer’s disease and normal aging which identified genes with expression change by sampling brain cortex. The results of this experiment is consistent with the results obtained from this study, as an example beta, Actin, 21 Ribosomal protein L, Eukaryotic translation initiation factor 5A, Neuronal thread protein genes in this study introduced with the highest expression [18] which also are present in the result of our study, but are not present because of the less expression change are not present between the mentioned genes, as mentioned only slight differences exist in gene expression level which is normal according to the difference in the samples.


