


1. Background
Optimal sports performance through a series of training may be fully achievable when physiological and motor fitness attributes of athletes are monitored and strengthened (1). Along with effective physiological functioning, power, speed, muscular strength, muscle endurance, and coordination play significant roles in various sports disciplines (2). An efficient soccer training potentiates cardiorespiratory capacity, power, agility, and speed improvement (3). A study had shown that cardiorespiratory capacity and endurance would provide immediate oxygen availability during the recovery phase of high-intensity games (4).
Although few studies have been conducted on female athletes (5), the women’s world championship that began over six decades after the FIFA Men’s World Cup with only twelve participating countries proved the athletic potentials of females over and over again. It has been observed that optimal trophy has however continued to elude most African female athletes (teams) due to irregularity information on age, administrative lapses, sponsorship issues, lack of training equipment, and required health and fitness data. We also noticed that the coaching crew of most typical Ghanaian female teams worked without consistent monitoring of physiological and motor attributes of their athletes. This would negatively affect optimal performance at international competitions irrespective of technical competency of coaches. It can be reiterated that although athletes’ poor performance might also be attributed to physiological and motor inefficiency, coaches usually associated with poor athletic performance to suboptimal performance during competitions. To achieve the best female players, Optimal sports performance should not be limited to training tactics solely rather than the gathering of holistic and comprehensive health information (6).
We have observed that female athletes received little attention from necessary quarters before, during and after competitions in most African countries including Ghana. We suggest that the underperformance period of Ghanaian female athletes in all sports competitions should be accompanied by health consideration. Since some of the national female athletes are recruited from the universities across the country; documenting baseline pilot data of a-university athletes’ health outcomes could be crucial for a nation-wide investigation. Obesity has also become a common health concern among all, especially females. Although prominent effects of the participation in sports on females’ physiological and motor outcomes have been well investigated, comparative evidence among female athlete and non-athlete students in a Ghana University is needed.
2. Objectives
This pilot study comparatively investigated the physiological and motor performance parameters of female athlete and non-athlete students in a Ghana University.
3. Methods
3.1. Design and Participants
This cross-sectional descriptive study used thirty-one female undergraduate students. Students who registered with the Sports Directorate of Kwame Nkrumah University of Sciences and Technology (KNUST) as athletes in game/sports of interest were purposefully recruited. Those recruited female athletes had represented KNUST at least once in the Ghana universities sports association (GUSA) games, on weekly bases train three times offseason and five times before the competition by coaches in the University Sports Directorate, and compete once every semester for three years. For the purpose of comparison, nine non-athletes females were recruited through judgmental sampling technique. Both groups of athletes (22, 71.0%) and non-athletes (9, 29.0%) had no history of diabetes mellitus, angina, hypertension, dyslipidemia, hyperuricemia, coronary heart diseases, musculoskeletal disorders, and any form of disability.
3.2. Measurements
3.2.1. Anthropometric
Height, weight, and body mass index (BMI) were measured according to the protocol of the International Society for the Advancement of Kinanthropometry. Height (m) and body weight (kg) were measured with the Health-O-Meter (HY-RGZ160 Weight and height measuring scale, China). The BMI was determined as the ratio of body weight (kg) value divided by the square value of height (m). Total body fat, visceral fat, and muscle mass were measured using (Omron BF-511 body composition scale).
3.2.2. Physiological
Automatic blood pressure equipment (Omron BP Monitor M10-IT) was employed to measure blood pressure (systolic and diastolic) and heart rate in the sitting position after a five-minute rest. The average of three consecutive readings was recorded. Maximum oxygen uptake (Vo2max) was measured by the exact time participants run a distance of 1.5 miles as fast as possible on the standard athletic track. Cardiovascular endurance was measured by employing Harvard step test method. Athletes stepped up and down standard gym bench (45 cm above the ground) once every two seconds for five (5) minutes (approximately 150 steps). Athlete’s heart rate (bpm) were recorded at intervals of one minute (pulse 1), two minutes (pulse 2), and three minutes (pulse 3) after finishing the test.
3.2.3. Motor Performance
Power of arms and shoulders were measured with overhead medicine ball throw against a vertical wall. An average distance of three consecutively released medicine balls over the head while standing 20 cm from the vertical wall was recorded. The explosive power of legs was measured by standing behind a marked line or take-off board with feet parallel to each other. Athlete jump as far as possible with the knees bent and swing arms to take-off in the forward direction. Each athlete was given three trials for the test and the farthest distance was used for scoring. Illinois agility run was conducted to elicit maneuverability skill of the athletes. The time when the course was completed was recorded. Athletes began the running from “start cone” and negotiated through the course around the cones to the “finish cone”. Thirty-meter dash was used to measure the speed performance of the athletes. The returning time to the nearest second on a standard running track was recorded.
3.3. Data Analysis
Statistical Package for Social Science (SPSS version 23.0) was used for data analysis. Mean, standard deviation, independent sample t-test (Table 1) to compare differences between athletes and non-athletes, one-way analysis of variance (ANOVA) with multiple comparisons of Tukey’s HSD post-hoc (Tables 2 and 3) were analyzed among sporting disciplines. The P value less than 0.05 considered statistically significant.
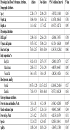
| Physiological and Motor Performance Attributes, Demographic Attributes | Athletes | Non-Athletes | 95% CI | P Value |
|---|---|---|---|---|
| Age, y | 22.18 ± 1.79 | 21.00 ± 2.50 | -3.45592, 1.01148 | 0.243 |
| Weight, kg | 56.94 ± 9.84 | 56.36 ± 7.62 | -11.45501, 8.96613 | 0.786 |
| Height, m | 1.61 ± 0.62 | 1.57 ± 0.52 | -10.47155, 1.02711 | 0.095 |
| Physiological attributes | ||||
| BMI, kg/m2 | 21.89 ± 3.83 | 22.66 ± 2.50 | -2.63806, 3.70473 | 0.708 |
| VO2max, mL/kg/min | 39.55 ± 3.02 | 35.00 ± 2.24 | -6.11154, -1.66624 | 0.004b |
| Heart rate, bpm | 73.68 ± 12.67 | 76.00 ± 13.04 | -11.34174, 18.23062 | 0.606 |
| Body composition, % | ||||
| Body fat | 30.11 ± 8.58 | 32.97 ± 5.97 | -2.83001, 9.20779 | 0.257 |
| Muscle mass | 28.83 ± 3.55 | 27.41 ± 2.99 | -4.48879, 0.44435 | 0.095 |
| Visceral fat | 3.46 ± 1.471 | 3.06 ± 1.59 | -2.40236, 1.40236 | 0.561 |
| Blood pressure, mmHg | ||||
| Systolic | 109.73 ± 12.05 | 111.67 ± 20.51 | -12.41843, 22.41843 | 0.527 |
| Diastolic | 71.91 ± 9.59 | 76.00 ± 14.68 | -7.07675, 10.63230 | 0.656 |
| Motor performance attributes | ||||
| Power of arms and shoulders, Watts | 5.83 ± 1.01 | 4.32 ± 1.99 | -2.45642, -0.62803 | 0.005b |
| Muscle endurance, bpm | 12.35 ± 4.57 | 11.26 ± 1.63 | -9.06401, 2.66845 | 0.244 |
| Power of legs, Watts | 2.13 ± 0.22 | 1.76 ± 0.701 | -0.42133, 0.16799 | 0.351 |
| Speed, s | 5.52 ± 0.725 | 6.28 ± 0.67 | 0.28303, 1.84141 | 0.014b |
| Agility, s | 18.50 ± 2.40 | 18.05 ± 2.03 | -3.24047, 1.15380 | 0.305 |
Comparison of Physiological and Motor Performance Attributes Between Athletes and Non-Athletesa
| Attributes | Athletics | Soccer | Netball | Badminton | F-Ratio | P Value |
|---|---|---|---|---|---|---|
| Weight, kg | 56.53 ± 7.95 | 52.23 ± 6.05 | 66.17 ± 11.21 | 51.45 ± 9.40 | 3.663 | 0.032a |
| BMI, kg/m2 | 21.14 ± 2.42 | 19.98 ± 1.63 | 26.37 ± 4.23 | 18.95 ± 0.78 | 7.700 | 0.002a |
| Body fat, % | 29.36 ± 8.34 | 24.79 ± 4.50 | 39.56 ± 7.44 | 27.50 ± 4.24 | 6.583 | 0.003a |
| Muscle mass, % | 28.98 ± 4.13 | 31.20 ± 2.13 | 25.70 ± 2.90 | 27.15 ± 1.48 | 4.632 | 0.140 |
| Visceral fat, % | 3.40 ± 1.14 | 2.67 ± 0.71 | 5.00 ± 1.67 | 2.50 ± 0.71 | 5.507 | 0.007a |
| VO2max, mL/kg/min | 40.40 ± 2.41 | 40.67 ± 1.58 | 36.50 ± 3.73 | 41.50 ± 0.71 | 4.148 | 0.021a |
| BP systolic, mmHg | 116.80 ± 12.29 | 110.00 ± 14.20 | 104.00 ± 8.94 | 108.00 ± 1.41 | 1.049 | 0.395 |
| BP diastolic, mmHg | 73.00 ± 7.81 | 73.67 ± 12.19 | 70.50 ± 8.62 | 65.50 ± 0.71 | 0.425 | 0.737 |
| Heart rate, bpm | 73.20 ± 12.64 | 70.78 ± 11.81 | 81.83 ± 12.29 | 73.68 ±12.67 | 1.524 | 0.242 |
| Power of arms and shoulders, Watts | 5.73 ± 0.63 | 5.61 ± 1.03 | 6.19 ± 1.05 | 5.73 ± 2.23 | 0.314 | 0.815 |
| Muscle endurance, bpm | 11.52 ± 1.70 | 11.79 ± 1.31 | 14.48 ± 8.65 | 10.60 ± 0.14 | 0.594 | 0.627 |
| Power of legs, Watts | 2.31 ± 0.25 | 2.15 ± 0.10 | 1.99 ± 0.28 | 2.05 ± 0.07 | 2.523 | 0.090 |
| Speed, s | 5.45 ± 0.72 | 5.10 ± 0.33 | 5.87 ± 1.03 | 5.63 ± 0.60 | 1.549 | 0.236 |
| Agility, s | 18.19 ± 1.17 | 17.36 ± 1.77 | 21.40 ± 1.53 | 15.68 ± 0.88 | 10.945 | < 0.001a |
Physiological and Motor Performance Attributes of Athletes Across Sporting Disciplines
| Variable | Athletes (I) | Athletic Groups (J) | Mean Difference (I - J) | P Value | 95% CI |
|---|---|---|---|---|---|
| Weight, kg | Netball | Soccer | 13.93 | 0.026 | 1.45, 26.41 |
| BMI, kg/m2 | Netball | Athletics | 5.39a | 0.034 | 0.35, 10.43 |
| Soccer | 6.21a | 0.002 | 2.20, 10.24 | ||
| Badminton | 7.42a | 0.020 | 1.04, 13.80 | ||
| Body fat, % | Netball | Soccer | 13.99a | 0.003 | 4.39, 23.59 |
| Muscle mass, % | Soccer | Netball | 5.11a | 0.018 | 0.77, 9.45 |
| Visceral fat, % | Netball | Soccer | 2.20a | 0.010 | 0.49, 3.92 |
| VO2max, mL/kg/min | Soccer | Netball | 4.00a | 0.029 | 0.34, 7.66 |
| Agility, s | Netball | Athletics | 2.96a | 0.035 | 0.18, 5.74 |
| Soccer | 4.05a | 0.000 | 1.83, 6.27 | ||
| Badminton | 5.72a | 0.001 | 2.20, 9.23 |
Tukey HSD Post-Hoc
4. Results
The results showed that 20 (64.5%) of the participants were within the age range of 20 - 22 years. 3 (9.7%) of the non-athletes were underweight, 19 (61.3%) were with normal weight, 7 (22.6%) overweight, and 2 (6.5%) of the non-athletes obese. The mean age of athletes was (22.18 ± 1.79), while non-athlete was (21.00 ± 2.50), the mean weight of athletes was 56.94 ± 9.84 and non-athletes was 56.36 ± 7.62; and the mean height was 1.61 ± 0.62 and 1.57 ± 0.52, respectively.
Table 1 shows that the female athletes had a higher VO2max, power of arms, and shoulders and better speed compared with non-athlete ones.
The comparison of ANOVA homogeneity and equality of variance of means across sporting disciples showed that most of the attributes, except for VO2max, the power of arms and shoulders, and the speed, were not significant (P > 0.05). Further analysis performed on significant attributes using adjusted F test of Brown-Forsythe statistic revealed that muscle endurance and speed do not violate assumption (P > 0.05). This suggests equal variances among mean scores of all attributes except for BMI, muscle endurance, and VO2max (P < 0.05).
Significant differences were observed in weight, BMI, %body fat, visceral fat, VO2max, and agility among sporting disciples (Table 2). For the specific direction of significance (Tukey post-hoc in Table 3), Netball players had higher weight, BMI, %body fat, and agility with lower visceral fat and VO2max compared with that of soccer players, athletics, and badminton players. Soccer players had higher muscle mass and VO2max compared with players in other sporting disciplines.
5. Discussion
The current pilot study comparatively investigated the physiological and motor performance parameters of female athlete and non-athlete students in a Ghana University. The findings revealed that both groups have similar attributes with minor differences. Noticeable similarities consisted of age, weight, body mass index (relative body weight), blood pressure, muscle mass, visceral fat, muscle endurance, the power of legs and agility (Table 1). The findings imply that sports participation insignificantly contributes to health outcomes of female students, which negate initial postulations (7-12).
Although most physiological and motor performance parameters of athletes in this study were insignificantly different from non-athletes, our study showed that the female athletes were older than the ages reported in many studies (13-15), while some reported younger ages in few studies (16). These female athletes had normal weight according to a systematic reviewed of Nuttall (17) and were below the average in maximal oxygen uptake (18).
The findings of our study on body composition parameters -body fat, muscle mass, and visceral fat- were not congruent with the recent work, which examined the relationship between the body fat percentage and anthropometric measurements in athletes compared with non-athletes (7). In fact, these female athletes had a mean heart rate less than the lower limit of black female non-athletes reported by Hart (19). It would best be described that the obtained heart rate rendered the athletes unfit for the nature of their game. However, the mean value of the blood pressure of female university athletes in this study was considerably consistent with the literature (20, 21).
The means of motor performance attributes- the power of arms and shoulders, muscle endurance, the power of legs, speed, and agility- in this study were less than the values recorded in the work of Manske and Reiman (22). Our findings showed that female netball students were averagely overweight than all the other sports groups with a BMI score of 26.37. This finding was compared with the study of Nikolaidis (23) who reported a high prevalence of overweight (27.5%) among adolescent volleyball players. Also, comparing the average BMI score to standard, it is realized that the healthier groups are the soccer and athletic groups with a score of 20.98 and 20.16 repetitions, respectively. The fairly healthy group is badminton with 18.95 repetitions and the overweight group is the netball group. Hence, the netball group needs to work on BMI by reducing its weight.
Female soccer students in this study, on average, had more muscle mass than athletic, badminton and netball students. However, they had relatively the least body fat scores in comparison to athletic, badminton, and netball students. Badminton students had the least muscle mass and visceral fat scores compared with soccer, athletic, and netball students. Similar outcomes have been reported that female senior soccer players possessed more muscularity than shot putters and athletics, which are consistent with the results of the current study (11, 24). Considering visceral fat, athletics, soccer, badminton, and netball fall into the standard category. Researchers have mentioned that more mass means greater muscular force, and higher energy expenditure is required (25). The results denote that female soccer students produce more muscular force and expend more energy than athletic, netball, and badminton students.
Given the motor performance attributes, agility was the only attribute with a statistically significant difference value. Researchers have established that one of the essential components in most fields and sports teams is agility (26). Agility is an important factor in determining motor performance attributes. Comparison of the motor performance attributes with standard age categories indicated that the age category of 17 - 19 has cardiovascular endurance levels in the average rate. Age category of 20 - 22 and 26 - 28 have endurance levels at an excellent rate. However, the age category of 23 - 25 has endurance levels at a good rate.
With respect to the power of legs, age categories of 17 - 19 and 20 - 22 fall into the very good rate, and age categories of 23 - 25 and 26 - 28 fall into an excellent rate. However, in terms of sports groups, badminton, soccer, and athletics fall into an excellent rate and netball falls into the very good rate. Finally, regarding the power of arms and shoulders, all the sports groups fall into an excellent rate. In terms of age categories, all the age categories also fall into an excellent rate. Anaerobic power is the muscle’s ability to exert high force while contracting at a high speed (27). Volleyball performance heavily relies upon force generated from the lower body. Athletes require large amounts of power in order to produce elite level vertical jumps (28).
5.1. Conclusions
The female athletes have similar physiological and motor performance attributes to non-athlete. It is suggested that participation in sports of these university female students did not lead to healthy physiological and motor performance outcomes. Training of university female athletes should emphasize health outcomes, while motor performance attributes are prioritized.
