


1. Background
As a predictor of Cardiovascular Diseases (CVD), Cardiorespiratory Fitness (CRF) refers to the capacity of respiratory and cardiovascular systems to provide muscles with oxygen (1). It can reduce the risk of chronic diseases, promote overall cardiovascular and general health, improve the quality of life, and delay CVD and mortality (2).
A criterion measure of CRF is Maximum Oxygen Uptake (VO2max), the maximum amount of oxygen that a person can consume during maximal activity, typically expressed in ml/kg/min (1). Another parameter that measures CRF is Rate Pressure Product (RPP) (3). This parameter is used in cardiology to determine the workload of the heart and reflects hemodynamic responses (4).
There are several modifiable (low physical activity, overweight, etc.) and non-modifiable (age, ethnicity, family history, etc.) health risk factors that can affect CRF and lead to cardiovascular mortality (5). Modifiable risk factors can be reduced by changing the lifestyle (5). weight and physical activity are two of the most important modifiable risk factors that can affect CRF in a healthy lifestyle (6).
Regular Physical Activity (PA) by effecting hemodynamic responses, such as blood pressure, Heart Rate (HR), and myocardial work (3), and weight control can improve CRF (1). The frequency, intensity, duration, mode, and energy expenditure of PA are important variables for enhancing fitness and health (1). There are several methods for assessing PA, each of which has some disadvantages and advantages, and the method of choice can be selected based on purpose (1). The International Physical Activity Questionnaire (IPAQ) was proposed by the World Health Organization (WHO) as a standard PA questionnaire. The outcomes of IPAQ, particularly those related to vigorous PA, can lead to reliable CRF estimation (7). The pedometer is the simplest motion sensor and a non-invasive approach without interfering with daily life. This instrument is used to determine the level of PA in large groups (8).
Both low levels of PA and body shape and composition have shown consistently to be powerful predictors of CRF and they are often measured together (9). Complex factors that can cause obesity, including living environment, genetic factors, and lifestyle are related to behaviors such as PA, nutrition, and socioeconomic factors (10). The living environment has been reported to influence health risk factors related to CRF and be associated with obesity (11). As expected, obesity-related features such as Body Mass Index (BMI) and body shape differ significantly between geographical regions (10). A sedentary lifestyle by the design of the living environment may be one of many factors contributing to increasing obesity in communities (12). Living environmental factors, like cues to exercise, can dedicate barriers to PA participation or augment regular activity (11). In the context of the public health goal, walking, as one of the most common types of PA, is most to be amenable to change based on the built of the living environment (12).
Many studies have focused on CRF and health risk factors in different student communities, both inside and abroad (8, 13, 14). There are a lot of differences between Iran and Italy. Their cultures, geography, public health status, and educational systems are different. The understanding of regional variations in obesity, PA, and CRF among students of different regions can provide planning knowledge to improve and change the lifestyle.
2. Objectives
The objective of the present study was to compare health risk factors affecting CRF of Iranian and Italian male and female exercise science students. The correlation between VO2max and these factors were also evaluated.
3. Methods
3.1. Participants
The study sample included 87 exercise science students that were selected from the University of Mazandaran (20 males and 25 females) and the University of Milan (25 males and 17 females). A stratified sampling method was used to select the subjects. Based on initial medical examinations, subjects did not have heart disease and chronic illness. Also, they were not professional athletes and passed the same practical units. Before participation, all participants signed informed consent forms. Besides, the study followed the guidelines of both Universities’ Ethics Committees.
3.2. CRF Assessment
The Bruce test protocol is usually used to assess VO2max (15). It is a treadmill test that involves several stages lasting three minutes each. The test started with warm-up at a speed of 2.7 km/h and a 10% incline. At the end of each stage, the incline and speed increased until the participant reached volitional fatigue (13). Then, VO2max was estimated using the Bruce protocol formula by Foster et al. for males and females (Equations 1 and 2) (15).
T: Total time on the treadmill as a fraction of minute
Besides, HR was continuously monitored using a Polar HR monitor (mod. S810, Polar, Finland). Systolic Blood Pressure (SBP) and Diastolic Blood Pressure (DBP) were determined by a blood pressure monitoring device (mod HS-201N, Nation). The RPP was calculated as the product of HR and SBP (3), and HR Recovery (HRR) as the difference between HR at peak exercise and after six minutes of recovery. These parameters were measured at rest, immediately, and six minutes after the test.
3.3. PA Measurement
Step counts: The pedometer stored the number of steps in its memory. Participants were requested to wear a pedometer for three to seven days, as worn in most studies (16), conform their habitual life, and pick up the pedometer only during bathing or sleeping.
IPAQ-S: All students were provided with the Italian and Iranian versions of the short form of IPAQ. According to the IPAQ-S scoring protocol, MET-minutes/week of vigorous PA was computed by multiplying the MET value of vigorous activity by the hours spent in that activity (Equation 3) (16).
3.4. Body Composition Measurement
Anthropometric measures were completed as part of the health screening event. Body height and body mass were measured by digital scales and portable stadiometers with 0.5 cm and 0.1 kg accuracy, respectively. Waist Circumference (WC) (around the abdomen at the level of the umbilicus) and Hip Circumference (HC) (at the level of the greatest protrusion of the gluteal muscles) were measured in a horizontal plane. Based on these initial measurements, the study variables were calculated as follows (17, 18):
3.5. Statistical Analysis
The Kolmogorov-Smirnov analysis was performed for all the main variables to assess the normal distribution of the data. Differences between the groups were assessed by the independent sample t-test and the associations of various anthropometric measurements and PA with CRF in each group were assessed by Pearson correlation. The calculations were performed by SPSS version 21 software, and the results were considered statistically significant at P < 0.05.
4. Results
Table 1 shows the mean and standard deviation of the demographic characteristics of the participants. The mean age of the participants was 23.78 ± 2.1 years, the height was 170 ± 5.6 cm, and the body mass was 66.01 ± 7.5 kg.
| Variable | Males | Females | ||||
|---|---|---|---|---|---|---|
| Mazandaran (N = 20) | Milan (N = 25) | P Value | Mazandaran (N = 25) | Milan (N = 17) | P Value | |
| Age (years) | 24.18 ± 1.3 | 24.6 ± 2.1 | 0.564 | 23.03 ± 3.1 | 22.67 ± 1.3 | 0.142 |
| Height (cm) | 173 ± 7.1 | 176 ± 5.2 | 0.398 | 165 ± 5.1 | 166 ± 6.2 | 0.325 |
| Body mass (kg) | 71.25 ± 6.23 | 70.8 ± 5.5 | 0.217 | 61.6 ± 9.4 | 60.41 ± 9.1 | 0.254 |
Demographic Characteristics of the Participants (Mean ± SD)
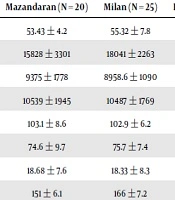
Among the CRF factors, only the differences between RPPmax, SBPmax, and SBPrest (P < 0.05) in males were significant (Table 2).
| Variable | Male | Female | ||||
|---|---|---|---|---|---|---|
| Mazandaran (N = 20) | Milan (N = 25) | P Valuea | Mazandaran (N = 25) | Milan (N = 17) | P Valuea | |
| VO2max (ml/kg/min) | 53.43 ± 4.2 | 55.32 ± 7.8 | 0.365 | 42.91 ± 5.5 | 44.26 ± 5.4 | 0.529 |
| RPPmax (mmHg∙bpm) | 15828 ± 3301 | 18041 ± 2263 | 0.005a | 16295 ± 3015 | 16845 ± 1898 | 0.081 |
| RPPrest (mmHg∙bpm) | 9375 ± 1778 | 8958.6 ± 1090 | 0.123 | 9699.93 ± 1811 | 9732.1 ± 1447 | 0.998 |
| RPPrec (mmHg∙bpm) | 10539 ± 1945 | 10487 ± 1769 | 0.098 | 11162.5 ± 1035 | 10739 ± 2156 | 0.082 |
| HRmax (bpm) | 103.1 ± 8.6 | 102.9 ± 6.2 | 0.739 | 111 ± 9.01 | 110.5 ± 6.1 | 0.082 |
| RHR (bpm) | 74.6 ± 9.7 | 75.7 ± 7.4 | 0.678 | 82.63 ± 10 | 81.5 ± 11.6 | 0.629 |
| HRR (s) | 18.68 ± 7.6 | 18.33 ± 8.3 | 0.739 | 16.9 ± 8.3 | 16.2 ± 7.6 | 0.981 |
| SBPmax (mmHg) | 151 ± 6.1 | 166 ± 7.2 | 0.04a | 141 ± 8.4 | 150 ± 7.2 | 0.062 |
| SBPrest (mmHg) | 129 ± 8.5 | 119 ± 7.2 | 0.049a | 111 ± 6.9 | 115 ± 5.2 | 0.242 |
| SBPrec (mmHg) | 122 ± 9.3 | 123 ± 10 | 0.732 | 112 ± 4.1 | 115 ± 4.7 | 0.271 |
| DBPrest (mmHg) | 84.87 ± 3.3 | 77.23 ± 4.2 | 0.089 | 75.01 ± 4.5 | 77.22 ± 4.1 | 0.156 |
| DBPrec (mmHg) | 83.6 ± 5.1 | 72.8 ± 4.2 | 0.065 | 74.81 ± 6.1 | 74.69 ± 4.1 | 0.894 |
| DBPmax (mmHg) | 82.85 ± 5.2 | 71.8 ± 5.9 | 0.077 | 73.21 ± 7.5 | 74.11 ± 3.5 | 0.282 |
CRF Characteristics of Mazandaran and Milan University Male and Female Students (Mean ± SD)
Also, among the body composition and PA factors, only differences between WHtR in males (P < 0.05) and WHR and body fat percentage in females (P < 0.05) were significant (Table 3).
| Variable | Male | Female | ||||
|---|---|---|---|---|---|---|
| Mazandaran (N = 20) | Milan (N = 25) | P Valuea | Mazandaran (N = 25) | Milan (N = 17) | P Valuea | |
| Anthropometrics | ||||||
| BMI (kg/m2) | 23.6 ± 3.3 | 22.9 ± 2.2 | 0.41 | 22.5 ± 2.6 | 21.6 ± 2.1 | 0.35 |
| WHR | 0.77 ± 0.03 | 0.79 ± 0.03 | 0.342 | 0.74 ± 0.02 | 0.7 ± 0.04 | 0.048a |
| WHtR | 0.46 ± 0.03 | 0.42 ± 0.02 | 0.002a | 0.42 ± 0.02 | 0.39 ± 0.02 | 0.32 |
| ABSI | 0.074 ± 0.003 | 0.073 ± 0.004 | 0.243 | 0.067 ± 0.002 | 0.066 ± 0.003 | 0.283 |
| BAI | 23.27 ± 2.5 | 22.54 ± 2.3 | 0.401 | 27.75 ± 2.6 | 25.89 ± 2.2 | 0.348 |
| Body fat % | 13.97 ± 4.8 | 12.03 ± 4.7 | 0.062 | 23.39 ± 3.03 | 18.72 ± 4.2 | 0.006a |
| PA | ||||||
| Step counts (n/day) | 8160 ± 1995 | 8391 ± 1845 | 0.681 | 8103 ± 1990 | 7989 ± 1623 | 0.623 |
| Vigorous PA (MET-min/week) | 2365 ± 1009 | 1750 ± 1697 | 0.2 | 2546 ± 1700 | 1653 ± 1284 | 0.123 |
Body composition and Physical Activity Characteristics of Mazandaran and Milan University Male and Female Students (Mean ± SD)
The relationships between VO2max and RPPrest, RHR, and HRR were significant in all the groups (P < 0.05) (Table 4).
| Variable | VO2max (ml/kg/min) | |||
|---|---|---|---|---|
| Mazandaran | Milan | |||
| Male | Female | Male | Female | |
| RPPmax (mmHg bpm) | -0.118 | -0.138 | -0.366 | -0.188 |
| RPPrest (mmHg bpm) | -0.575a | -0.645a | -0.451 a | -0.61a |
| RPPrec (mmHg bpm) | -0.181 | -0.129 | -0.354 | -0.325 |
| HRmax (bpm) | -0.121 | -0.001 | -0.009 | -0.095 |
| RHR (bpm) | -0.643a | -0.74a | -0.458a | -0.803a |
| HRR (s) | 0.68a | 0.617a | 0.468a | 0.549a |
| SBPmax (mmHg) | -0.037 | -0.139 | -0.198 | -0.374 |
| SBPrest (mmHg) | -0.097 | -0.064 | -0.287 | -0.045 |
| SBPrec (mmHg) | -0.176 | -0.239 | -0.249 | -0.323 |
Correlational Analyses Between VO2max and CRF Factors of Mazandaran and Milan University Male and Female Students
Also, the relationships between VO2max and vigorous PA and step counts were significant in all the groups (P < 0.05) (Table 5).
| Variable | VO2max (ml/kg/min) | |||
|---|---|---|---|---|
| Mazandaran | Milan | |||
| Male | Female | Male | Female | |
| Body composition | ||||
| BMI (kg/m2) | -0.343 | -0.153 | -0.485a | -0.346 |
| WHR | -0.249 | -0.382 | -0.234 | -0.631a |
| WHtR | -0.51a | -0.238 | -0.304 | -0.154 |
| ABSI | -0.174 | -0.278 | -0.342 | -0.421a |
| BAI | -0.282 | -0.151 | -0.356 | -0.353 |
| Body fat % | -0.322 | -0.395 | -0.137 | -0.224 |
| PA | ||||
| Steps count (n/day) | 0.663a | 0.714a | 0.543a | 0.518a |
| Vigorous PA (MET-min/week) | 0.658a | 0.574a | 0.504a | 0.69a |
Correlational Analyses Between VO2max and Body Composition and PA Factors of Mazandaran and Milan University Male and Female Students
The relationships of VO2max with WHtR in Mazandaran male students, VO2max with BMI in Milan male students, and VO2max with ABSI and WHR in Milan female students were significant (P < 0.05) (Table 5).
5. Discussion
In the present study, we compared CRF, anthropometric parameters, and PA between Iranian and Italian male and female exercise science students. Also, the correlation between VO2max and these factors was evaluated.
As shown in Table 2, Iranian males had significantly higher SBPrest than Italian males. The relationship between the geographic area and SBPrest in developing countries may be a result of emerging new risk factors for hypertension such as nutrition and psychosocial stress (14). Kramer et al. investigated the association of race and social factors with BP among Spanish and Chinese people. They showed the effect of social factors, such as diet and socioeconomic factors, including education level and economic status on BP (19).
Based on the results of the present study, Italian males had significantly higher SBPmax and RPPmax than Iranian males (Table 2). Physical activity and stress response of the body, through elevating sympathetic activity, reducing parasympathetic activity, and increasing HR and SBP, can lead to increased RPP (3).
Also, there were significant differences in WHtR between Iranian and Italian males and significant differences in BF% and WHR between Iranian and Italian females (Table 3). In general, differences in anthropometric measures among ethnic groups or geographic regions may reflect differences in various aspects of lifestyle and culture, as well as genetic background (20). Lahmann et al. showed significant differences in BMI and WHR between Germans and Swedes in both genders. They showed that differences in lifestyle characteristics, such as smoking, diet, and alcohol consumption, play an important role in the etiology of obesity (20).
The results of this study also showed significant positive relationships between VO2max and step counts and vigorous PA in all groups (Table 5). That is in agreement with the studies by Schember and Riebe (16) and Lubans et al. (8). Lubans et al. examined the relationship between step counts and VO2max in male and female school students. Based on their results, participants with high fitness levels accumulated more steps per day (8). Schember et al. used an IPAQ outcome, vigorous-intensity PA, for predicting CRF as a non-exercise predictor in healthy college-aged males and females. The findings from their study revealed a significant relationship between VO2max and vigorous PA, among other IPAQ outcomes (16).
According to results in Table 5, there were significant inverse relationships between VO2max and BMI (in Italian males), WHR and ABSI (in Italian females), and WHtR (in Iranian males). People with less CRF are more likely to be overweight or obese than those with high CRF (20). There are many anthropometric measures for assessing adiposity, each presenting limitations (21). Various anthropometric measures and their relationship with CRF for surrogate overall adiposity have been studied (17). The results in Krakauer et al. study showed that ABSI is a more reliable indicator than BMI and WC for the prediction of cardiovascular status in Mexican and black males (18) while He and Chen showed that WC is more suitable than ABSI for diabetes mellitus prediction in Chinese males (22).
Moreover, RPP is useful in determining CRF not only at rest but also under different conditions (4). In the present study, the relationships between VO2max and RPPrest, RHR, and HRR were significant (Table 4). This result is in line with Sembulingam et al. study. They found a significant relationship between RPPrest and VO2max in both genders. Low RPPrest is an indicator of increased parasympathetic tone, which effects RHR and improves CRF (3). Lower RHR is indicative of the favorable influence on the autonomic nervous system, tilting the balance toward augmented vagal tone as opposed to sympathetic tone, so it reduces shear stress, decreases adverse ventricular remodeling, and prevents imbalance of myocardial oxygen supply and demand, leading to a favorable impact on CRF (23).
Daanen et al. showed a relationship between HRR and VO2max in both genders. They observed that students with faster HRR had higher VO2max (4). The findings suggest that the anatomical and physiological factors affecting RHR may also be important contributors to the HRR pattern (4). Furthermore, some factors, such as age, PA, lifestyle, and cardiac vagal activity, which affect VO2max, are also associated with HRR (20). Freeman et al. reported changes in the autonomic nervous system modulation and central hemodynamics such as RHR, and similarly, increased HRR (24).
5.1. Conclusions
According to the results of this study, VO2max as an assessment measure of CRF was associated with hemodynamics and health risk factors. The results showed that hemodynamic responses and health risk factors were different between sport science students from Iran and Italy. These differences may depend on age, sex, ethnicity, lifestyle, and culture of people in each region.
