


1. Background
Obesity is one of the most serious challenges in the health system, especially in developing countries (1). Childhood obesity increases the chance of developing non-communicable diseases in adulthood, such as stroke, diabetes, heart disease (2). Studies have shown that about 170 million people under the age of 18 years suffer from physical and psychological complications of obesity (1).
On the other hand, the growth of children is a sign of the health condition and reflects the quality of health services, nutrition, and economic status of the region (3). Today, health workers use indicators such as height and weight to assess children's physical development and health since the measurement of these indicators is simple (4). Indicators of growth in the child are representing the physical development of the child and the healthcare service is provided to the child and the family based on it (5).
One of the best investments for economic and social development is the control and protection of children's physical health. It should be noted that the population of Iran is mostly young and the growth process in this age group is important. Several studies have been done on the anthropometric indices and their standard rates such as the studies conducted by the World Health Organization (WHO) from 1997 to 2003 (6).
Various studies have been conducted in Iran on the height and weight of children, but American-English growth standards have been used to monitor the child's growth in those studies. The health workers may make a mistake in diagnosing the children with abnormal growth if they use external growth indicators for Iranian children (4).
Recent surveys show that the pattern of growth changes over time. On the other hand, curves and charts that exist based on Western information cannot be considered valid for all countries because cultural, social, economic, and genetic statuses affect children's development. The reference levels of growth for children in each country are essential especially for developing countries (4). Ayatollahi and Mostajabi conducted a comparative study of reference data for body mass index (BMI) of school children in Shiraz (southern Iran) and CDC standards. They showed BMI curves in both sexes were different from CDC standards, and the BMI of school children in Shiraz became higher than 10 years ago (7). Mozaffari-Khosravi et al. conducted a study for Standardizing the height, weight, and BMI in healthy 6-11-year-old school girls and boys in Yazd City (2010 - 2011) and compared with the WHO and CDC standards. They showed that 95 and 97 percentiles of BMI of boys and girls aged over 10 years were higher than foreign standards (8).
As a result, we cannot use a global standard as a template for comparing the height and weight of Iranian children with diverse epidemiological and demographic characteristics. In this study, the researchers determined standards for BMI of Iranian children aged 6 - 11 years by finding percentiles of height and weight to compare the Iranian children according to these cut-off points. The comparison of the growth of the Iranian child with the non-Iranian child's index does not usually lead to a correct judgment.
2. Objectives
The aim of this study was to determine cut-offs of BMI in Iranian children aged 6 - 11 years and compare them with the National Center for Health Statistics (NCHS) standard.
3. Methods
3.1. Study Design and Population
This study was a cross-sectional study. The target population was students aged 6 - 11 years. The sample size was determined to be 360 students in each age group based on a confidence interval (CI) of 95% and a standard deviation of 3 (Related to height) and error estimation of the mean of 0.31. So, considering the 6 age groups (6 - 11 years) in girls 'and boys' schools, a total of 4,320 students participated in this study (2,160 girls and 2160 boys) in the academic year 2016 - 2018. Sampling was conducted based on the two-stage cluster sample method in girls 'and boys' schools. Initially, the list of elementary schools in Yazd (nonprofit and government) was provided through Yazd Education Organization. In the first phase of sampling, 24 elementary schools (12 girls and 12 boys at primary school) were selected, randomly. In the second phase, a class (a cluster) was randomly selected from each base in each school (6-year-old children were selected from preschool, 7-year-old from first grade, 8-year-old from second-grade, 9-year-old from third-grade, 10-year-old from fourth-grade, and 11-year-old from fifth grade). Then, 30 students from each class were randomly selected. If the number of students in a class was less than 30, all students were enrolled. The inclusion criteria in this study included having parents born in Yazd, the lack of acute illness within a month, and the lack of chronic illness (Cardiovascular disease, diabetes, kidney disease, and thyroid disease).
3.2. Study Procedure
The researcher after receiving the introduction letter from the Yazd Education Organization referred to the elementary schools selected. The height of every student without a shoe and in standing position was measured with a height meter attached to the wall with a precision of 0.1 cm. The students' height was measured twice by a nutrition expert. If the difference between the two heights measured for each person was more than 0.3 cm, the height was re-measured. The weight of every student with a minimum of wear was measured by a digital scale and with a precision of 0.1 kg. Moreover, BMI was calculated with this formula: weight in kilograms divided by height in meters squared. The student's birthday was also obtained from their school records. Then the age was calculated by the month. In the next step, data analysis was done using LMSchartmaker Pro software 2.3. For a closer examination, each of the indicators was evaluated separately by sex and compared to the NCHS standards.
3.3. The WHO Standards/References
The WHO standards were based on data collected through the WHO Multicenter Growth Reference study based on six population-based studies conducted in Brazil, Ghana, India, Norway, Oman, and the United States between 1997 and 2003. The study combined a longitudinal follow-up from birth to 24 months and a cross-sectional study of children aged 18 to 71 months. The WHO growth references were developed using the original sample as that used for the construction of the original NCHS charts for weight of children aged 5 – 10 years, and for height, and BMI for children aged 5 - 19 years (6). A complete set of tables, graphs and charts is visible on the WHO's website (available online: www.who.int/childgrowth/en).
3.4. Statistical Analysis
The data were analyzed using LMSchartmaker Pro software 2.3. The LMS method is a general method for fitting the percentile growth curves. This method describes the distribution of variations by three parameters: the middle (M), the coefficient of variation (S), and the cox box power to eliminate skewness of data regular monitoring of height, weight, and BMI is the best indicator for assessing the individual's health and well-being. Therefore, BMI was calculated for 3rd, 10th, 25th, 50th, 75th, 90th, and 97th percentiles for each age group.
3.5. Ethical considerations
Researchers before completing the questionnaire, explained the aim of the study to the participants. Participation in the study was also voluntary. This study was approved by the Research Ethics Committees of Shahid Sadoughi University of Medical Sciences, code IR.SSU.SPH.REC.1395.112.
4. Results
This study was to determine of cut-offs of BMI in Iranian children aged 6 - 11 years and compare them with the NCHS standards. Overall, 4,320 students entered this study. The results showed percentiles had a normal ascending trend in every age for both sexes, and this ascending trend was slow. The BMI in the 90th and 97th percentiles have a lot of transformation for girls aged 6 years to 7 years, but this amount was reduced in the 3rd percentile for this age group. The BMI in the 97th percentile had a mutation for girls aged 9 years to 10 years. Therefore, 3% of girls aged 10 and 11 years had overweight. The BMI for boys aged 9 years to 10 years had a lot of mutations in the 97th percentile; also, BMI for boys in the 90th and 97th percentiles had a mutation. According to Table 1, the mean BMI in girls and boys increased with increasing age at 97th percentile and was higher than the NCHS standard. The mean BMI in girls and boys, in most age groups, was approximately equal or less than NCHS standards in the 3rd and 25th percentiles.
| Age Group | P3 | P25 | P50 | P75 | P97 | |||||
|---|---|---|---|---|---|---|---|---|---|---|
| Yazd | NCHS | Yazd | NCHS | Yazd | NCHS | Yazd | NCHS | Yazd | NCHS | |
| Girls | ||||||||||
| 6 | 12.52 | 12.8 | 13.99 | 14.3 | 15 | 15.3 | 16.31 | 16.4 | 20.94 | 18.9 |
| 7 | 12.25 | 12.9 | 14.02 | 14.4 | 15.26 | 15.4 | 16.91 | 16.6 | 23.06 | 19.4 |
| 8 | 12.25 | 13 | 14.33 | 14.6 | 15.8 | 15.7 | 17.77 | 17 | 25.01 | 20.2 |
| 9 | 12.31 | 13.3 | 14.72 | 14.9 | 16.41 | 16.1 | 18.65 | 17.5 | 26.59 | 21.1 |
| 10 | 12.3 | 13.6 | 15.04 | 15.4 | 16.96 | 16.6 | 19.47 | 18.2 | 27.86 | 22.1 |
| 11 | 12.42 | 14 | 15.59 | 15.9 | 17.77 | 17.2 | 20.57 | 18.9 | 29.39 | 32.2 |
| Boys | ||||||||||
| 6 | 12.63 | 13.2 | 14.07 | 14.5 | 15.06 | 15.3 | 16.35 | 16.3 | 21.08 | 18.3 |
| 7 | 12.66 | 13.3 | 14.24 | 14.6 | 15.35 | 15.5 | 16.84 | 16.5 | 22.58 | 18.8 |
| 8 | 12.67 | 13.4 | 14.43 | 14.8 | 15.69 | 15.7 | 17.39 | 16.8 | 24.15 | 19.4 |
| 9 | 12.8 | 13.6 | 14.81 | 15.1 | 16.26 | 16 | 18.23 | 17.2 | 26.2 | 20.1 |
| 10 | 12.96 | 13.9 | 15.3 | 15.4 | 16.99 | 16.4 | 19.33 | 17.7 | 28.82 | 21 |
| 11 | 13.02 | 14.2 | 15.74 | 15.8 | 17.72 | 16.9 | 20.45 | 18.4 | 31.35 | 22 |
Figure 1 shows the BMI percentiles for girls aged 6 - 11 years obtained by the LMS method. As shown in Figure 1, the marginal lack of relative variance brought the percentile curve of 3rd, 10th, and 25th close together. According to Figure 1, the distance between curves from the 50th percentile to the top increases so that the maximum distance of the curves was related to the percentile of 90th to 97th. Also, an upward trend was observed in the 97th percentile at the age of 6 to 9 years. This upward trend was slower from the age of 9 to 11 years. According to the 97th percentile curve, the highest BMI was in girls aged 10 and 11 years.

BMI percentiles are given by LMS Method in girls.
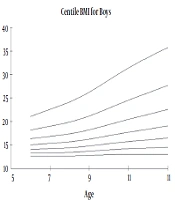
Figure 2 shows the BMI percentiles obtained by the LMS method in 6 - 11 years old boys in Yazd. As shown in Figure 2, the marginal lack of relative variance brought the percentile curve of 3rd, 10th, and 25th close together. The distance between curves from the 50th percentile to the top increases so that the maximum distance of the curves was related to the percentile of 90th to 97th. As seen in Figure 2, an upward trend was observed in all percentiles. This growth trend was higher at the age of 9 - 11years, especially at the 97th percentile.

BMI percentiles are given by LMS Method in boys.
According to Table 2, the weight of boys was close to the NCHS standards at all percentiles except for the 97th percentile. The weight of schoolboys in Yazd was higher than the NCHS standards in the 97th percentile. The mean weight in schoolgirls in most age groups was higher than the NCHS in the 75th and 97th percentiles. Also, the mean weight in school girls in most percentiles at the age of 8 - 9 years was higher than the NCHS standards.
| Age Group | P3 | P25 | P50 | P75 | P97 | |||||
|---|---|---|---|---|---|---|---|---|---|---|
| Yazd | NCHS | Yazd | NCHS | Yazd | NCHS | Yazd | NCHS | Yazd | NCHS | |
| Girls | ||||||||||
| 6 | 15.3 | 15.5 | 17.87 | 18.3 | 19.91 | 20.2 | 22.66 | 22.6 | 33.1 | 27.3 |
| 7 | 16.29 | 17 | 19.84 | 20.2 | 22.42 | 22.4 | 25.94 | 24.9 | 39.46 | 30.8 |
| 8 | 17.98 | 18.9 | 22.42 | 22.5 | 25.65 | 25 | 30.05 | 28 | 46.46 | 34.9 |
| 9 | 19.61 | 21.1 | 25.1 | 25.3 | 29.05 | 28.2 | 34.33 | 31.7 | 52.74 | 40 |
| 10 | 21.19 | 23.7 | 28 | 28.5 | 32.8 | 31.9 | 39.04 | 35.9 | 58.88 | 45.7 |
| 11 | 22.64 | 31.38 | 37.28 | 44.59 | 65.24 | |||||
| Boys | ||||||||||
| 6 | 16.1 | 16.1 | 18.4 | 18.8 | 20.3 | 20.5 | 22.4 | 22.5 | 32.59 | 26.7 |
| 7 | 17.1 | 17.9 | 20.9 | 20.9 | 23 | 22.9 | 25.5 | 25.2 | 38.59 | 30.1 |
| 8 | 19.39 | 19.8 | 23.1 | 23.1 | 25.6 | 25.4 | 29.05 | 28.1 | 42.37 | 34 |
| 9 | 22.15 | 21.6 | 25.58 | 25.4 | 28.35 | 28.1 | 33.03 | 31.3 | 46.6 | 38.6 |
| 10 | 23.63 | 23.6 | 28.55 | 28 | 32.5 | 31.2 | 39.88 | 34.9 | 63.96 | 43.9 |
| 11 | 25.22 | 31.3 | 34.95 | 42.88 | 69.03 | |||||
According to Table 3, the mean height in girls and boys increased with increasing age at the 97th percentile and was higher than the NCHS standards. The mean height in girls at age 8 years was higher than the NCHS standards in all percentiles. The mean height in boys at age 8 - 11 years was higher than the NCHS standards in all percentiles.
| Age group | P3 | P25 | P50 | P75 | P97 | |||||
|---|---|---|---|---|---|---|---|---|---|---|
| Yazd | NCHS | Yazd | NCHS | Yazd | NCHS | Yazd | NCHS | Yazd | NCHS | |
| Girls | ||||||||||
| 6 | 104.39 | 105.5 | 111.47 | 111.7 | 115.47 | 115.1 | 119.85 | 118.6 | 129.94 | 124.5 |
| 7 | 109.55 | 110.5 | 117.21 | 117.1 | 121.41 | 120.8 | 125.87 | 126.5 | 135.74 | 131.1 |
| 8 | 115.04 | 115.7 | 123.21 | 122.6 | 127.58 | 126.6 | 132.16 | 130.5 | 141.99 | 135.5 |
| 9 | 119.76 | 121 | 128.63 | 128.4 | 133.21 | 132.5 | 137.89 | 136.6 | 147.56 | 144 |
| 10 | 124.2 | 126.6 | 134.1 | 134.3 | 139.01 | 138.6 | 143.88 | 143 | 153.53 | 150.7 |
| 11 | 127.71 | 132.5 | 139.28 | 140.5 | 144.65 | 145 | 149.78 | 149.5 | 159.46 | 157.5 |
| Boys | ||||||||||
| 6 | 107.03 | 106.7 | 114.16 | 112.6 | 117.9 | 116 | 121.76 | 119.3 | 129.87 | 125.2 |
| 7 | 111.58 | 111.8 | 118.98 | 118.2 | 122.77 | 121.7 | 126.62 | 125.3 | 134.5 | 131.7 |
| 8 | 116.68 | 116.6 | 124.17 | 123.5 | 128.03 | 128.3 | 131.96 | 131.1 | 140.04 | 137.9 |
| 9 | 121.9 | 121.3 | 129.4 | 128.5 | 133.39 | 132.6 | 137.53 | 136.6 | 146.35 | 143.9 |
| 10 | 127.27 | 125.8 | 134.87 | 133.5 | 139.06 | 137.8 | 143.54 | 142.1 | 153.51 | 149.8 |
| 11 | 132.18 | 130.5 | 140.06 | 138.6 | 144.49 | 143.1 | 149.31 | 147.7 | 160.38 | 155.8 |
5. Discussion
Measurement of physical indicators in the assessment of child health and its comparison with well-known standard indicators in the world is very important. If these evaluations are carried out continuously and periodically, it can be a good index for monitoring child growth. Growth monitoring plays a significant role in the planning and management of food in the community. The most common method for monitoring children's growth is to measure anthropometric indices.
The researchers calculate the anthropometric indices by measuring weight, height, and BMI and comparing them with the global standard. World standards have been developed for healthy children and countries that do not have acceptable standards can use these standards to find out how children grow (9). However, we cannot apply a universal standard as a model for determining the height and weight of Iranian children with a variety of epidemiological and demographic characteristics.
In this study, 4320 students 6 - 11 years old were selected from 26 schools in Yazd; and their height, weights were measured and then BMI was calculated. Finally, growth percentiles were calculated for all age and gender groups and were compared with the WHO growth charts. This study showed that the growth pattern of girls and boys in Yazd was different from the WHO growth patterns.
The results showed that height, weight, and BMI percentiles in both gender were close to NCHS standardss in all ages, but some percentiles were higher in children in Yazd than NCHS standardsNCHS standardss. It can be said the 50 to 97 percentiles of BMI of boys and girls aged over 10 years were higher than NCHS standardss, which is consistent with the results of Mozafari et al. study (8). Asadi showed that the prevalence of overweight in children between 10 - 11 years was higher than in children less than 10 years (10). Also, in the study of Habibi et al., the highest rates of obesity and overweight were in the 11 and 10 year olds, respectively (11). It seems the mobility of children is less than before when they arrive at the ages of 10 - 11 years. Moreover, children are more likely to watch television and computer games at these ages, and business school gives less time for them to exercise.
Nazarova and Kuzmichev showed that BMI z-scores calculated under the WHO were less than 0.25 and were positive or close to zero, but BMI z-scores calculated using USCDC2000 were mostly negative but did not descent below "-0.3". They showed the standard of WHO (2006) would be proper for the growth assessment of preschool children of Russian (12). Gleiss et al. indicated that the WHO percentile curves were not proper after the age of 5 years for Austrian children (13).
In the present study, most percentiles are close to or greater than NCHS standards. While in some studies conducted in Iran, percentiles were less than the NCHS standards. This may be due to the prevalence of obesity among students in Yazd. Some studies carried out in other regions of Iran showed that growth indices in Iranian children were lower in comparison to global standards and the need to create specific growth curves for Iranian children. The results of Ayatollahi and Mostajabi study showed that BMI curves in both sexes were different relative to CDC Standards and the BMI of school children in Shiraz was higher than 10 years ago (7). In Nemati et al. study showed that all percentiles of height, weight, and BMI were lower than NCHS standards (14). Taheri et al., in a study in Birjand, showed that the BMI of children aged 7 - 12 years old was different and much lower than CDC standards (15). In two separate studies, height, weight, and BMI of 7 - 12 years old children were compared with the CDC standard in Birjand in 2000 and 2004. In both studies, height, weight, and BMI in children were different and much lower than CDC standards (16).
In Safari et al. study in Qazvin, the mean height of girls aged 6 - 14 years was lower than the standard, and their mean weight was similar or slightly higher than the standard. Their study showed that the growth pattern of girls in Qazvin was different from CDC standards (17). The results showed that BMI percentiles in our study were higher than BMI percentiles in Mozaffari et al. (2010 - 2011) and Ayatollahi and Mostajabi study (2002 - 2003) (7, 8). Iran is a large country with different provinces in terms of lifestyle and socio-economic status. Furthermore, dietary habits, physical activity, and weather conditions of each province affect children's health. Yazd province is one of the desert regions of Iran with a warm and dry climate and low green space. For this reason, children are mostly at home and have little physical activity. It seems reasonable that BMI and their weight percentiles are higher than the standards. Also, over time, people's lifestyles tend to be sedentary and obese.
The results of studies carried out in neighboring countries also showed the difference in the anthropometric indices of these countries with reference curves. Mushtaq et al. showed that overweight and obesity in Pakistani school-aged children were significantly higher than WHO growth standards/references (18). Li et al. in their study showed that the height and weight of the Taiwanese children of both sexes were less than the WHO growth standards/references (6). Marwaha et al. indicated that the height of Indian schoolchildren of both sexes was 2 - 4 cm lower than that reported in the WHO multicenter study (2007). Centiles of weight in their study showed a growing trend in weight of boys and girls compared to the WHO multicenter report (19).
Zong and Li showed that BMI for Chinese boys was generally higher than the WHO standards (20). Juliusson et al. showed height and weight for Norwegian children were similar to previous Norwegian references (21). In Gatradet al. study preschool weights and heights of Europeans compared with five subgroups of Asians in Britain (Muslim Gujarati, Muslim Pakistani, Muslim Bangladeshi, Hindu, and Sikh). They showed that although the Europeans were significantly the heaviest at birth when compared with any of the other groups, it was the Sikhs who had the best weight and height than other subgroups (22). Kulaga et al. showed Polish preschool children had a significantly greater than zero mean Z scores of BMI-for-age compared with the WHO standards (23) In general, considering the differences between height, weight and BMI in children in Yazd in comparison to the NCHS standards, it is recommended to use the indices of this study. One of the limitations of the present study is that there are few new studies was conducted to determine the cut-offs of BMI and most researchers have relied on the same old reference to compare the growth of children. Therefore, the researchers could not compare the results of this study with new studies.
In conclusion, in this study, the researchers determined the percentiles for the BMI in children aged 7-11 years; so researchers can have standards to compare the growth of Iranian children with these cut-off points. These standards are more capable than non-Iranian standards. Given the differences in the gene and biological pattern of people in different countries, it is preferable to use native or national standards rather than non-native standards.
