1. Background
Manganese (Mn) is one of the essential elements required for health. According to FDA (food and drug administration) the daily withdrawal amount of manganese is about 2.3 mg and 1, 8 mg for men and women respectively [1]. Mn exists in the most of the body tissues and not only acts as a cofactor for some enzymes like arginase, phosphoglucomutase, pyruvate carboxylase and most of phosphatases and peptidases but also participates in prothrombin synthesis.
Human body controls concentration of Mn in blood. Although liver filtrate blood Mn, excrete in bile and finally repelled by feces, if high amounts of Mn inhaled, the body may not be able to regulate it and therefore blood Mn concentration increase. Occupational exposure to Mn occurs among workers involved in welding, mining, smelting, ferroalloy steel production and dry-cell battery production [2, 3]. Symptoms of poisoning with Mn usually appears during many months or years [4]. Mn in high concentrations has pathological effects, especially its accumulation in central nervous system cause condition that is called manganism [5]. Manganism cause different nervous damages with Parkinson like symptoms such as tremor, imbalance and muscular spasm [4, 6]. In addition it is revealed high Mn concentration in blood has influences on other organs such as liver [7].
Early diagnosis in Mn poisoning especially in high levels exposure is important because stopping contact after damages incidence, will prevent development of the pathologic effects [2, 8]. In some studies many preclinical but in others no symptoms have been observed in populations who have exposure to Mn [9].
Mn and iron (Fe) both are divalent positive ions and have antagonist effects especially on central nervous system. They compete in passing through blood-brain barrier and penetrating into the brain [5]. Mn is transferred to target cells via different blood proteins especially transferrin (Tf). Its binding to Tf disturb Fe metabolism [10, 11]. It is shown in domestic animals; Mn leads to iron deficiency [12]. Smith was showed correlation between blood manganese and iron deficiency [13]. In many studies, strong relationship between blood Mn and Fe level were observed [14].
As a result, this study was done to investigate chronic exposure to Mn and its effect on indices related to blood Fe in miners of a Manganese mine.
2. Methods
2.1. Sample Gathering
This research was done at Iran manganese mines-Qom located in 20 kilometers far from Qom. In this cross-sectional study, fifty six miners were chosen randomly by filling questionnaire and testimonial form. Five more people participated in this study as control group from people of Qom. All miners were men and they have informed about aims of present research. Also moral committee of our university assessed this study.
2.2. Measuring Blood, Urine and Saliva Manganese Concentration
Samples were taken from miners before beginning of daily work. Mn concentration determined in samples based on Razavian method using a Varian graphite furnace-atomic absorption spectroscopy and results were reported in µg/L [7].
2.3. Measuring Items Related to Blood Iron and Counting Blood Cells
CBC parameters were analyzed by using autoanalyzer system. Total iron binding capacity (TIBC) and serum Fe concentration measured chemically by Darman Kave kits. Tf assayed using Abcam’s Tf Human in vitro ELISA (Enzyme-Linked Immunosorbent Assay) kit.
2.4. Statistical Analysi
Data processing was investigated using statistical software SPSS 16.
3. Results
3.1. Demographic and Descriptive Data
Range and average of miner’s age and experience were 29 - 66 and 40.53 and 5 - 21 and 14.79 years respectively (Table 1). 28.6% (16 persons) of miners were native and live in a village near the mine and others (71.4%) (40 persons) were non-native and transported to the mine daily. Mn concentration in different obtained samples were determined by atomic absorption and summarized in Table 1. By comparing serum, urine and saliva Mn concentrations in miners were about 7, 8 and 14-fold higher than those in controls respectively (P < 0.05). Plotting of Mn levels in different samples as a function of years of experience showed Mn concentrations have a tendency to increase as miner experience advanced (P < 0.005).
| Variables | Miners (N = 56) | Controls (N = 5) | P Value | |
|---|---|---|---|---|
| Age, y | (Mean ± SD) | 40.53 ± 6.5 | 37.56 ± 3.43 | - |
| Min - Max | 29 - 66 | 33 - 45 | ||
| Experience, y | (Mean ± SD) | 14.8 ± 3.45 | 0 | - |
| Min - Max | 5 - 21 | 0 | ||
| Mn Concentration, µg/L | ||||
| Serum | (Mean ± SD) | 307.66 ± 227.4 | 42.75 ± 2.95 | 0.04 |
| Min - Max | 95.34 - 1580.3 | 40.02 - 45.88 | ||
| Urine | (Mean ± SD) | 65.36 ± 15.36 | 7.92 ± 6.86 | 0.04 |
| Min - Max | 20.72 - 88.6 | 2.35 - 15.59 | ||
| Saliva | (Mean ± SD) | 46.13 ± 7.94 | 3.43 ± 1.35 | 0.04 |
| Min - Max | 30.05 - 79.79 | 2.01 - 4.71 | ||
3.2. Items Related to Blood Iron and Counting Blood Cells
Blood Fe, Tf and ferritin in addition to Tf saturation percent, TIBC and CBC parameters in miners and controls are summarized in Table 2.
| Index | Units | Miners, (Average ± SD) Range | Controls, (Average ± SD) Range | Change, % | P Value |
|---|---|---|---|---|---|
| MCH | Pg/dL | 28.42 ± 2.96 | 29.73 ± 0.35 | -4.61 | 0.487 |
| 18.9 - 34.1 | 29.4 - 30.1 | ||||
| MCHC | g/dL | 32.77 ± 1.22 | 33.5 ± 0.17 | -2.23 | 0.261 |
| 29.6 - 34.9 | 33.4 - 33.7 | ||||
| MCV | Fl | 86.59 ± 7.14 | 90.37 ± 1.92 | -4.36 | 0.153 |
| 64 - 99.6 | 88.3 - 92.1 | ||||
| HCT | % | 46.43 ± 4.41 | 44.5 ± 0.1 | +9.12 | 0.326 |
| 32.2 - 54 | 44.4 - 44.6 | ||||
| Hb | g/dL | 15.22 ± 1.58 | 16 ± 0.62 | +5.12 | 0.297 |
| 10 – 17 | 15.3 – 16.5 | ||||
| Blood cells count | |||||
| RBC | 106 cell/µL | 5.41 ± 0.64 | 5.03 ± 0.21 | +7.02 | 0.270 |
| 4.18 – 7.76 | 4.8 – 5.2 | ||||
| WBC | 109 cell/L | 7.29 ± 1.83 | 6.2 ± 0.95 | +14.5 | 0.244 |
| 5.1 - 13.1 | 5.2 - 7.1 | ||||
| PLT | 109cell/L | 223.3 ± 55.62 | 255.33 ± 8.5 | -14.3 | 0.171 |
| 145 - 317 | 247 - 264 | ||||
| Serum Fe | µg/dL | 183.23 ± 45.39 | 126.33 ± 4.16 | +45.4 | 0.009 |
| 136 - 391 | 123 - 131 | ||||
| Ferritin | mg/mL | 198.3 ± 109.4 | 178.34 ± 98.53 | +11.2 | 0.457 |
| 115.4 - 239.6 | 103.4 - 264.3 | ||||
| TIBC | µg/dL | 373 ± 21.98 | 348.67 ± 6.51 | +6.97 | 0.052 |
| 324 - 420 | 342 - 355 | ||||
| Transferrin | mg/mL | 1.82 ± 0.6 | 1.39 ± 0.65 | +30.9 | 0.160 |
| 1.45 - 2.9 | 1.2 - 2.43 | ||||
| Blood Transferrin Saturation | % | 29.58 ± 10.61 | 35.3 ± 2.11 | -19.3 | 0.317 |
| 8.6 - 50.5 | 33.1 - 37.3 |
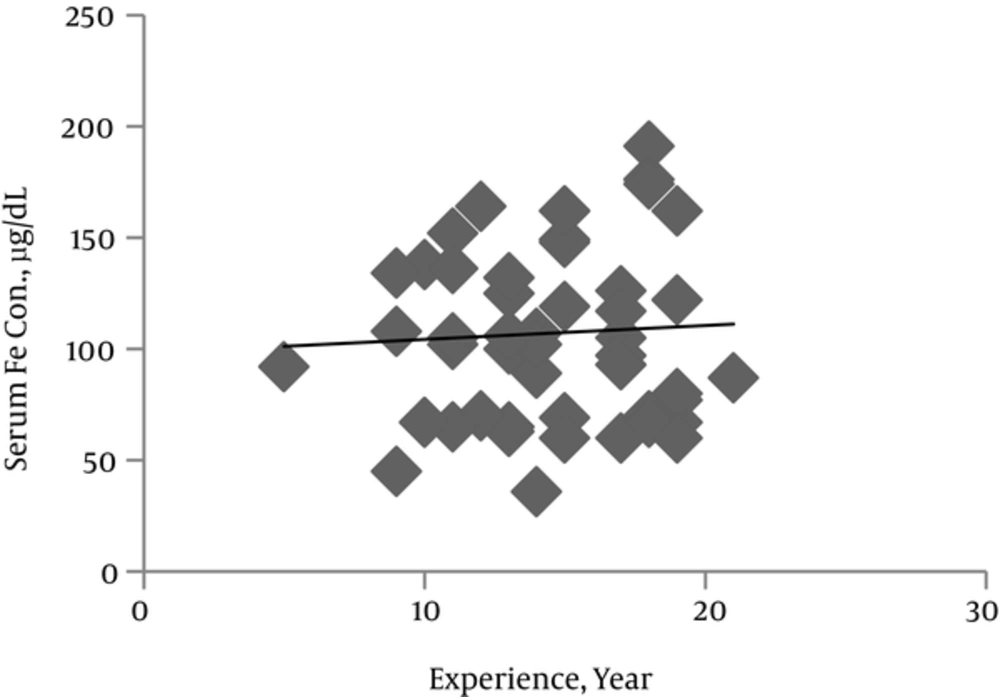
The mean serum Fe concentration was about 1.5-fold higher in miners than in controls (P < 0.01) (Table 2). Linear regression analysis revealed a significant miner’s experience year associated increase in serum Fe concentration (Figure 1). Plotting serum Fe against Mn concentrations showed no correlation between these two metals and suggested that variations in serum Fe and Mn appear to be independent.
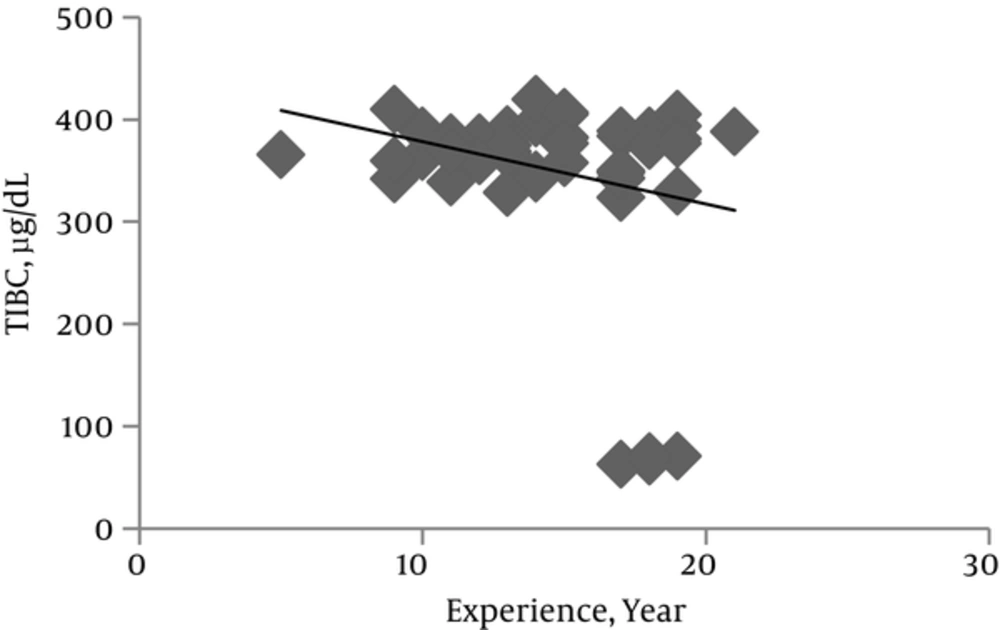
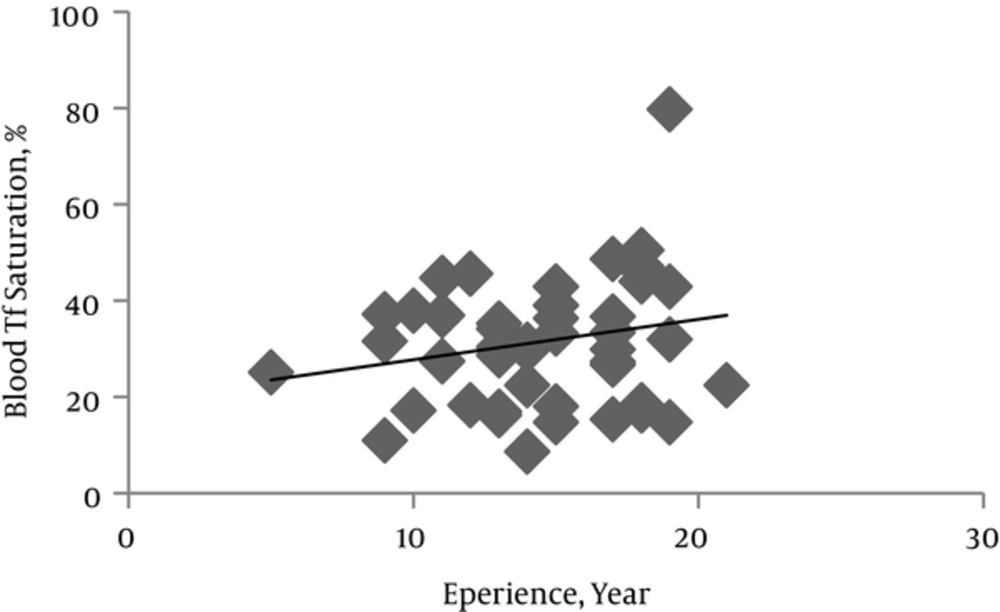
Levels of serum ferritin, Tf and its saturation percent and TIBC are involved in Fe homeostasis and were assessed to investigate the possible detrimental effect of Mn exposure on systemic Fe metabolism. In comparison to control subjects, the miners showed approximately 11%, 8% and 20% increases in serum ferritin (P = 0.457), TIBC (P = 0.052) and Tf (P = 0.016) respectively (Table 2).
Serum Tf level in miners increased significantly as years of miners experience increased (P = 0.016). While it was not meaningful, serum ferritin level and TIBC showed a tendency to increase and decrease respectively as the mining period increased (Figures 2 and 3). CBC indices related to blood Fe including HCT, Hb, MCV, MCHC and MCH indeed blood cells count in both miners and control groups did not have significant difference (Table 2).
Linear regression analysis showed correlation between TIBC and Tf (r = -0.486, P = 0.001) (indirect), Serum Fe and TIBC (r = -0.307, P = 0.034) (indirect), and serum Fe and Tf (r = -0.989, P = 0.0004) (direct).
4. Discussion
The results of this study showed that changes in blood iron indices in miners related to controls (even in cases that their blood Mn level difference to controls reached to 210 μg/L) were not significant and therefore blood Fe level can not be used as an index for Mn exposure. We think this is due to co-exposure to Fe in mine and compensatory mechanisms that not to permit suddenly high changes in blood parameters in different conditions. However, to obtain more accurate vision in this area need to further research.
Some jobs such as welding and mining lead to workers exposure to Mn. In mines, Mn presents all around of mine regions, especially in tunnels air, soil, dusts and water resources, and therefore it can enter to the miner's body from lung, skin and gastro-intestinal tract. Mn accumulation has pathological effects especially on neural system and cause a condition that is called Manganism [5]. Also high Mn concentration in blood may impair Fe homeostasis and gradually lead to Iron deficiency and then anemia.
Lander et al., 1999 showed after stopping the Mn exposure, potential problems were disappeared generally and blood Mn values in workers decreased [15]. Therefore there is a need to an index for prognosis the condition of workers. Scientists have been investigating different effects of Mn deficiency [4, 8] but biological exposure index (BEI) for Mn has not been yet defined [16]. Present study was performed to investigating of exposure effects of Mn on Fe homeostasis in Mn miners and evaluation of Fe as a indicator for Mn exposure situation.
Mn and Fe both are divalent positive ions and compete in binding to blood carrier proteins and passing through blood-brain barrier [5]. Many studies indicate that blood iron level in individuals exposed to Mn are reduced and the same results are shown in laboratory animals [1, 14]. Within the plasma, Mn is largely bound to gamma-globulin and albumin, and a small fraction of trivalent (3+) Mn is bound to the iron-carrying protein, transferring [17]. Mn binding to Tf can disturb Fe metabolism [10, 11] so it is shown that Mn leads to iron deficiency in domestic animals [12]. Smith et al., (2013) [13] was showed partially correlation between blood manganese and iron deficiency. In a study of 95 people exposed to manganese in a metal smelter (high exposure) and 106 persons in a control group (not exposed to Mn), determined iron and manganese in saliva, plasma, erythrocytes, urine and hair. With the increase of manganese concentrations in biological materials, Fe concentration in plasma and erythrocyte significantly reduced in exposed workers compared to the control group. For this reason, we suggested iron can be used as a biomarker to distinguish exposed and unexposed ones in mines.
Our results that summarized in Table 1, showed both Mn and Fe had significantly higher levels in miners serum compared to controls(P < 0.05, P < 0.01 respectively), although miners serum Mn were lower than values found by Lu et al., (2005) [16] and higher than values in the study of Bowler et al., (2011) [18]. Because of serum Mn level can reflect the total body Mn which accumulates over the years of proximity; miners with a longer experience period should have higher serum Mn concentrations. Obtained data revealed that serum Mn were significantly (P < 0.005) associated with years of experience.
Based on our results, not only serum Fe levels were significantly and 1.5-fold higher in miners than in controls (P < 0.01), but also increased Fe levels among miners were significantly influenced by the years of experience (Figure 1). Current results appear to disagree with previously data reported by studies mentioned above in addition to Logroscino et al., (1997) and Zheng et al., (1999) [19, 20]. The increased miner’s serum Fe level in a positive association with their experience years, can be related to co-exposure to Fe. In order to Braunite (Mn mineral) has a few Fe as impurity, increased serum Fe levels among miners could be attributable to it. Although it is possible that high Mn levels alter Fe balance by influence on Fe control mechanisms cannot be excluded.
On the other hand, Fe homeostasis is controlled by many proteins such as Ferritin (Fr) and Transferin (Tf). Tf carries Fe in the blood and plays role as the major vehicle for iron transport and Fr is a protein that stores Fe [16]. The Tf is abnormally high in iron deficiency anemia. According to Pesch et al., (2012) results and own, no meaningful change of Fr and Tf was observed and miners did not suffer of anemia, although miners had higher average Tf levels (30.9 %) especially in significant relation to mining experience (P = 0.016) [14]. In the studies carried out by Finley J. W., (1999) and Bowler et al., (2011), average blood Fe did not show symptoms of iron deficiency anemia [18, 21]. Increased Fe in the body results in an up regulation of Fr production, so as to counterbalance the overload of iron molecules. So higher plasma Fr levels in miners (11.2 %) is explainable [22-24].
Also Smith et al., (2013) showed strict relation between blood Mn concentration and iron deficiency anemia while the present study showed that although exposure to Mn have had effects on the factors related to blood Fe but all indices are in normal range and this relation was so weak [13].
In other study declared hematological criteria related to iron deficiency anemia includes:
Ferritin < 100 mg/mL, MCV < 80 fl, HB < 11 g/dL, MCH < 27 pg/dL, HCT < 33%, MCHC < 30 g/dL.
Similar to the results obtained by Jiang et al., 2007 [2], our results after performing statistical analysis, showed no meaningful difference in CBC indices related to anemia and iron deficiency between miners and control groups (Table 2). This can be due to body regulatory mechanisms that not allow high changes in blood iron parameters.
Should be kept in mine that various factors such as personal behaviors, social status, workers diet, habits and living place (distance to mine) may have influence on received Mn and therefore on results [16, 25].


