1. Background
Infertility is a prevalent condition that has profound social and economic impacts and affects the health of the individual and the community (1, 2) About a quarter of the Iranian couples experience primary infertility, and about 3.3% of these couples constantly face this problem.
The lowest incidence of infertility (17.2%) is seen at 21 - 26 years of age, and this rate increases with rising marriage age (3). Several factors contribute to infertility. Endometrial failure in embryonic admission is one of the causes of infertility. Uterine endometrium is a source of multiple growth factors and cytokines in many species, including humans and leukemia inhibitory factor (LIF) protein is one of these cytokines. The LIF gene has been introduced as one of the molecular markers for the evaluation of endometrial admission (4, 5). LIF is a member of the family of cytokines that often have synergic functions. Following the attachment of the blastocyst to the endometrium, the trophoblast begins to express LIF protein, which may have an autocrine effect on the physiological properties of the blastocyst. In humans, LIF is produced by several types of cells, such as fibroblasts, osteoblasts, hepatocytes, monocytes, macrophages, and T-cells (5-7). The LIF receptor is expressed in a wide range of cells. Unlike tyrosine kinase receptors, the LIF receptor has no tyrosine kinase activity in its intracellular domains. Instead, each of the intracellular domains, including LIFRβ and gp130 is in contact with a member of the Janus kinase (JAK) tyrosine kinase family. JAK members are disabled in normal mode, but as soon as LIF is connected to its receptor, JAK protein is phosphorylated in an unknown manner. The LIF receptor can be connected to three members of the JAK family: JAK1, JAK2, and TYK2. Activation of JAK1 occurs by phosphorylation, and in a cascade process, JAK1 activates subsequent molecules by phosphorylation. In this process, activating of JAK1 and cascading of phosphorylation reactions triggers three signaling pathways, including (1) JAK/STAT; (2) MAP kinase; and (3) PI3 kinase. These pathways together lead to differentiation, survival, and self-renewing, depending on the cell type (7). Given the importance of infertility as a social problem, the main goal of this study was.
2. Objectives
To investigate the association of possible polymorphisms of regulatory regions of LIF and LIFR genes with asymptomatic infertility in women. Our hypothesis was that based on the importance of these two genes, some polymorphisms in the expression of their control region can influence their expression level in the endometrium and leads to implantation failure.
3. Methods
3.1. Sampling
For polymorphism studies in the upstream region of LIF and LIFR genes, 5mL of peripheral blood was collected from 100 infertile women (age range: 25 - 40 years) referring to the Infertility Center of the Isfahan Shahid Beheshti Hospital (n = 30) and Shahrekord Hajar Hospital (n = 70).
The inclusion criterion was women who were infertile with no definite cause, such as infection or chromosomal abnormalities. Also, 50 DNA samples belonging to the normal woman (age range: 23 - 45 years) that were extracted in another study were considered as the control group. All the patients who participated in this study were informed about the research, and the study was conducted with their consent. Blood samples were transferred to the laboratory using an anticoagulant (EDTA 0.1 M) and at cold temperatures.
DNA extraction and primer design. Total DNA was extracted using a modified phenol-chloroform method (8). For primer design, the upstream sequence of LIF and LIFR genes were collected from the genome data bank (NCBI; Accession numbers AC004264.1 and AC091823.3, respectively). Functional boxes and motifs in the promoter region of these genes were identified by different software and servers (Table 1).
| Name | Type | Application | Address |
|---|---|---|---|
| Chromas 2.1 | Software | Sequence and chromatogram viewing | http://technelysium.com.au/wp/chromas |
| Generunner | Software | Primer design | www.http://generunner.net |
| CLUSTALW | Server | Homology analysis | http://www.genome.jp/tools/clustalw/ |
| BDGP | Server | Finding a core promoter | http://www.fruitfly.org/index.html (Berkeley Drosophila Genome Project) |
| HCtata | Server | TATA box identification | http://bioinfo.itb.cnr.it/~webgene/wwwHC_tata.html |
| FProm | Server | TATA box identification | http://www.softberry.com/freedownloadhelp/fprom/description.html |
| CisTer | Server | Cis element finding | http://zlab.bu.edu/~mfrith/cister.shtml (Cis-element Cluster Finder) |
| Possum | Server | Transcription factor binding site detection and Cis element finding | https://zlab.bu.edu/~mfrith/possum/ |
Finally, the fragments containing important cis elements were considered as amplicon, and related specific primers were designed using Gene Runner V 4.0.9.67 Beta software (Table 2). Primers were obtained from Bioneer Co. (South Korea).
| Name | Sequence | Amplicon, bp | Annealing Temp, °C* | Accession Number (NCBI) |
|---|---|---|---|---|
| TLFF1 | 5-ACAGGTACAGTGGTCAGCAG-3 | 524 | 60 | AC004264.1 |
| RLFF1 | 5-GGAGGGCTAGGGCTTGGCTG-3 | |||
| TLFF2 | 5-TCCTCCTGGAGCCTCCTTC-3 | 248 | 57 | |
| RLFF2 | 5-GTTTTCCTGCCTGGCTTGTC-3 | |||
| TLFF3 | 5-AAGTCTGTTCTCCCCACCC-3 | 242 | 58 | |
| RLFF3 | 5-TGCACTTCAGAGGGCCTTGG-3 | |||
| FLR1 | 5-TCTTGTTTCCTATATCATCCCC-3 | 216 | 58 | AC091823.3 |
| RLR1 | 5-CCTAGAGGGACACCACCAGC-3 | |||
| 2FLR | 5-AGATACCTAAAGCAACAGCTG-3 | 232 | 56 | |
| RLR2 | 5-CGTAAATATCCATCATCTGTGC-3 |
Polymerase chain reaction single-strand conformation polymorphism (PCR-SSCP)-Sequencing. Standard PCR reactions were performed for amplification of target fragments in 1X PCR buffer, 1.5 mM MgCl2, 200 µM dNTP, 0.4 µM of each primer, 1IU of Taq polymerase enzyme, and 50ng of sample DNA. PCR products were analyzed by 1% agarose gel electrophoresis. In the next step, SSCP analysis was carried out as described by Kakavas et al. (9). Finally, the samples with different conformers from the normal and other samples were selected for sequencing analysis. The selected sampled PCR product was sequenced by ABI 3100 auto sequencer, and Chromas 2/1 software and BLAST server were used for sequence alignment and analysis.
4. Results
4.1. Identification of Regulatory Sequences
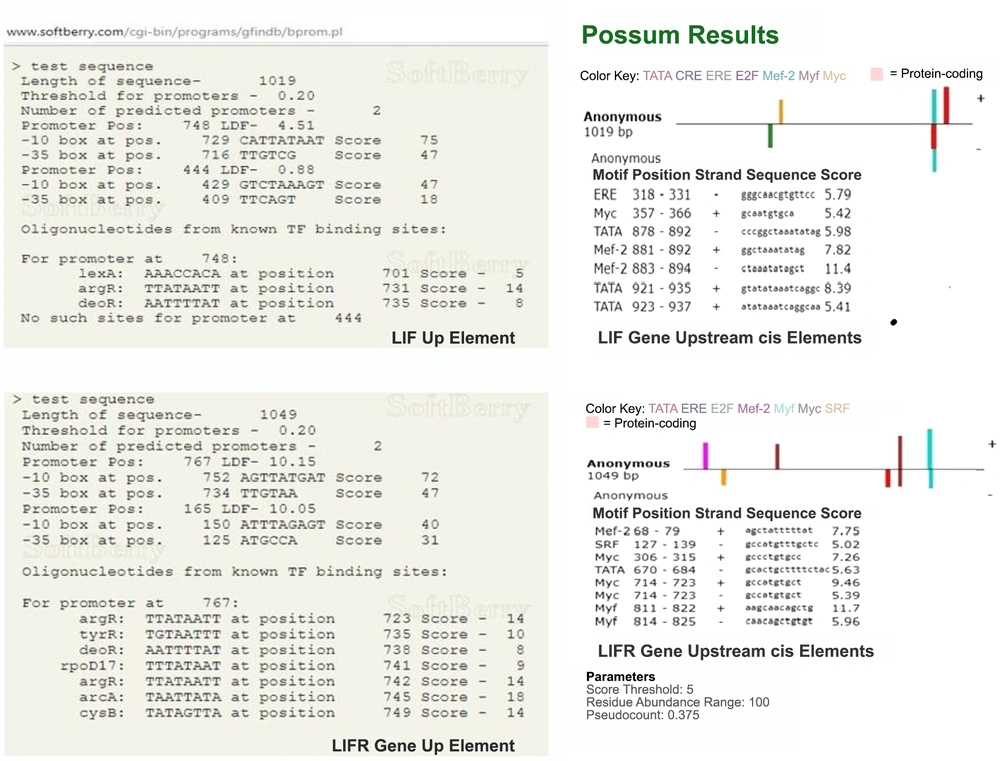
Using genomic data bank (NCBI), about 1000 bp of upstream regions of LIF and LIFR genes were selected, and using promoter prediction tools available in several online servers, such as BDGP, HCtata, FProm, CisTer, and Possum functional motifs were identified. Figure 1 shows the results obtained from FProm and Possum servers.
A, FProm server showed the binding site of some of the transcription factors in the upstream sequences of LIF and LIFR genes; B, based on the Possum server results, the binding site of some of the transcription factors in upstream sequences of LIF and LIFR genes was identified and compared with the results obtained from other servers.
As shown in Figure 1, the binding site position for different regulatory elements, such as MYC and Mef-2 have been identified in the upstream regions of the LIF and LIFR genes. These sequences are required for binding different transcription factors that are involved in regulating the expression of these two genes, which means that any genetic alteration in them can lead to changes in binding the factors and finally can impair the expression of these two genes.
4.2. DNA Extraction and Polymerase Chain Reaction
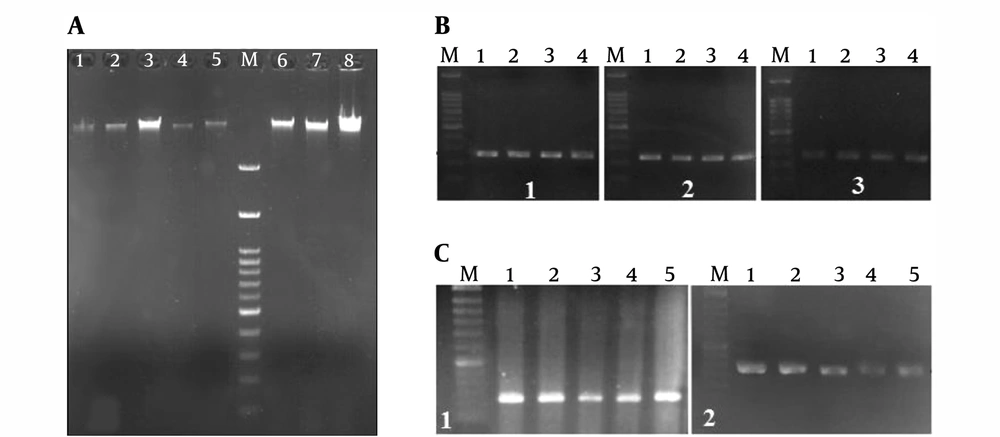
Figure 2A shows the agarose gel electrophoresis of the extracted DNA from the blood samples of some patients.
A, DNA extracted from patients 1 - 8. M, 100 bp DNA size marker. Gel agarose 1%; B, gel electrophoresis of amplified PCR products of the upstream site of the LIF gene after optimization. PCR products of patients 1 - 4. M: 100 bp DNA size marker. Gel agarose 1%; B1, 248 bp bands; B2, 242 bp bands; and B3, 245 bp bands; C, gel electrophoresis of amplified PCR products of the upstream site of the LIFR gene after optimization. PCR products of patients 1 - 5. M: 100 bp DNA size marker. Gel agarose 1%. C1, 216 bp bands; C2, 232 bp bands.
Figures 2B and C show gel electrophoresis of some of the PCR products in the optimum condition that was performed for amplification of the upstream region of LIF and LIFR genes, respectively. The results confirmed the purity of the PCR products and the specific PCR reaction. In other words, the specific band required for the next analysis was obtained.
4.3. Single Stranded Conformational Analysis (SSCP) and Sequencing
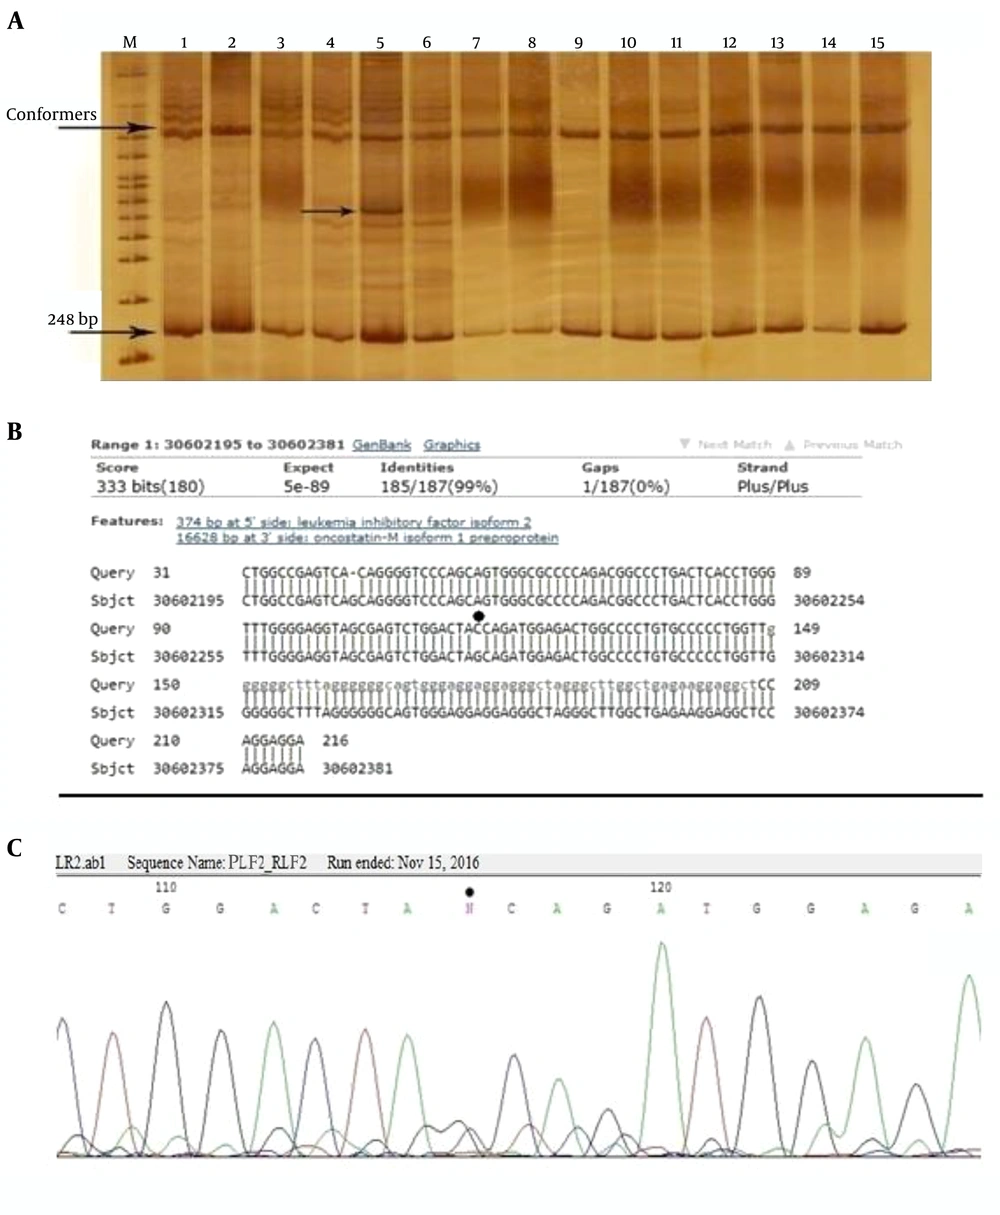
After the optimization of PCR conditions and amplification of fragments of LIF and LIFR genes, SSCP analysis was carried out. PCR products that showed a new conformer were sequenced, and their related sequences were precisely aligned by the BLAST tool. Figures 3 and 4 show the result of this analysis. In this study, two polymorphisms, including two single-nucleotide polymorphisms (SNPs) were detected.
A, The SSCP gel electrophoresis of 248 bp PCR products of the 5’ upstream region of LIF gene using 10% gel acrylamide in TBE buffer (1X). M: DNA size marker, numbers 1 - 10: samples of the patients and 10 - 15 samples of the control group. The new conformer is shown in sample 5; B, the result of the homology analysis of the sequence of this PCR product. Location of the polymorphism is determined by the star; C, chromatogram of this area. Polymorphism is observed as a heterozygote. The position of this polymorphism was named rs30602282g/c. Such a polymorphism on the SNPedia site was not previously reported.
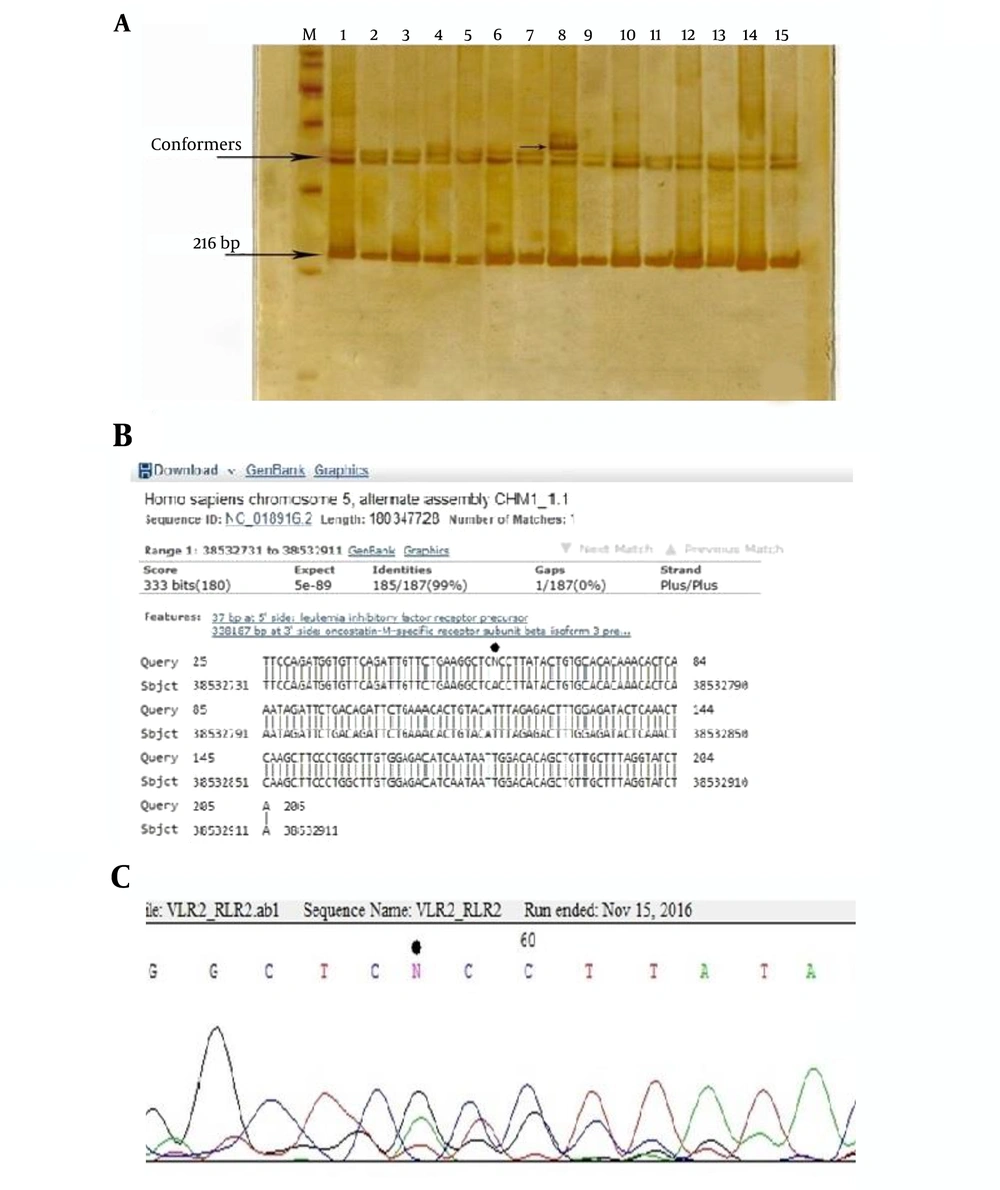
The SSCP gel electrophoresis of 216 bp PCR products of the 5’ upstream region of LIFR gene using 10% gel acrylamide in TBE buffer (1X). M: DNA size marker, numbers 1 - 10: samples of the patients and 10 - 15 samples of the control group. The new conformer is shown in sample 8; B, the result of the homology analysis of the sequence of this PCR product. Location of the polymorphism is determined by the star; C, chromatogram of this area. Polymorphism is observed as a heterozygote. The position of this polymorphism was named rs38532765 a/g.
Figure 3A shows the acrylamide gel of the SSCP test, and a new conformer is marked. Sequence homology analysis results of this sample using the BLAST server showed the location of the new variant, and the location of the polymorphism is pointed in the corresponding chromatogram.
Another polymorphism is shown in Figure 4. Figure 4A shows the new conformer that was detected in the upstream sequence of one patient. Sequence analysis showed a/g replacement in this region that was confirmed by BLAST server homology analysis.
5. Discussion
In this study, the presence of polymorphisms in the upstream region of LIF and LIFR genes was investigated. After collecting of the related sequences from the genomic databases, a bioinformatics study was performed on the target sequences to focus on screening with maximum confidence in functional sequences. In the next step, the target sequences were amplified by PCR and examined by the SSCP method. Finally, two polymorphisms were detected in suspected cases. The high prevalence of infertility in the world, emphasizes the importance of research about its causes. According to the World Health Organization, it is estimated that about 8% of couples experience some type of infertility during their fertility years. In other words, around the world, 50 to 80 million people have primary or secondary infertility. Infertility is a common clinical problem in humans that has a similar outbreak of life-threatening conditions, like diabetes or hypertension. More than 10% of couples experience some types of infertility (2, 10). The importance of LIF and LIFR genes in the process of fertility and embryonic development has been proposed in many studies; thus, we selected these genes. A review of LIF expression has shown that this gene is expressed in a wide range of tissues and at different times of growth and development. The expression level of LIF during pregnancy is high in the embryonic membranes (11). Studies on the LIF gene polymorphism and its association with recurrent miscarriage have shown that it is a good marker for unexplained infertility (12). Interestingly, these polymorphisms are also associated with pregnancy success rates after supportive treatments (13). However, the polymorphism of the regulatory region of this gene has not been studied yet. In other studies, gene deletion studies have shown that maternal LIF is essential for the implantation process. Expression studies on human endometrial LIF encoding mRNA have confirmed the importance of its expression at the time of implantation (14, 15). The expression of this gene varies throughout the different days of the cycle, and like the proximity to the time of implantation approaches, the expression of this gene increases (16, 17). LIFR was another gene that we focused on its expression at the regulatory phase. The LIFR gene can encode a protein that acts as the receptor of LIF, OSM, CNTF, and CT-1 cytokines. This multifunctional action indicates the importance of this receptor. For binding to this receptor, there is a difference in the desire for the ligand (7). In the present study, we considered this multiplicity of LIF receptor; however, the multiplicity of LIF receptor made our study more complex. In other words, we had a special focus on the women who were treated with a high dose of progesterone for treatment. Multiple signaling routes can justify a very low prevalence of mutations with loss of function properties, such as deletion and decreasing of expression for LIF and LIFR genes. Two reasons may explain this proposal: Firstly, mutations that lead to a significant reduction in the expression and function of these two genes are likely lethal and will effectively lead to loss of the embryos at the early days of development. Secondly, this pathway involves a large number of genes, and the use of compensatory effects by the alternative molecules is possible, a paralog activity phenomenon similar to that observed in the HOX gene family (18). Therefore, it can be suggested that other genes in this pathway are also suitable candidates that should be investigated simultaneously. Several studies have shown that there is a positive relationship between supportive use of estrogen and progesterone by increasing the expression of important genes in the implantation as well as uterine preparedness in the admission of the blastocyst. This finings is according to the presence of steroid-responsive elements at the upstream of the LIF gene that has been reported in addition to our study in other studies, as well (19, 20). The increase in the titer of these hormones seems to compensate for the weakness of the promoter region in inducing the expression of these genes. Hormone dosage compensation is mentioned in some studies (21). This action is probably done in two ways: The first possibility is the cross-linking reaction with the LIF receptor that occurs in the high-hormonal titer conditions. The second possibility is the effect of these hormones at higher doses on promoters whose tendency to binding to inducing factors has been weakened due to polymorphisms. A study on the upstream polymorphism of some genes concerning infertility is available in various reports (22). In humans, no direct study on the upstream region of the LIF and LIFR genes in relation to infertility has been conducted and our study is the first report in this field. Considering that a reduction in the expression level of these genes in many studies has been associated with infertility in women (4, 11, 23), assessing polymorphism in the control region of the expression of these two genes is important and should be considered.
In this study, in addition to studying the homology and sequence conservation of selected sequences using the ClustalW server, the selected sequences were evaluated by BDGP, HCtata, FProm, CisTer, and Possum servers. The BDGP server is highly efficient for the identification of the core promoter sequences and has been used in other studies (24, 25). The highest score for a promoter sequence on this server is a score of 1, which yielded a score of 1 and 0.9 for the sequences that we examined. Also, in our study, HCtata (26) and FProm (21) servers were used to examine the existence of the TATA box and its position in the target sequences, and both servers reported the same situations. In addition to identifying the presence of a signal and functional sequences that were associated with some of the most important transcription factors, such as C-MYC, the CisTer (27) and Possum (28) servers were utilized that they detected similar binding motifs for the selected transcription factors with close scores. The role of MYC protein in the regulation of the genes involved in embryonic development and stem cell metabolism has been reported in some previous studies (29, 30). Also, in the initial upstream region of LIF and LIFR genes, the binding sites of Mef-2 factors were identified. This factor has been well identified in the previous studies as a transcription factor and a key regulator of several genes involved in male gonad development (31) and the existence of binding sequences for it in the upstream region of LIF and LIFR genes, demonstrates the accuracy of our study.
Using these resulted data, target sequences in the upstream region of LIF and LIFR genes were selected and the associate primers were designed. In our study, two mutations were identified and reported. Conservation of functional sequences in regulatory areas of genes has been emphasized in numerous reports and supports our results. In summary, in this study, after careful bioinformatics study and PCR –SSCP and sequencing analyses, polymorphisms were reported in only two patients and no polymorphism in healthy cases was observed. These results indicate that the upstream region of the studied genes acts as conserve sequences and supports the importance of regulating mechanisms for controlling the expression of LIF and LIFR genes.
