
1. Introduction
In this review, post-induction hypotension (PIH) denotes a clinically relevant fall in arterial blood pressure that occurs after the induction of general anesthesia and before surgical incision. There is no universally accepted definition; the most commonly used thresholds are a mean arterial pressure (MAP) below 65 mm Hg, a systolic blood pressure (SBP) below 90 mm Hg, or a relative decrease of 20 - 30% from baseline, applied within a post-induction window of variable length (1). Approximately one third of all intraoperative hypotension occurs between induction and skin incision (2), and the reported incidence of PIH ranges from about 10% to 80%, depending on the threshold and population studied (3, 4). Induction agents attenuate sympathetic tone, cause vasodilation, and reduce venous return, which explains the vulnerability of this period (5). Intraoperative MAP values below approximately 65 mm Hg are associated with organ hypoperfusion, even when brief (6, 7), and intraoperative hypotension, including hypotension after intubation, has been associated with myocardial injury, acute kidney injury, and other postoperative complications (8, 9). In addition, the anesthesiologist's workload is high during induction and airway management, which can delay the recognition and treatment of a rapid fall in blood pressure (10, 11).
Several risk factors for PIH are recognized, including advanced age, emergency surgery, induction drug doses, and certain preoperative medications, but these factors explain only part of the variation in susceptibility (5, 12-14). Hypotension is therefore usually treated after it occurs rather than anticipated (15). Ultrasound-based and advanced hemodynamic monitoring approaches have been investigated to anticipate PIH, but they depend on operator skill, specific equipment, or invasive access, limiting their routine use (11, 16). A tool that uses routinely available clinical data to estimate individual risk before or during induction could support preparation and targeted prevention.
Machine learning (ML) methods can model nonlinear relationships and interactions among many routinely collected variables (17). In anesthesiology, the Hypotension Prediction Index illustrates how algorithmic prediction can support proactive hemodynamic management, although it relies on arterial waveform analysis and targets hypotension throughout surgery rather than specifically during the post-induction period (18, 19). Several ML models that predict PIH specifically from clinical and peri-induction data have been published, with reported discrimination ranging from modest to high (4, 20-22). Previous systematic reviews have pooled the performance of artificial intelligence (AI) models for intraoperative hypotension in general, combining different prediction targets, horizons, and monitoring modalities (23, 24), and a recent review of PIH prediction models combined regression-based clinical scores with ML models and pooled discrimination only (25). The accuracy of ML models for PIH, the adequacy of their validation and calibration, and their bedside implications therefore remain unclear.
We therefore conducted a systematic review and meta-analysis of ML models for predicting PIH in adults under general anesthesia. Our objectives were to 1) summarize their discrimination, sensitivity, and specificity using methods appropriate for prediction-model and test-accuracy data; 2) describe how these models were developed and validated, including the timing of predictors relative to the outcome window and the reporting of calibration and clinical utility; and 3) appraise their risk of bias and identify priorities for future research.
2. Methods
2.1. Protocol, Registration, and Reporting
This review is reported in accordance with the Preferred Reporting Items for Systematic Reviews and Meta-Analyses (PRISMA) 2020 statement (26), and items from the PRISMA extension for diagnostic test accuracy reviews were used to report sensitivity and specificity (27). The review protocol was not prospectively registered in PROSPERO or another registry.
2.2. Search Strategy
PubMed, Embase, Scopus, and Web of Science were searched from database inception to 4 October 2025. The search combined controlled vocabulary and free-text terms for hypotension, the induction of anesthesia, and ML or AI; the full search strategy for each database and the number of records retrieved are provided in Table S1 in the Supplementary File. Only peer-reviewed articles published in English were eligible, and no restrictions on study design were applied. The reference lists of all included articles were screened manually. Study selection is summarized in a flow diagram based on the Preferred Reporting Items for Systematic Reviews and Meta-Analyses (PRISMA) 2020.
2.3. Eligibility Criteria
Studies were eligible if they developed, validated, or compared predictive models using machine learning (ML) algorithms to predict PIH in adults undergoing general anesthesia. Machine learning was defined broadly as supervised learning within a data-driven training and validation framework. This definition included logistic regression developed with data-driven feature selection and cross-validation, as well as ensemble methods (e.g., random forest, XGBoost, gradient boosting), artificial and deep neural networks, and support vector machines. Studies relying solely on conventional multivariable regression without a training and validation procedure or predictive-modeling framework were excluded. Prospective and retrospective original studies, including cohort studies, clinical trials, and secondary analyses, were eligible. Studies had to report at least one performance measure for PIH prediction, such as the area under the receiver operating characteristic curve (AUC), accuracy, sensitivity, or specificity.
Because PIH has no universally accepted definition, studies were eligible regardless of the blood pressure threshold or post-induction window, provided that the definition was stated explicitly. The definition and window used in each study were recorded and treated as potential sources of clinical heterogeneity.
Studies were excluded if they did not address ML-based prediction of PIH or did not report primary data. Case reports, conference abstracts, letters, protocols, commentaries, theses, and non-English publications were also excluded. Studies based on animal or simulated data were excluded. To restrict the population to adults, studies that enrolled participants younger than 18 years were excluded. This criterion was applied to the age range stated in the full text, and studies whose eligible population explicitly included minors were excluded because adult data could not be separated. When multiple publications reported the same or an overlapping cohort, the reports were linked and treated as one study cohort. All linked reports were described, but each meta-analysis included only one estimate per cohort, taken from the most comprehensive report that provided the relevant measure. The eligibility criteria are summarized in the population, intervention, comparator, and outcome format in Table S2 in the Supplementary File.
Two reviewers independently screened all titles and abstracts and then assessed the full texts of potentially eligible records. Disagreements were resolved through discussion, with a third reviewer consulted when necessary.
2.4. Data Extraction
Two reviewers independently extracted data using a standardized form based on the critical appraisal and data extraction for systematic reviews of prediction modeling studies (CHARMS) checklist (28) (Table S3 in the Supplementary File). The extracted items were as follows: 1) study characteristics (author, year, country, design, data source and period, and sample size); 2) population (age, sex, American Society of Anesthesiologists physical status, comorbidities, and surgical setting); 3) the PIH definition and outcome window; 4) the model and comparator algorithms, candidate and final predictors, and feature-selection methods; 5) the timing of predictor measurement relative to the outcome window; 6) the development and validation strategy, including cross-validation, random split, temporal validation, and geographically external validation; and 7) performance measures and their uncertainty (AUC, sensitivity, specificity, predictive values, and accuracy), the classification threshold and the method used to select it, calibration measures, and decision-curve analysis. Adherence to reporting guidelines (TRIPOD or TRIPOD+AI) (29) and the use of model-explanation methods were also recorded. Disagreements were resolved by re-examining the source publication, with adjudication by a third reviewer when necessary. All extracted values were verified against the full texts.
For each study, the model selected for synthesis was the one with the highest reported AUC or, if no AUC was reported, the model designated by the authors as their best or final model. For that model, we used the most independent performance estimate available, in the following order: Temporal or external validation, a held-out random test set, and cross-validation. Sensitivity and specificity were taken from the same model and evaluation set as the AUC. When specificity was not reported but precision (positive predictive value), recall (sensitivity), and outcome prevalence were reported, specificity was derived arithmetically and labeled as derived. Reported values that were internally inconsistent were not used for derivation. To describe whether a model predicted future hypotension or detected hypotension that was already developing, predictor timing was classified into three tiers: tier 1, information available before induction only; tier 2, pre-induction information plus induction drug doses; and tier 3, hemodynamic measurements recorded after the start of induction.
2.5. Risk of Bias Assessment
Risk of bias and applicability were assessed using the Prediction model Risk Of Bias ASsessment Tool (PROBAST), which addresses four domains: Participants, predictors, outcome, and analysis (30-32).
Two reviewers independently answered the PROBAST signaling questions for each study and rated each domain as having a low, high, or unclear risk of bias. A study was rated as having a low overall risk only if all domains were at low risk and a high overall risk if any domain was at high risk; otherwise, it was rated as unclear. Disagreements were resolved through discussion or by a third reviewer. Studies were not excluded based on risk of bias. A sensitivity analysis excluding studies at high risk of bias was prespecified.
2.6. Statistical Analysis
Analyses were performed in Python (version 3.13; NumPy, SciPy, and pandas) using scripts written for this review; the random-effects routine exactly reproduced the results of the R package metafor for a published benchmark dataset. The analysis dataset and outputs are provided as Supplementary Data in the Supplementary File. A two-sided P value below 0.05 was considered statistically significant, and between-subgroup tests were interpreted as exploratory.
The primary outcome was discrimination, measured as the AUC. To ensure a consistent measure of uncertainty across studies, the standard error of each AUC was calculated using the Hanley-McNeil method based on the AUC and the numbers of participants with and without PIH in the evaluation set (33). When the number of events in the evaluation set was not reported, it was approximated from the reported prevalence. Analyses using standard errors derived from the reported 95% confidence intervals (CIs) were performed as a sensitivity analysis.
The AUCs were logit-transformed before pooling, and summary estimates were back-transformed (34). The AUCs were pooled using a random-effects model with the restricted maximum-likelihood estimator of between-study variance (τ2). Because the number of studies was small, 95% CIs were calculated using the Hartung-Knapp-Sidik-Jonkman method (35). Heterogeneity was quantified using Cochran's Q, I2, and τ2. A 95% prediction interval (PI) was calculated to indicate the range within which the AUC of a model applied in a new, comparable setting would be expected to lie (36). The primary analysis included one estimate per independent cohort.
Sensitivity and specificity are correlated and threshold-dependent; therefore, they were pooled jointly using the bivariate random-effects model of Reitsma et al. (37), which is equivalent to the hierarchical summary receiver operating characteristic model in the absence of covariates (38). Two-by-two tables were reconstructed from the reported sensitivity, specificity, and numbers of participants with and without PIH in the evaluation set. Summary sensitivity and specificity, likelihood ratios, the diagnostic odds ratio, and 95% confidence and prediction regions were estimated; univariate pooling of each measure is reported as a secondary analysis. To illustrate clinical implications, positive and negative predictive values and the expected numbers of true-positive, false-positive, and missed cases per 1,000 patients were calculated at plausible PIH prevalences (post hoc).
Small-study effects were not formally assessed because tests for funnel-plot asymmetry are not recommended when fewer than ten studies are available and are difficult to interpret for AUC data (39). A funnel plot is shown descriptively in Figure S3 in the Supplementary File. The Egger regression test and the trim-and-fill method, which had been planned initially, were therefore not applied.
The robustness of the pooled AUC was examined with leave-one-out analysis and the following sensitivity analyses: substituting the alternative report for each overlapping cohort; including all reports irrespective of overlap; restricting the analysis to temporal or held-out test-set estimates; excluding the study analyzed using clustered cases and cross-validation only; excluding the study with the largest AUC; using standard errors derived from reported CIs; and, to examine optimism arising from selecting the best of several models, replacing the best model of each study with its median-performing model (post hoc). The prespecified exclusion of studies at high risk of bias was not feasible because only one study was not at high overall risk. Instead, studies not at high risk of bias in the PROBAST analysis domain were analyzed separately (post hoc).
Potential sources of heterogeneity were explored using mixed-effects meta-regression (restricted maximum-likelihood, Knapp-Hartung F test) with four categorical moderators, each analyzed one at a time: model family (tree-based, regression-based, or neural network), PIH definition (MAP below 55 mm Hg; MAP at or below 65 mm Hg with or without a relative fall; or a composite based on SBP below 90 mm Hg), validation type, and predictor-timing tier. Model family and PIH definition were prespecified; validation type and predictor timing were added post hoc. Given the small number of studies per subgroup, these analyses were regarded as hypothesis-generating, and no inference about the superiority of a model family was drawn from them. Within-study comparisons between the best model and the other models evaluated on the same data, including a logistic regression or other linear comparator when available, were summarized descriptively because they are not confounded by differences in population or outcome definition.
3. Results
Table 3.
Comparison of the Present Review with Previous Systematic Reviews of Machine Learning or Prediction Models for Hypotension a
| Review | Scope and Population | Prediction Target | Eligible Models | Included Studies | Measures Synthesized | Statistical Approach | Main Remaining Gaps |
|---|---|---|---|---|---|---|---|
| Mohammadi 2024 (23) | Any surgery; intraoperative hypotension | Hypotension at any intraoperative time, mostly minutes-ahead | HPI and other AI models | 43 (5 overlap with present review) | HPI clinical outcomes; AUROC of non-HPI models | Univariate random effects | PIH not separated; heterogeneous horizons; no accuracy pairs |
| Mehta 2024 (24) | Perioperative care | Clinical and process outcomes of ML-guided care | ML-augmented interventions | Interventional studies | Intervention effects | Meta-analysis of interventions | Not a prediction-accuracy synthesis |
| Meng 2026 (25) | Adults under GA; published after our search | PIH with explicit window | Any prediction model, including conventional regression | 17 (8 overlap); both VitalDB reports included | AUC; pooled ORs of predictors | Univariate random effects; best model per study | No pooling of sensitivity/specificity; overlapping data; predictor timing not examined |
| Present review | Adults under GA | PIH with explicit definition and window | ML, including data-driven logistic regression | 10 reports (8 independent cohorts) | AUC; joint sensitivity and specificity; predictive values | restricted maximum-likelihood with HKSJ CI and prediction interval; consistent AUC SE; bivariate model; optimism and timing analyses | Small number of cohorts; no external validation in primary studies |
a Abbreviations: AI, artificial intelligence; AUC, area under the receiver operating characteristic curve; AUROC, area under the receiver operating characteristic curve; GA, general anesthesia; HKSJ, Hartung-Knapp-Sidik-Jonkman; HPI, Hypotension Prediction Index; ML, machine learning; OR, odds ratio; PIH, post-induction hypotension; SE, standard error.
3.1. Study Selection Process
The searches identified 596 records: PubMed (n = 80), Embase (n = 166), Scopus (n = 223), and Web of Science (n = 127). After 216 duplicates were removed, 380 records were screened, and 354 were excluded. Of the 26 reports sought for retrieval, 22 were obtained; the full texts of the remaining four reports were unavailable. No searchable records for three reports were found in Google Scholar, and access to the webpage for the fourth report was blocked.
Of the 22 reports assessed for eligibility, 12 were excluded for the following reasons: outcome other than PIH (n = 8), ineligible methodology (n = 1), thesis (n = 1), non-English publication (n = 1), and a population that included participants younger than 18 years (n = 1). The last exclusion concerned the study by Kendale et al., which enrolled patients older than 12 years without separate adult results and therefore did not meet the adult-only criterion (40). Ten reports were included (4, 11, 20-22, 41-45) (Figure 1). Two pairs of reports used overlapping data: Kang et al. and Lee et al. analyzed data from patients who underwent laparoscopic cholecystectomy at the same hospital during overlapping periods, using the same database (22, 44), whereas Park et al. and Chen et al. both analyzed the open VitalDB registry (4, 11). Thus, the ten reports represented eight independent cohorts.
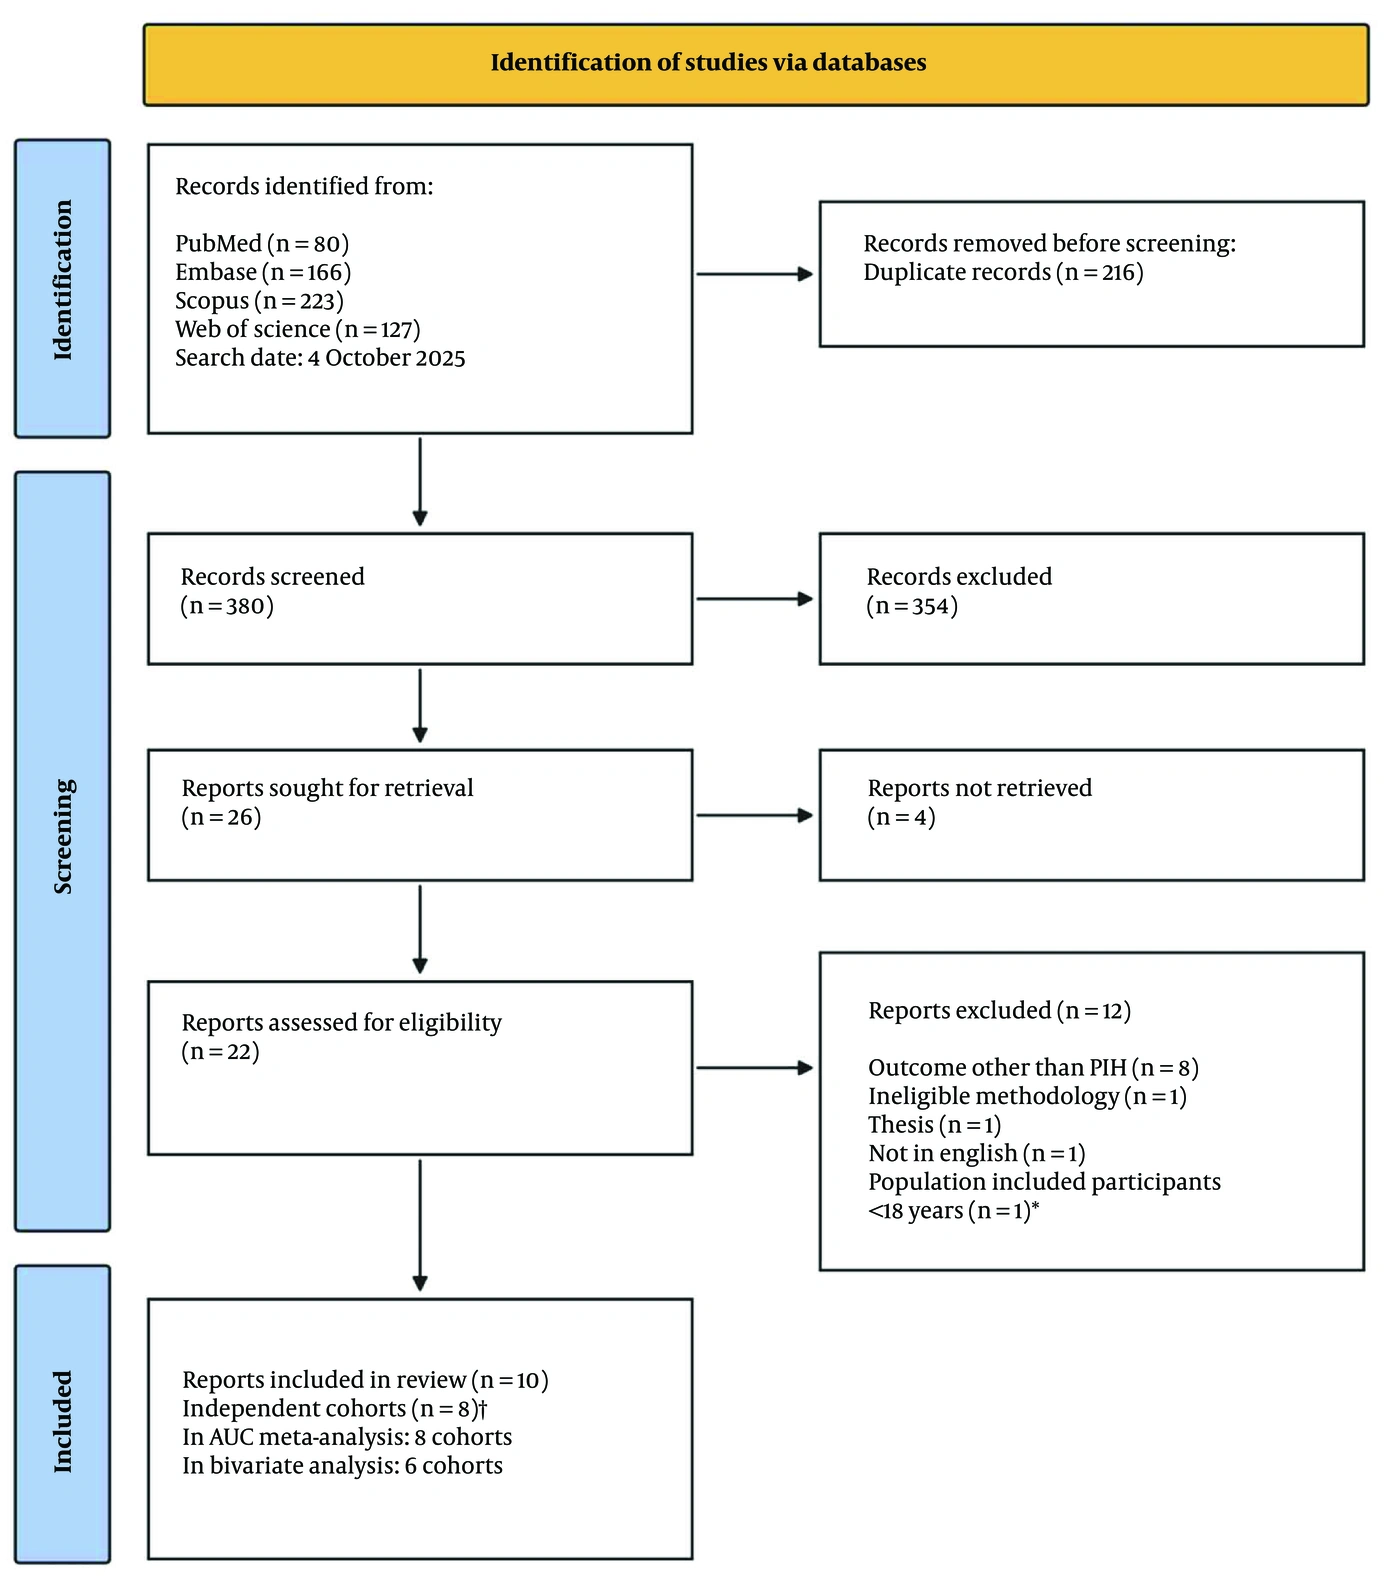
Figure 1.
PRISMA 2020 flow diagram of study selection.
3.2. Characteristics of the Included Studies
The included reports were published between 2011 and 2025 (Table 1; full data extraction is provided in Table S5 in the Supplementary File). Studies were conducted in South Korea (n = 3), China (n = 3), Taiwan, Japan, Israel, and the United States (n = 1 each); one Chinese study analyzed the Korean VitalDB registry (11). Nine studies were retrospective, and one was a prospective cohort study (45). Cohort sizes ranged from 222 to 201,000 patients (22, 42), with a total of 238,123 participants across reports (at most 234,232 unique participants after accounting for overlap); 201,000 participants (84%) came from a single two-center registry (42). The incidence of PIH ranged from 17.0% to 63.3% (4, 11). Most cohorts comprised mixed non-cardiac surgical populations; two reports concerned laparoscopic cholecystectomy (22, 44), one concerned cardiac surgery (20), and one included patients aged 65 years or older (45). PIH definitions differed: MAP below 55 mm Hg (three reports), MAP at or below 65 mm Hg with or without a relative fall (three reports), and composites based on SBP below 90 mm Hg (four reports). The outcome window ranged from the first 10 minutes after induction to the interval between induction or tracheal intubation and incision.
Table 1.
Characteristics of the Included Studies (Detailed Extraction in Table S5 in the Supplementary File) a
| Study | Country; design; data source (period) | Population / surgery (age, y) | N (cohort) | PIH | PIH definition (blood pressure, mm Hg); outcome window (seconds or minutes) | Evaluation set used (n; events) |
|---|---|---|---|---|---|---|
| Lin 2011 (43) | Taiwan; retrospective; single center (2007 - 2008) | Patients under GA with IV induction (age range not stated b); mixed surgery | 1,311 | 482 (36.8) | SBP < 90 mm Hg or SBP fall > 30% from baseline; induction to surgical stimulation | Temporal validation (294; 106) |
| Kang 2020 (22) c | South Korea; retrospective; single center (Oct 2018–May 2019) | Adults; laparoscopic cholecystectomy under TIVA | 222 | 126 (56.8) | SBP < 90 or MBP < 65 mm Hg (or vasopressor use); tracheal intubation to incision | Repeated 4-fold CV (222; 126) |
| Lee 2020 (44) c | South Korea; retrospective; single center (Oct 2018–Jul 2019) | Adults; laparoscopic cholecystectomy under GA | 282 | 151 (53.5) | SBP < 90 or MBP < 65 mm Hg; tracheal intubation to incision (prediction 1 min before intubation) | Repeated 10-fold CV (282; 151) |
| Li 2021 (20) | China; retrospective; single center (2007 - 2018) | Adults; cardiac surgery | 3,030 | 1,578 (52.1) | SBP < 90 or MBP < 65 mm Hg; induction to start of surgery | Held-out test set (909; 490) d |
| Yoshimura 2022 (41) | Japan; retrospective; single center (2014 - 2019) | Adults with preoperative echocardiography; non-cardiac, non-obstetric surgery | 1,956 | 670 (34.3) | Any MAP < 55 mm Hg; induction to start of surgery | Held-out test set (587; ≈200) d |
| Park 2025 (4)§ | South Korea; retrospective; open registry VitalDB (2016 - 2017) | Adults with arterial line; non-cardiac surgery | 3,669 | 2,321 (63.3) | Sustained MAP < 65 mm Hg (≥ 6 s); 20 min after induction or incision | Held-out test set (1, 101, 672) |
| Chen 2025 (11)§ | China (Korean data); retrospective; open registry VitalDB | Non-cardiac surgery (age restriction not reported) | 5,406 | 921 (17.0) | Any MAP < 55 mm Hg; induction to start of surgery | Held-out test set (1,622; ≈276) d |
| Bian 2025 (45) | China; prospective cohort; single center (Dec 2022–Aug 2023) | Adults ≥ 65 y; elective non-cardiac surgery | 938 | 481 (51.3) | MAP ≤ 65 mm Hg or MAP fall > 30% from ward baseline; 15 min after induction or incision | Temporal validation (281; 142) |
| Katsin 2025 (21) | Israel; retrospective; single center (2018 - 2023) | Adults; non-obstetric inpatient surgery with IV induction | 20,309 | 4,948 (24.4) | Any MAP < 55 mm Hg; 10 min after completion of induction | 5-fold CV / 20% hold-out, unclear (4,062; ≈991) d |
| Sarullo 2025 (42) | USA; retrospective; two-center registry (2005 - 2017) | Adults; non-cardiac surgery under GA | 201,000 | NR ("relatively even") | MAP < 65 mm Hg; first 10 min after induction | 5-fold CV (201,000; NR) |
a Values are expressed as No. (%). Abbreviations: CV, cross-validation; GA, general anesthesia; IV, intravenous; MAP, mean arterial pressure; MBP, mean blood pressure; NR, not reported; PIH, post-induction hypotension; SBP, systolic blood pressure; TIVA, total intravenous anesthesia.
b Age eligibility was not stated; the validation cohort had a mean age of 46.4 ± 17.4 years.
c Overlapping cohort (same hospital, database and period); only one of the two reports contributes to each meta-analysis.
d The number of events in the evaluation set was derived (Li) or approximated from the reported prevalence (Yoshimura, Chen, Katsin). §Overlapping data source (VitalDB).
3.3. Risk of Bias
After full application of the PROBAST signaling questions, nine reports were at high overall risk of bias, and one was at unclear risk (11); none was at low overall risk (Table 2; item-level judgments in Table S4 in the Supplementary File). The analysis domain was the main source of bias (high risk in seven reports), owing to few events relative to the number of candidate predictors, data-driven feature selection without an independent test set, simple imputation or complete-case analysis, analysis of clustered cases as independent, and lack of calibration assessment. In three reports, predictors included information recorded within the outcome window, such as induction-phase blood pressure or drug doses (predictor domain) (4, 20, 42), whereas in two reports, baseline blood pressure was both a predictor and a component of a relative-fall outcome definition (outcome domain) (43, 45).
Table 2.
Selected Model, Evaluation Set, Performance and Overall Risk of Bias of Each Included Study a
| Study | Selected Model (Family) | Predictor Timing b | AUC (95% CI), as Reported | Sensitivity | Specificity | Threshold Selection | Calibration / DCA | Overall ROB |
|---|---|---|---|---|---|---|---|---|
| Lin 2011 (43) | ANN (neural network (NN)) | Tier 2 | 0.893 (NR) | 0.764 | 0.856 | NR | H-L test, plot / No | High |
| Kang 2020 (22) | Random forest (tree) | Tier 3 | 0.842 (0.736 - 0.948) | 0.837 | 0.745 c | NR | No / No | High |
| Lee 2020 (44) | Random forest (tree) | Tier 3 | NR | 0.784 | 0.711 c | NR | No / No | High |
| Li 2021 (20) | Random forest (tree) | Tier 2 | 0.843 (0.808 - 0.877) | 0.788 | 0.856 | NR | No / No | High |
| Yoshimura 2022 (41) | Deep NN | Tier 1 | 0.72 (0.67 - 0.76) | 0.650 | 0.700 | Youden index | No / Yes | High |
| Park 2025 (4) | XGBoost (tree) | Tier 3 | 0.772 (0.771 - 0.774) d | 0.688 | 0.714 | Fixed 0.5 | No / No | High |
| Chen 2025 (11) | Logistic regression (regression) | Tier 1 | 0.74 (0.71 - 0.77) | 0.700 | 0.68 c | Youden index | Curve, Brier / Yes | Unclear |
| Bian 2025 (45) | Logistic regression (regression) | Tier 1 | 0.697 (0.635 - 0.759) | 0.634 | 0.698 | NR | Curve, H-L, Brier / Yes | High |
| Katsin 2025 (21) | Random forest (tree) | Tier 2 | 0.732 (NR) | 0.760 | NR e | NR | No / No | High |
| Sarullo 2025 (42) | XGBoost (tree) | Tier 2 | 0.697 (NR) | NR | NR | NA | No / No | High |
a Abbreviations: ANN, artificial neural network; AUC, area under the receiver operating characteristic curve; CI, confidence interval; DCA, decision-curve analysis; H-L, Hosmer-Lemeshow; NA, not applicable; NN, neural network; NR, not reported; ROB, risk of bias; PROBAST, Prediction model Risk Of Bias ASsessment Tool.
b Tier 1, pre-induction information only; tier 2, pre-induction information plus induction drug doses; tier 3, includes hemodynamic measurements recorded after the start of induction.
c Derived from the reported precision, recall, and prevalence.
d The reported interval is implausibly narrow for n = 1,101 (Hanley-McNeil 95% CI 0.744 - 0.798).
e Not derivable because the reported accuracy, precision, and recall are mutually inconsistent.
3.4. Model Development, Validation, and Performance
Table 2 summarizes the selected model from each study. The selected models were tree-based in six reports (random forest in four and gradient boosting in two) (4, 20-22, 42, 44), logistic regression in two (11, 45), and a neural network in two (41, 43). In the study by Sarullo et al., the best-performing model was XGBoost (AUC 0.697); the proposed monotonic neural network performed slightly worse (AUC 0.671) (42). No study performed geographically external validation. Two studies performed temporal validation at the development center (43, 45), four used a held-out random test set (4, 11, 20, 41), three reported cross-validation only (22, 42, 44), and one did not clearly state whether its metrics were derived from cross-validation or its held-out set (21). Reported AUCs ranged from 0.697 to 0.893 (42, 43, 45). Three models used only information available before induction (tier 1) (11, 41, 45), four added induction drug doses (tier 2) (20, 21, 42, 43), and three used blood pressure recorded after the start of induction (tier 3) (4, 22, 44). Tier 3 models therefore partly identify hypotension that is already developing rather than predict a future event. Only three studies stated how the classification threshold was chosen (Youden index in two and a fixed cutoff of 0.5 in one) (4, 11, 41). Calibration was reported for three models (11, 43, 45), and decision-curve analysis was reported for three (11, 41, 45); no study evaluated the effect of model use on clinical outcomes. Pre-induction blood pressure was among the most influential predictors in most studies that reported variable importance.
Several reporting problems in the primary studies affected data extraction. Lee et al. reported no AUC; we used the random forest model that the authors identified as their best model, with its recall (sensitivity) rather than its precision (44). Lin et al. described their validation as external, but the validation cohort came from the same hospital in a later period, as did Bian et al.’s validation cohort; both were therefore classified as temporal validation, and Bian et al.’s temporal rather than internal (bootstrap) estimates were used (43, 45). Internally inconsistent metrics were identified in two reports: the accuracy reported by Katsin et al. is incompatible with its recall, precision, and prevalence, and the predictive values reported by Yoshimura et al. are incompatible with its sensitivity, specificity, and prevalence (21, 41).
3.5. Meta-Analysis of Discrimination
Eight independent cohorts contributed to the primary AUC analysis. The pooled AUC was 0.78 (95% CI, 0.70 - 0.84), with substantial heterogeneity (τ2 = 0.196 on the logit scale; I2 = 97.7%; Q = 142.0, df = 7, P < 0.001). The 95% PI was 0.52 - 0.92, indicating that the discrimination of a model applied in a new, comparable setting could range from little better than chance to excellent (Figure 2).
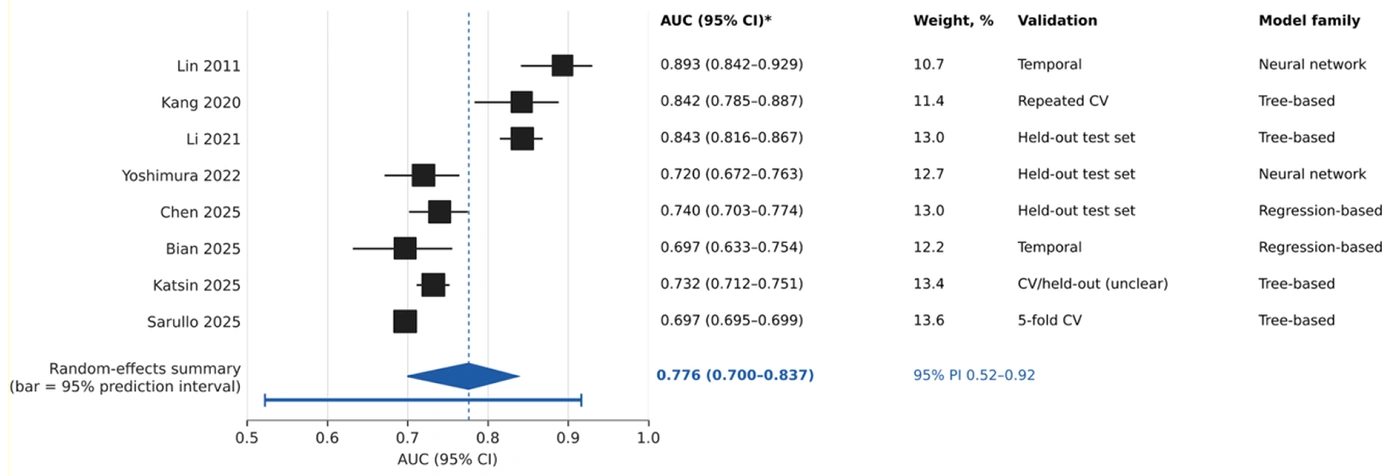
Figure 2.
Forest plot of the area under the receiver operating characteristic curve (AUC) of the selected model of each independent cohort. Squares show study estimates (size proportional to random-effects weight) with 95% confidence intervals (CIs) recomputed by the Hanley-McNeil method; weights are given as percentages. The diamond shows the pooled estimate (restricted maximum-likelihood random-effects model; Hartung-Knapp-Sidik-Jonkman 95% CI), and the horizontal bar beneath it the 95% prediction interval. Heterogeneity statistics (τ2, I2, and Q) are shown below the plot. Validation: Temporal, temporal validation at the development center; Held-out test set, random split; CV, cross-validation. Model family: Tree-based, random forest or gradient boosting; Regression-based, logistic regression; Neural network, artificial or deep neural network (11, 20-22, 41-43, 45)
The pooled AUC was stable in sensitivity analyses (Figure 3; Table S6 in the Supplementary File): 0.78 (0.71 - 0.84) when the VitalDB cohort was represented by Park et al. instead of Chen et al.; 0.78 (0.71 - 0.83) when all nine reports with an AUC were included; 0.79 (0.65 - 0.88) in analyses restricted to temporal or held-out test-set estimates; 0.79 (0.70 - 0.85) after excluding Sarullo et al.; and 0.76 (0.69 - 0.81) after excluding Lin et al., the study with the largest AUC. In leave-one-out analysis, the pooled AUC ranged from 0.76 to 0.79 (Figure S2 in the Supplementary File). When the median-performing model of each study replaced the best-performing model, the pooled AUC decreased to 0.74 (0.65 - 0.81), suggesting model-selection optimism of about 0.04. Studies that were not at high risk of bias in the analysis domain (k = 3) yielded a pooled AUC of 0.79 (0.41 - 0.95), an estimate too imprecise to be informative.
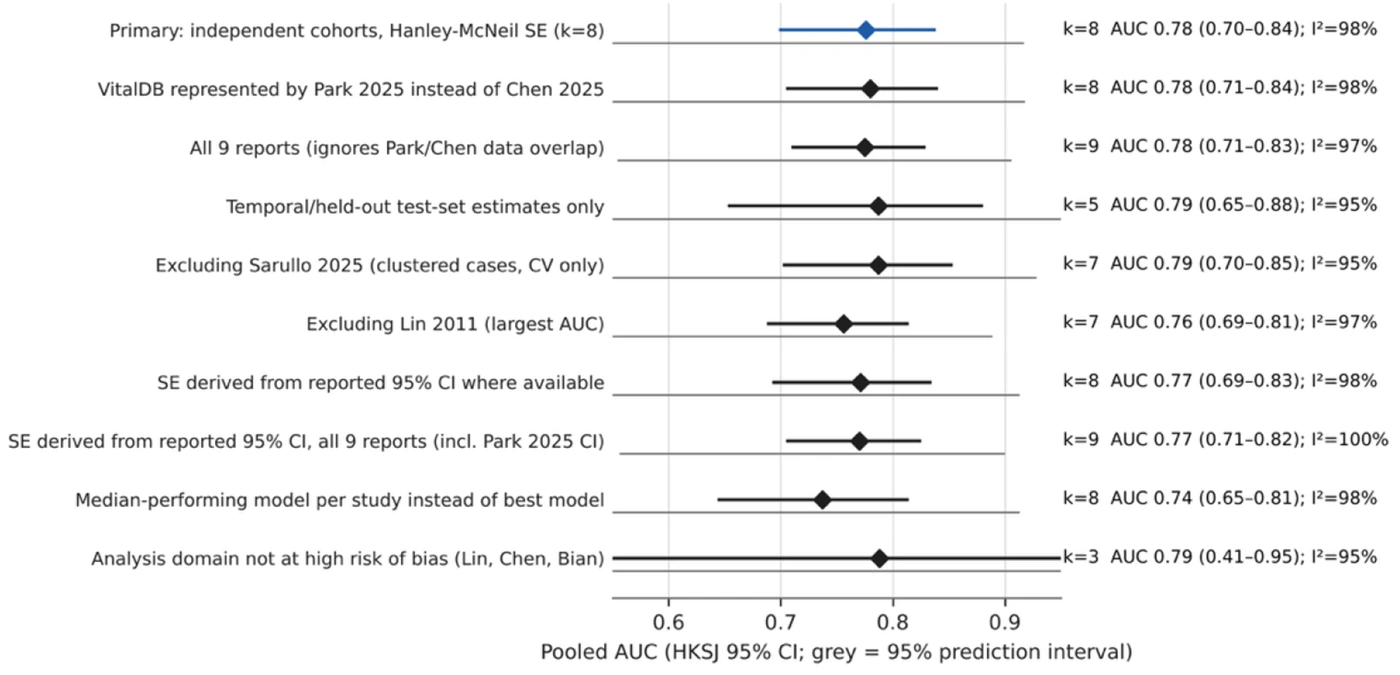
Figure 3.
Pooled area under the receiver operating characteristic curve (AUC) under the primary analysis and each sensitivity analysis (Hartung-Knapp-Sidik-Jonkman 95% confidence intervals; gray bars, 95% prediction intervals). k, number of independent estimates; I2, proportion of total variability due to between-study heterogeneity (4, 11, 42, 43, 45).
When standard errors were derived from the reported CIs, heterogeneity was extreme (Q = 3,082, I2 = 99.9% when all nine reports were included). This was driven almost entirely by the CI reported by Park et al. (0.771 - 0.774), which is implausibly narrow for a test set of 1,101 patients; the Hanley-McNeil CI for that estimate is 0.744 - 0.798. Heterogeneity nevertheless remained substantial when consistent standard errors were used, reflecting genuine clinical and methodological differences between studies.
3.6. Meta-Analysis of Sensitivity and Specificity
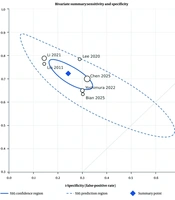
Sensitivity and specificity from the same model and evaluation set were available for six independent cohorts; specificity was derived for two reports (11, 44). The bivariate model yielded a summary sensitivity of 0.72 (95% CI 0.67 - 0.77) and specificity of 0.76 (95% CI 0.68 - 0.82), corresponding to a positive likelihood ratio of 2.99, a negative likelihood ratio of 0.37, and a diagnostic odds ratio of 8.2 (95% CI 4.4 - 15.1) (Figures 4 and 5). Between-study variance was larger for specificity (τ2 = 0.216) than for sensitivity (τ2 = 0.079), and the 95% prediction region was wide. The estimated between-study correlation was positive and close to its boundary, indicating that studies with higher sensitivity also tended to have higher specificity, consistent with differences in discrimination rather than differences in threshold. However, with six studies, this correlation was poorly determined; therefore, a summary receiver operating characteristic curve was not drawn. Results were similar when only directly reported pairs were analyzed (sensitivity 0.71 [0.65 - 0.77]; specificity 0.77 [0.68 - 0.84]; k = 5) and when the alternative overlapping reports were used (0.73 [0.67 - 0.78]; 0.77 [0.70 - 0.83]) (Table S7 in the Supplementary File).
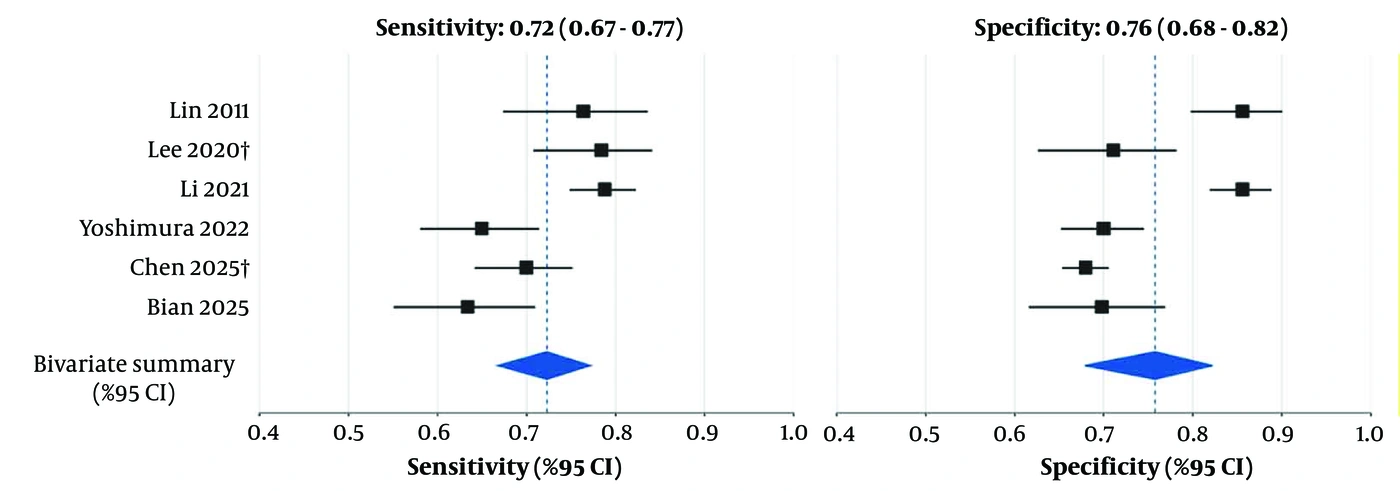
Figure 4.
Paired forest plots of sensitivity and specificity of the selected model of each independent cohort. Study estimates are shown with Wilson 95% confidence intervals (CIs); diamonds show bivariate random-effects summary estimates with 95% CIs. †Specificity derived from the reported precision, recall, and prevalence (11, 20, 41, 43-45).
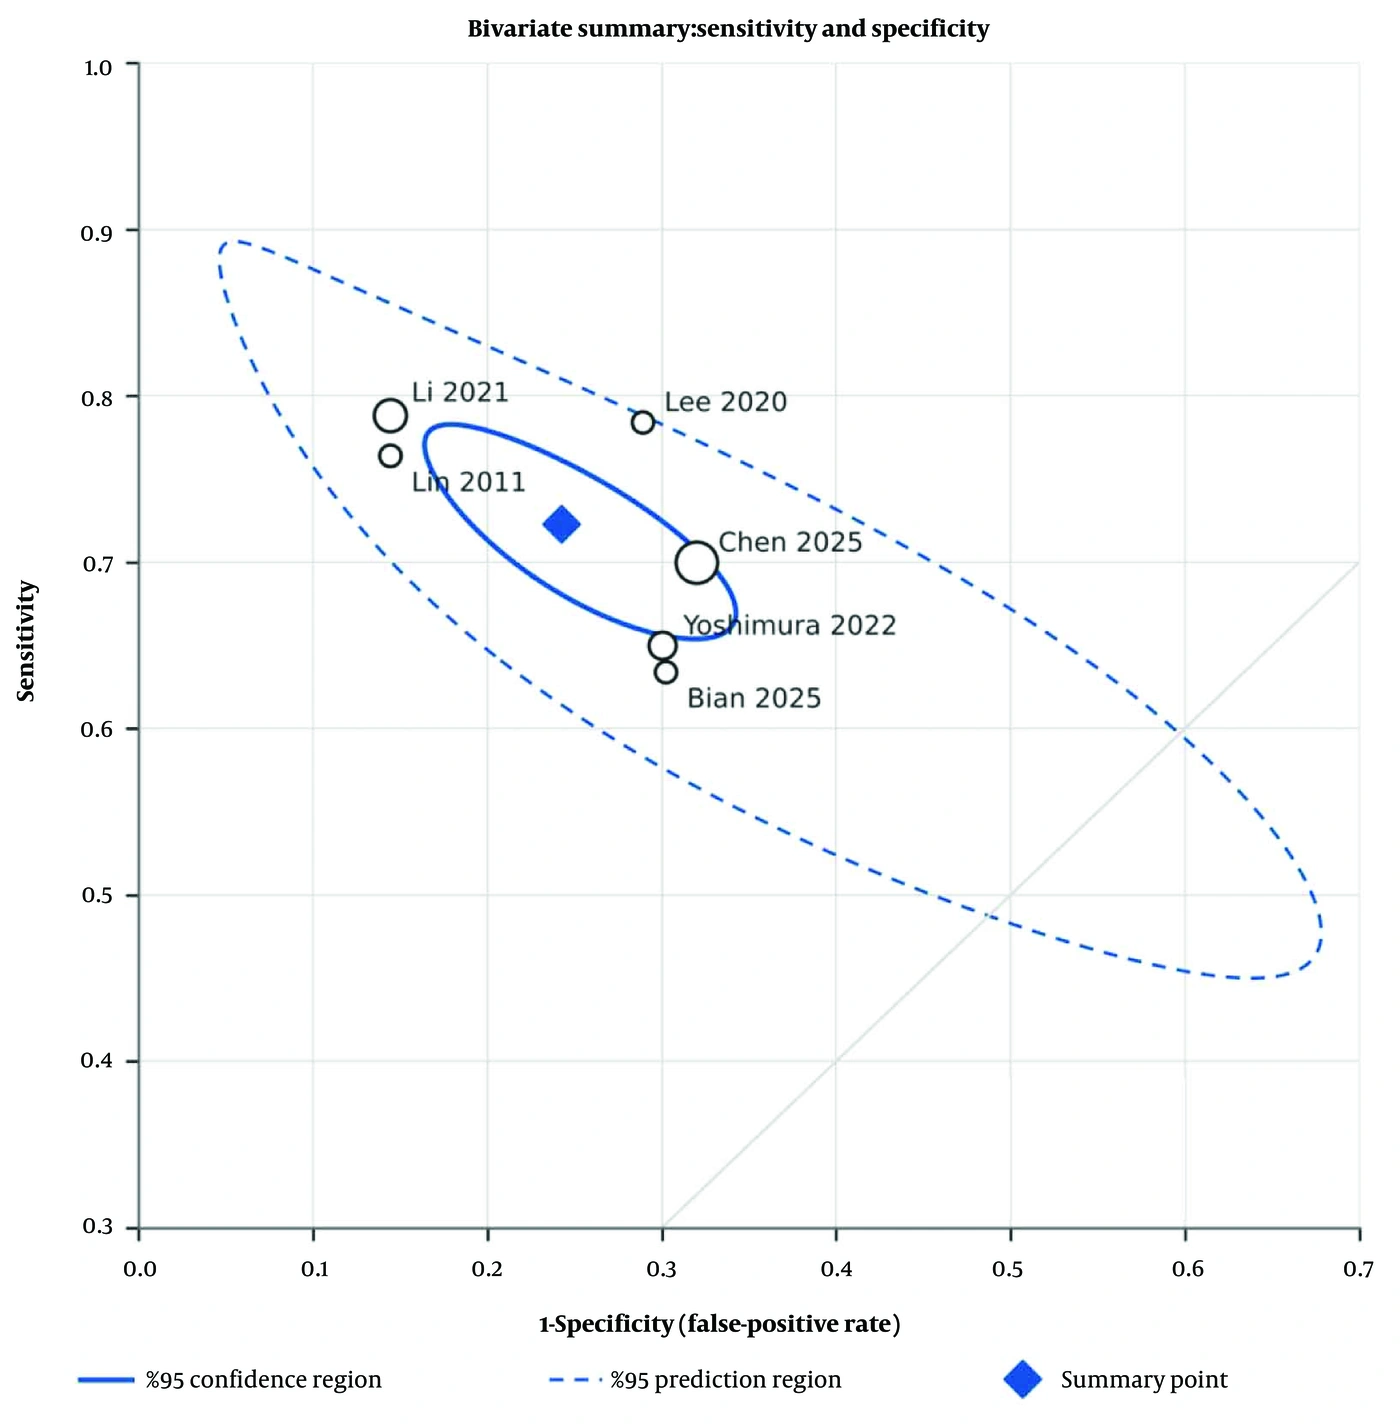
Figure 5.
Bivariate summary of sensitivity and specificity in receiver operating characteristic space, with study estimates (circle size proportional to the size of the evaluation set), the summary point, its 95% confidence region, and the 95% prediction region.
In secondary univariate analyses, pooling yielded a sensitivity of 0.73 (95% CI 0.67 - 0.78; 95% PI 0.56 - 0.85; I2 = 80.8%; k = 7, including one study that reported sensitivity only (21)) and a specificity of 0.76 (0.65 - 0.84; 95% PI 0.43 - 0.93; I2 = 93.1%; k = 6). Most studies did not report how the classification threshold was selected; therefore, these accuracy measures refer to different, mostly unreported operating points.
At the summary sensitivity and specificity, the positive predictive value would be 0.25 and the negative predictive value would be 0.96 at a PIH prevalence of 10%, 0.56 and 0.86 at 30%, and 0.75 and 0.73 at 50% (Table S8 in the Supplementary File). At a prevalence of 30%, applying such a model to 1,000 patients would flag 386 as high risk, of whom 169 would not develop PIH, while 83 patients who would develop PIH would be missed.
3.7. Exploration of Heterogeneity
Exploratory meta-regression analyses are shown in Figure S1 and Table S9 in the Supplementary File. Pooled AUCs did not differ significantly by model family (neural network, 0.82, k = 2; tree-based, 0.78, k = 4; regression-based, 0.73, k = 2; Knapp-Hartung P = 0.59), validation type (P = 0.84), or predictor-timing tier (P = 0.38). The three tier 1 models, which used only pre-induction information, had a pooled AUC of 0.73 (95% CI, 0.67 - 0.78) without detectable heterogeneity. AUCs differed by PIH definition (P < 0.01): 0.85 (0.77 - 0.91) for composites based on SBP below 90 mm Hg (k = 3), 0.73 (0.70 - 0.77) for MAP below 55 mm Hg (k = 3), and 0.70 for MAP at or below 65 mm Hg (k = 2). Because each subgroup contained two or three studies and definition was confounded with population, sample size, and validation design, these differences should be regarded as hypotheses rather than as effects of the outcome definition itself.
In the seven studies that compared several models using the same data, the AUC of the best model exceeded that of the median model by 0.003 to 0.160 (median, 0.026). Where a logistic regression or other linear comparator was evaluated, the AUC of the best ML model exceeded that of the comparator by 0.053 to 0.160 in five studies (4, 21, 22, 41, 43), whereas logistic regression was itself the best model in one study (11). The largest difference in AUC, 0.160, occurred in a study in which three of four algorithms performed close to chance (41) (Table S10 in the Supplementary File).
4. Discussion
In this systematic review of ten reports from eight independent cohorts, the selected ML models discriminated between patients with and without PIH, with a pooled AUC of 0.78, a summary sensitivity of 0.72, and a summary specificity of 0.76. These averages conceal substantial between-study differences: the 95% prediction interval for the AUC in a new setting ranged from 0.52 to 0.92. No model had been validated at a different institution, calibration was reported for only three models, all but one study were at high risk of bias, and the pooled AUC decreased when the median rather than the best model from each study was analyzed. The available evidence therefore shows that ML models can achieve moderate discrimination for PIH in the data from which they were derived, but it does not show that any model is ready for clinical use.
4.1. Comparison with Previous Reviews
Earlier reviews addressed intraoperative hypotension in general. Mohammadi et al. reported an area under the receiver operating characteristic curve of 0.79 for AI models other than the Hypotension Prediction Index across prediction targets ranging from waveform forecasting minutes ahead to post-induction risk, with I2 of 99% (23), whereas Mehta et al. synthesized ML-augmented interventions, including trials of Hypotension Prediction Index-guided management, rather than prediction accuracy (24). Narrative reviews have emphasized heterogeneous definitions, uncertain effects on patient outcomes, and the need for external validation and calibration before implementation (46, 47). After our search date, Meng et al. published a review of PIH prediction models that included conventional regression models, pooled the AUC of 17 models (0.81; I2 = 98.6%), and rated most studies as having a high risk of bias (25). Table 3 compares these reviews with ours. Our review differs in four respects: it is restricted to ML models for PIH in adults and links overlapping cohorts so that participants are not counted twice; it uses a consistent standard error for every AUC, showing that near-100% I2 values obtained by directly pooling reported CIs can be largely a statistical artifact; it jointly pools sensitivity and specificity and translates them into predictive values; and it examines predictor timing, threshold-selection methods, calibration, and the optimism of best-model selection. The convergence of our pooled AUC with those of earlier reviews indicates that the discrimination reported in this literature is consistently moderate, whereas our additional analyses indicate that this estimate is optimistic and has limited transportability.
4.2. Interpretation of Heterogeneity
Some of the extreme heterogeneity that arises when reported CIs are pooled directly is artifactual. Implausibly narrow CIs reported by individual studies, such as those derived from repeated cross-validation folds rather than from patients, inflate Q and I2 without reflecting real differences in performance. After uncertainty was standardized, substantial heterogeneity remained, and this heterogeneity is clinically plausible. The studies differed in population (laparoscopic cholecystectomy under total intravenous anesthesia, cardiac surgery, older patients, and mixed surgical cohorts), PIH definition and window, measurement frequency (noninvasive readings at one- to five-minute intervals versus continuous arterial readings), predictor sets (from five clinical variables to more than 40 echocardiographic or electronic health record features), and validation design. These differences mean that the studies addressed related but not identical prediction tasks. We therefore regard the pooled AUC as a description of average reported performance, not as a transportable estimate for a specific setting; the prediction interval is more relevant to a clinician considering local use. The higher AUCs observed with SBP-based composite definitions probably reflect the populations and designs of those studies (smaller single-procedure or cardiac cohorts with high event rates and internal validation) as much as the definition itself.
4.3. Prediction of Future Hypotension Versus Detection of Developing Hypotension
The clinical value of a PIH model depends on when it can be used. Models based only on pre-induction information could inform the choice of induction strategy, vasopressor preparation, or monitoring, whereas models using blood pressure recorded after induction begins forecast hypotension over a horizon of only a few minutes and partly detect a decline that has already begun. In one study, predictors were recorded until tracheal intubation within an outcome window that began at induction (4); in others, drug doses or medications recorded within the outcome window were used as predictors (20, 42). Such features improve apparent discrimination but reduce the lead time for intervention and can introduce information leakage. The tier 1 models had the most consistent discrimination but also the lowest pooled AUC (0.73), which probably represents a realistic estimate of what pre-induction data alone can achieve. Future studies should define the moment of prediction explicitly and measure predictors strictly before the outcome window begins.
4.4. Validation, Optimism, and Model Family
No model was validated at a different institution, and the two temporal validations were performed at the development centers (43, 45). Several studies used repeated cross-validation in small samples with extensive data-driven feature selection (for example, 126 events and 89 candidate features (22)), which is likely to overestimate performance. Reporting only the best of several algorithms adds further optimism: within studies, the best model exceeded the median model by a median of 0.026 in AUC, and the pooled AUC was 0.04 lower when median models were analyzed. Because algorithm choice was confounded with population, outcome definition, and validation design, between-study comparisons cannot establish that one model family is superior; therefore, we draw no conclusion about the relative performance of algorithm families. Within studies, ML models usually, but not always, outperformed logistic regression, and the largest gains occurred where the comparator performed poorly (11, 41). Multicenter development with geographically external validation, prespecified model selection, and comparison with a well-specified regression model are needed.
4.5. Calibration and Clinical Utility
Discrimination alone does not establish a model’s utility. A model may rank patients correctly yet systematically overestimate or underestimate absolute risk, and miscalibrated predictions can lead to unnecessary vasopressor use or false reassurance (48). Calibration was reported for only three models, using calibration curves, the Hosmer-Lemeshow test, or Brier scores (11, 43, 45); no study examined calibration in an external population, where miscalibration is most likely. Several models were trained on artificially balanced data, which can distort predicted probabilities unless the models are recalibrated (4). Decision-curve analysis, which weighs true positives against false positives at clinically relevant risk thresholds (49), was reported in three studies (11, 41, 45). The predictive values in our analysis illustrate the practical consequences: at a prevalence of 30%, almost half of patients flagged as high risk would not develop PIH. Whether this proportion of false positives is acceptable depends on the intended action. Low-risk actions, such as preparing a vasopressor or measuring blood pressure more frequently, may tolerate many false positives, whereas changing the induction regimen or inserting an arterial line requires a higher positive predictive value. Missed cases are more clinically important when hypotension is prolonged or occurs in patients with limited organ reserve, for whom individualized blood pressure targets have been advocated (50). Finally, no study tested whether model-guided care reduces the duration of hypotension, myocardial injury, acute kidney injury, or mortality.
4.6. Contextual Studies Not Included in the Review
Several related studies did not meet the eligibility criteria and are cited only as context. Hartmann et al. developed a logistic regression model for hypotension after spinal anesthesia using automated recordkeeping (51). Another study used a bidirectional recurrent neural network to forecast blood pressure three minutes in advance during induction; blood pressure was treated as a continuous rather than a binary outcome, and the mean absolute error for SBP was about 11 mm Hg (52). Kho et al. trained a random forest classifier to reproduce expert judgments of post-induction hemodynamic instability, an outcome that differs from threshold-based PIH (10). Kendale et al. reported a gradient boosting model for PIH in a cohort that included patients older than 12 years, with a test-set AUC of 0.74 (40), a value within the range of the included studies. These studies illustrate developments that the included literature has not yet adopted, namely time-series models that update predictions as data accrue and clinically grounded definitions of hemodynamic instability. Most included models used static, single-time-point features, whereas PIH is a dynamic process.
4.7. Strengths and Limitations
The strengths of this review include its focus on a defined prediction task, verification of all extracted data against the full texts, linkage of overlapping cohorts, consistent handling of uncertainty, bivariate pooling of sensitivity and specificity, prediction intervals, a signaling-question-level assessment of risk of bias, and provision of the analysis dataset and code. Its limitations are considerable. First, heterogeneity was substantial for all measures, and the pooled estimates should not be interpreted as transportable performance values. Second, the evidence base is small (eight independent cohorts for the AUC and six for sensitivity and specificity), which limits the precision of the pooled estimates, the power of subgroup analyses, and the estimation of the bivariate correlation; this also precluded formal assessment of small-study effects. Third, nine of ten reports were at high risk of bias, so the prespecified sensitivity analysis restricted to studies at low risk of bias could not be performed. Fourth, no study performed geographic external validation, and most relied on internal validation, which probably makes the pooled estimates optimistic. Fifth, calibration, clinical utility, and patient outcomes were rarely or never reported. Sixth, most models used static rather than time-dependent data, and the prediction horizon and timing of predictors differed. Seventh, some inputs were derived (specificity in two studies and event counts in the evaluation set in four), and multiple cases from the same patient were analyzed as independent observations in the largest cohort. Finally, the search was limited to four databases and English-language publications, was not updated after 4 October 2025, and the protocol was not registered; reports published since then, including those identified by a more recent review (25), are therefore not included.
4.8. Conclusions
Machine learning models for predicting PIH show moderate discrimination in internal and temporal validation, with a pooled AUC of about 0.78 and summary sensitivity and specificity of about 0.72 and 0.76, respectively. Performance in a new setting remains highly uncertain; the evidence is predominantly at high risk of bias, calibration and clinical utility are rarely assessed, and several models rely on information recorded after induction has begun. The available data do not show that any model family is superior or that any model is ready for routine clinical use. Future studies should prespecify the time of prediction and the outcome definition, use predictors available before the outcome window, perform multicenter external validation with calibration and decision-curve analysis, report according to TRIPOD+AI (29), and assess in prospective impact studies whether model-guided care reduces hypotension and patient-relevant complications.