


1. Background
2. Objectives
3. Methods
3.1. Prepration of Acellular Scaffolds
3.2. Platelet-Rich Fibrin Preparation
3.3. Cell Culture
3.4. Loading the Different Combination of Stem Cells Derived Cord Blood and Platelet Rich Fibrin on Acellular Scaffolds
3.5. Preparation of Animal and Histology
3.6. Analysis of Real time Polymerase Chain Reaction (PCR)
3.7. Statistical Analysis
4. Results
4.1. Acellular Scaffolds and Isolation of Stem Cells Derived Cord Blood and Platelet Rich Fibrin
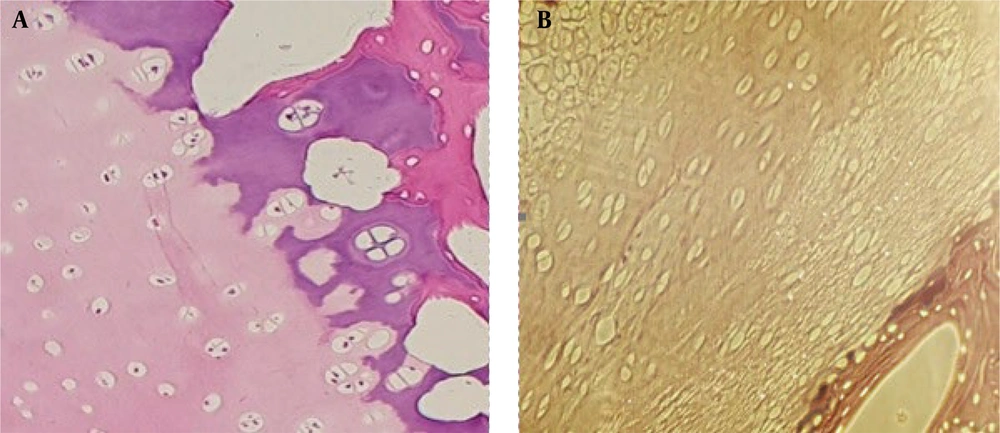
Osteochondral fragments. A, the cellular; and B, acellular
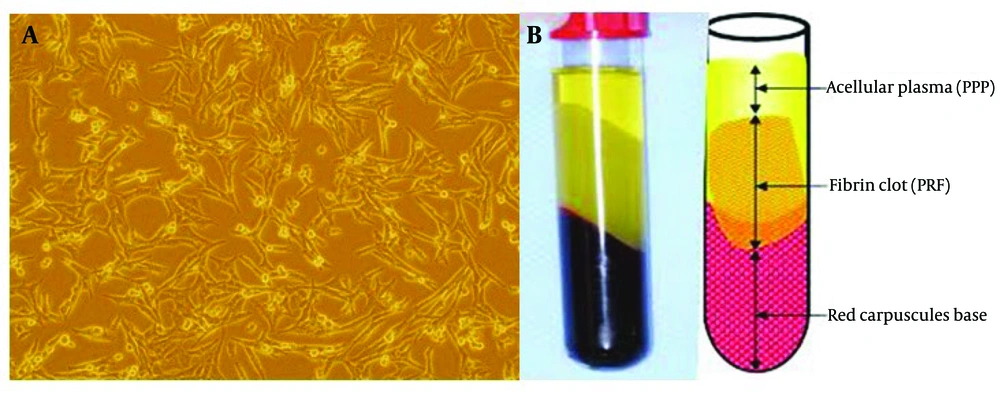
A, stem cells derived cord blood; and B, platelet Rich Fibrin
4.2. Histopathological and Radiological Analysis
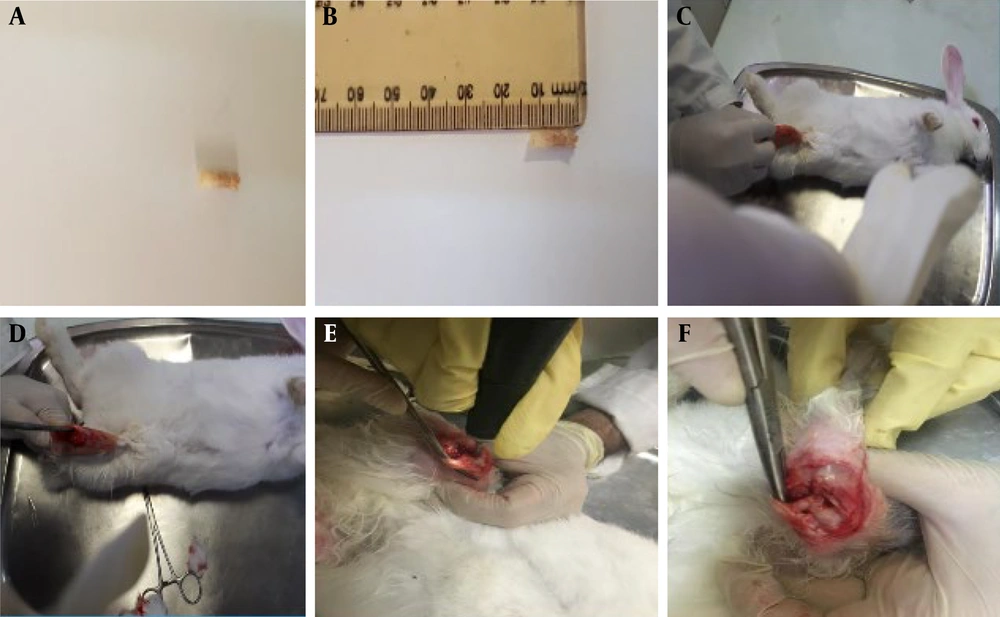
A and B, acellular scaffold; C and D, cutting the skin; E, cutting the muscle; F, implantation of scaffold.
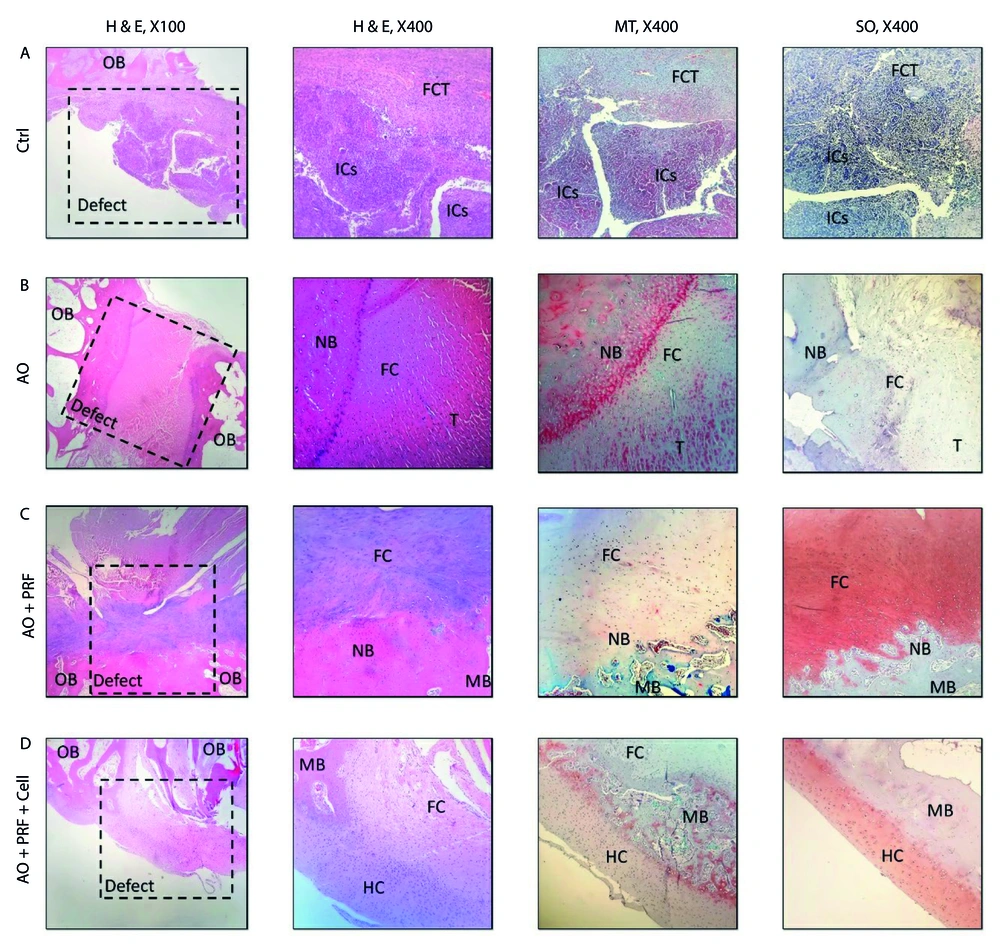
The findings of Histopathological in defect of osteochondral in the experimental groups. A, in the control group (untreated), the area of osteochondral defect was completely replaced with fibrous connective tissue (FCT) and the accumulation of inflammatory cells (ICs) was evident; B, in Acellular Osteochondral graft, the implanted graft completely filled by two types of tissue: Neo-bone and immature fibrocartilage (SO staining); C, the osteochondral defect in OA + PRF treated group showed new bone and cartilage formation, however, the amount of cartilaginous tissue was significantly higher than normal tissue; D, the maturation of new bone in OA + PRF + cell treated animals was significantly higher than other treatment groups. In addition, the thickness of the cartilage layer was normal. OB: Old Bone, NB: New Bone formation, ICs: Inflammatory Cells. FC: Fibrocartilage, HC: Hyaline cartilage, FCT: Fibrous Connective Tissue, T: Tendon-like tissue, MB: Mature bone.
a Values indicates treatment group versus negative control group (C-).
b Values are expressed as mean ± SD.
c P < 0.01.
d P < 0.001.
e P < 0.05.
| Groups | New Cartilage Tissue (%) | New Bone Formation (%) |
|---|---|---|
| Ctrl | 0 A | 1.6 ± 1.1 A |
| AO | 10.3 ± 2.5 B | 18 ± 2 B |
| AO + PRF | 43 ± 4.3 C | 45.3 ± 5.1 C |
| AO + PRF + Cell | 48 ± 5 C | 32 ± 3.6 C |
a Different letters indicate significant differences between the treatment group.
b Values are expressed as mean ± SD.
4.3. Chondrogenic Gene Expression Assessment by Real time PCR
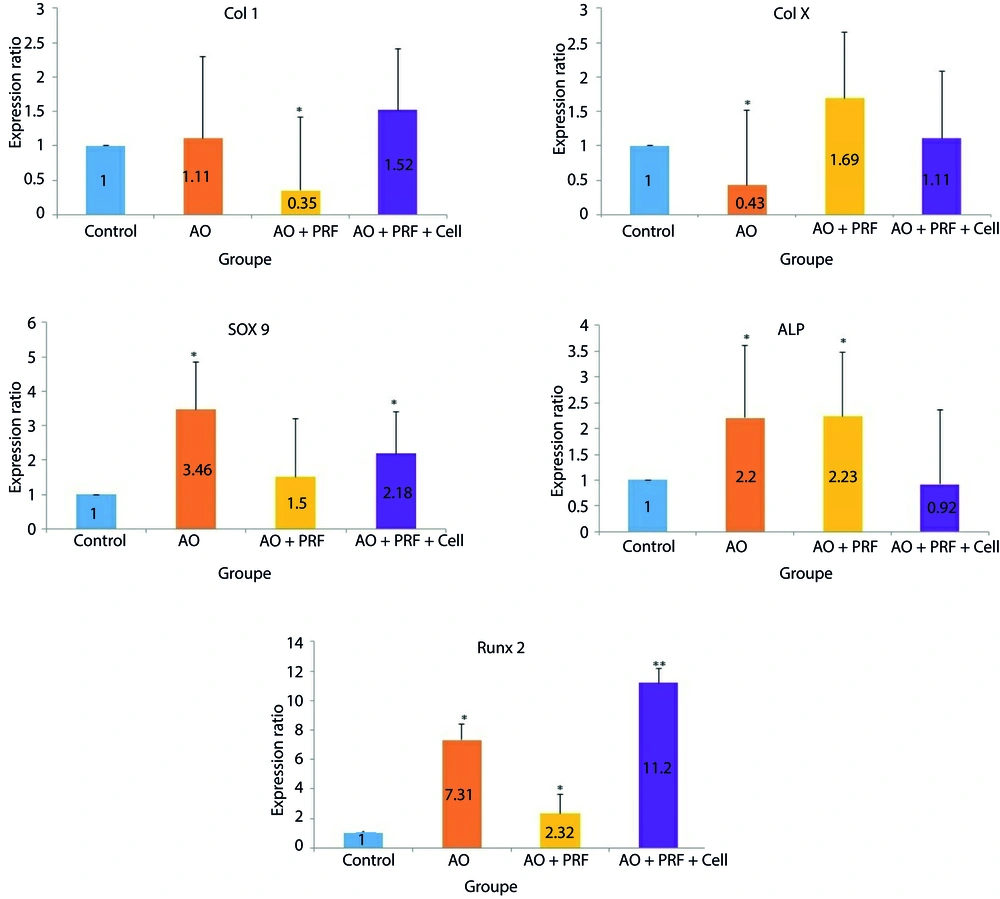
The graphs show the expression of Col 1, Col X, SOX9, ALP and Runx 2 in 3 groups (AO (acellular osteochondral), AO + PRF (acellular osteochondral + platelet rich fibrin) and AO + PRF + cell (acellular osteochondral +stem cells derived cord blood/ platelet rich fibrin)) compared with the control group. Overall, the expression of Col 1 in AO + PRF group, Col X in AO group, SOX9 in AO and AO + PRF + Cell group, ALP in AO and AO + PRF group and Runx2 in all group have shown significant difference compared with Control group. Data are determined as means ± SD; *P < 0.05; **P < 0.01.

