Arch Neurosci

Image Credit:Arch Neurosci

Machine Learning Approaches to Influential ROI Selection in Parkinson’s Disease: A Comparative Analysis of LASSO, Recursive Feature Elimination, and Random Forest

Author(s):
Keyvan OlazadehKeyvan OlazadehKeyvan Olazadeh ORCID1, 2, Nasrin BorumandniaNasrin BorumandniaNasrin Borumandnia ORCID3, Hamid Alavi MajdHamid Alavi MajdHamid Alavi Majd ORCID1,*
1Proteomics Research Center, Department of Biostatistics, School of Allied Medical Sciences, Shahid Beheshti University of Medical Sciences, Tehran, Iran
2Research Center for Social Determinants of Health, Research Institute for Endocrine Sciences, Shahid Beheshti University of Medical Sciences, Tehran, Iran
3Department of Epidemiology and Biostatistics, Faculty of Medicine, TMS.C., Islamic Azad University, Tehran, Iran

Archives of Neuroscience:Vol. 12, issue 4; e165741
Published online:Oct 31, 2025
Article type:Research Article
Received:Aug 13, 2025
Accepted:Oct 28, 2025
How to Cite:Olazadeh K, Borumandnia N, Alavi Majd H. Machine Learning Approaches to Influential ROI Selection in Parkinson’s Disease: A Comparative Analysis of LASSO, Recursive Feature Elimination, and Random Forest. Arch Neurosci. 2025;12(4):e165741. doi: https://doi.org/10.5812/ans-165741

Abstract

Background:

Identifying key brain regions implicated in Parkinson’s disease (PD) can enhance both diagnostic accuracy and our understanding of disease mechanisms.

Objectives:

This study aims to compare three machine learning methods — least absolute shrinkage and selection operator (LASSO), random forest (RF), and recursive feature elimination (RFE) — for selecting influential regions of interest (ROIs) from functional magnetic resonance imaging (fMRI) data to distinguish PD patients from healthy controls.

Methods:

This retrospective analysis used fMRI data from 15 patients with PD and 15 matched healthy controls, sourced from an open-access database. Three machine learning approaches were applied to identify significant ROIs associated with PD. The selected ROIs were subsequently evaluated using logistic regression models, assessing classification performance through area under the curve (AUC), sensitivity, and specificity. A comparative analysis of model performance was conducted using DeLong’s test.

Results:

The LASSO identified 9 ROIs, RF selected 10, and RFE identified 4 key ROIs. Logistic regression models constructed with these ROIs yielded AUC values of 0.96, 0.94, and 0.88 for LASSO, RF, and RFE, respectively. Both sensitivity and specificity were highest for LASSO (0.92 for both). DeLong’s test revealed statistically significant differences among the methods (P < 0.001), with LASSO outperforming RF and RFE.

Conclusions:

This study demonstrates that LASSO, RFE, and RF machine learning techniques are promising for identifying key brain regions, showing preliminary alignment with clinical observations. Focusing on patients with PD, it highlights regions associated with executive function, memory, motor skills, and sensory processing. Early detection of abnormal connectivity in these areas may potentially inform exploratory preventive strategies for PD.

1. Background

Machine learning techniques have gained substantial traction in neuroscience in recent years, proving invaluable for extracting meaningful insights from complex brain imaging data. Among neuroimaging modalities, functional magnetic resonance imaging (fMRI) stands out for its ability to measure brain activity via blood-oxygen-level-dependent (BOLD) signals, offering high spatial resolution and enabling detailed analyses of functional connectivity across distinct regions of interest (ROIs) (1, 2).
Functional connectivity refers to statistical correlations between the activities of different brain regions, forming intricate networks known as “connectomes” that underlie brain function. Analyses of functional connectivity using fMRI have been instrumental in identifying key brain networks essential for cognitive processes and behaviors, thereby enhancing our understanding of the brain as an integrated system. This approach has also uncovered disrupted connectivity patterns in conditions such as Alzheimer’s disease, schizophrenia, depression, and autism, which has aided in early diagnosis, treatment monitoring, and the development of targeted interventions. Comparing functional connectivity between healthy individuals and those with neurological disorders such as Parkinson’s disease (PD), or among groups taking specific medications versus those not, provides insights into neural mechanisms and disease progression, ultimately informing diagnostic and therapeutic strategies (3-5).
In recent years, numerous models have been developed to explore differences in functional communication between various patient groups and healthy individuals using fMRI data. Despite these advances, many models face challenges in determining the optimal number of ROIs. Including excessive ROIs can make functional connectivity analyses computationally intensive and difficult to interpret (6, 7). Two potential solutions to this challenge are:
1. Modifying models to accommodate a greater number of ROIs, which can compromise interpretability and significantly increase computational burden.
2. Employing statistical or machine learning methods to identify and select only the most relevant ROIs, enabling a more efficient and streamlined analysis (8).
A prominent approach in neuroscience research involves applying machine learning for feature selection, which isolates essential ROIs to enhance model performance. This process improves interpretability, reduces overfitting, and increases computational efficiency by focusing on key features while discarding irrelevant ones. Feature selection methods are generally categorized as filter methods (statistical tests), wrapper methods (performance-based selection), and embedded methods (integrated within algorithms). In contrast, feature extraction transforms original features into new, compact representations using techniques such as principal component analysis (PCA) or independent component analysis (ICA). While feature selection works with existing features, feature extraction creates composite variables that uncover latent patterns and reduce dimensionality (9).
Both traditional and deep learning techniques have been employed for feature selection. Support vector machines (SVMs) are effective but limited by their shallow architecture, whereas deep learning models — such as stacked autoencoders (SAEs) and convolutional neural networks (CNNs) — can capture more complex patterns and identify features at multiple hierarchical levels (10-12).
This study focuses on leveraging machine learning-based feature selection techniques to pinpoint the most informative ROIs for distinguishing patients with PD from healthy individuals. The objective is to identify the method that most effectively isolates disease-related brain regions within the dataset, thereby improving both classification and interpretability. Using functional MRI data from individuals with PD and healthy controls, we evaluate three distinct feature selection methods — least absolute shrinkage and selection operator (LASSO), random forest (RF), and recursive feature elimination (RFE) — selected for their complementary strengths. The LASSO is included for its regularization capabilities in high-dimensional fMRI data, RF for its ability to capture non-linear interactions within brain networks, and RFE for its iterative optimization tailored to neurological disorders such as PD.
Despite advances in fMRI-based research on PD, a notable gap remains in comparative evaluations of feature selection techniques for ROI identification. Previous studies often rely on single methods or clinician-driven selections, potentially overlooking the advantages of direct comparisons across methods, especially in small cohorts.

2. Objectives

This research addresses this gap by comparing LASSO, RF, and RFE to identify optimal ROIs for PD classification. By enhancing both interpretability and efficiency in neuroimaging analysis, this study contributes to a deeper understanding of machine learning applications in neurological disorder research.

3. Methods

3.1. Dataset Description

Data were obtained from patients with PD and healthy controls available through the open fMRI database (accession number: 000245ds). The dataset included resting-state images from 15 Parkinson's patients and 15 healthy controls, randomly selected. Data collection was conducted by Yoneyama et al. at Nagoya University of Medical Sciences, Japan. The Parkinson's group included 6 men and 9 women, while the control group comprised 7 men and 8 women. Parkinson's patients, aged 55 to 75 years, were diagnosed according to UK Brain Bank criteria and referred by Nagoya University's Department of Neurology. All patients were diagnosed with PD after the age of 40. Written informed consent was obtained from all participants, and the study was approved by Nagoya University's Ethics Committee. Preprocessing of the dataset included temporal correction, motion correction, alignment, normalization, and spatial smoothing (12).

3.2. Machine Learning and Statistical Approaches

Three machine learning techniques were explored to identify the most significant ROIs associated with PD: The LASSO, RF, and RFE. The ROIs selected by these methods were subsequently incorporated into logistic regression models to assess the predictive capabilities of the selected features. Brief descriptions of each method are provided below.

3.2.1. Least Absolute Shrinkage and Selection Operator

The LASSO is a powerful tool for feature selection and regularization. It applies an L1 penalty alongside the L2 loss function, shrinking the coefficients of irrelevant variables to zero and effectively removing unnecessary variables from the model. Consider a regression model structured as follows: y = Xβ + ε.
In this context, y represents the response vector, X denotes the design matrix with columns corresponding to the predictor variables, β stands for the regression coefficient vector, and ε signifies the error term. When dealing with a large number of predictor variables, the LASSO feature selection method is particularly useful. By employing the following model, LASSO effectively shrinks the coefficients of irrelevant variables to zero, thereby simplifying the model and reducing its dimensionality:
For further information on the LASSO method, refer to Chen et al. (13).

3.2.2. Random Forest

The RF method is an ensemble technique that uses multiple decision tree classifiers. At each decision node, the algorithm selects a feature and threshold that best separates the classes. To reduce dimensionality, RF employs the Gini impurity (GI) criterion, which measures the degree of class separation achieved by a feature and its threshold. The GI Index, calculated using a defined formula, was used to rank features by predictive significance in this study:
For further information on the RF methodology, refer to Venkataraman et al. (14).

3.2.3. Recursive Feature Elimination

The RFE is a widely used feature selection method that iteratively removes the least important features until only the most relevant remain. The RFE can be applied with various machine learning models that prioritize significant features. In this study, the RF algorithm was used as the base model for RFE, with key features selected based on estimated coefficient values. Additional details on the RFE methodology are described by Akbarifar et al. (15).
Data preprocessing was performed using FSL version 6.0.1. The processed data were subsequently imported into MATLAB 2019, utilizing SPM version 12, the WFU-Pickatlas module, and the AAL116 atlas to segment the brain into 116 distinct regions. Model implementation was carried out in R-Studio (version 2025.05.0-496) using the LASSO, RFE, and RF approaches. Specific R packages facilitated these analyses: The caret package for RFE modeling, glmnet for LASSO modeling, and random forest for RF modeling. Visualization tasks were supported by the dplyr, ggplot2, and pROC packages. To assess overfitting, permutation testing (n = 100 iterations) was conducted by shuffling response labels and re-fitting the models; original areas under the curve (AUCs) significantly exceeded those from permuted data (P < 0.01). Statistical significance was assessed at the 95% confidence level.

4. Results

4.1. Demographic and Clinical Characteristics

The study included 15 patients with PD and 15 healthy controls, matched for demographic comparability. Both groups were similar in age (patients: 64.4 ± 7.2 years; controls: 63.3 ± 5.2 years; P = 0.652) and sex distribution (patients: 40% male, 60% female; controls: 46.6% male, 53.4% female; P = 0.725).

4.2. Machine Learning-Based Region of Interest Selection

Three machine learning techniques — LASSO, RF, and RFE — were used to identify distinct sets of ROIs critical for distinguishing Parkinson's patients from healthy individuals. Table 1 provides a complete list of ROIs selected by these methods, including their full names, abbreviations, and references for interpretation.
Table 1.Complete List of Potential Regions of Interest Identified by Least Absolute Shrinkage and Selection Operator, Random Forest, and Recursive Feature Elimination, Including Names and Abbreviations
Region Number of InterestRegion NameRegion Abbreviation
ROI 4Frontal_Sup_RFSR
ROI 5Frontal_Sup_Orb_LFSOL
ROI 6Frontal_Sup_Orb_RFSOR
ROI 11Frontal_Inf_Oper_LFIOL
ROI 13Frontal_Inf_Tri_LFITL
ROI 18Rolandic_Oper_RROR
ROI 19Supp_Motor_Ar_LSMAR
ROI 33Cingulum_Mid_LCML
ROI 34Cingulum_Mid_RCMR
ROI 35Cingulum_Post_LCPL
ROI 54Occipital_Inf_ROIR
ROI 65Angular_LAL
ROI 80Heschl_RHR
ROI 81Temporal_Sup_LTSL
ROI 85Temporal_Mid_LTML
ROI 105Cerebelum_9_LC9L

Abbreviation: ROI, region of interest.
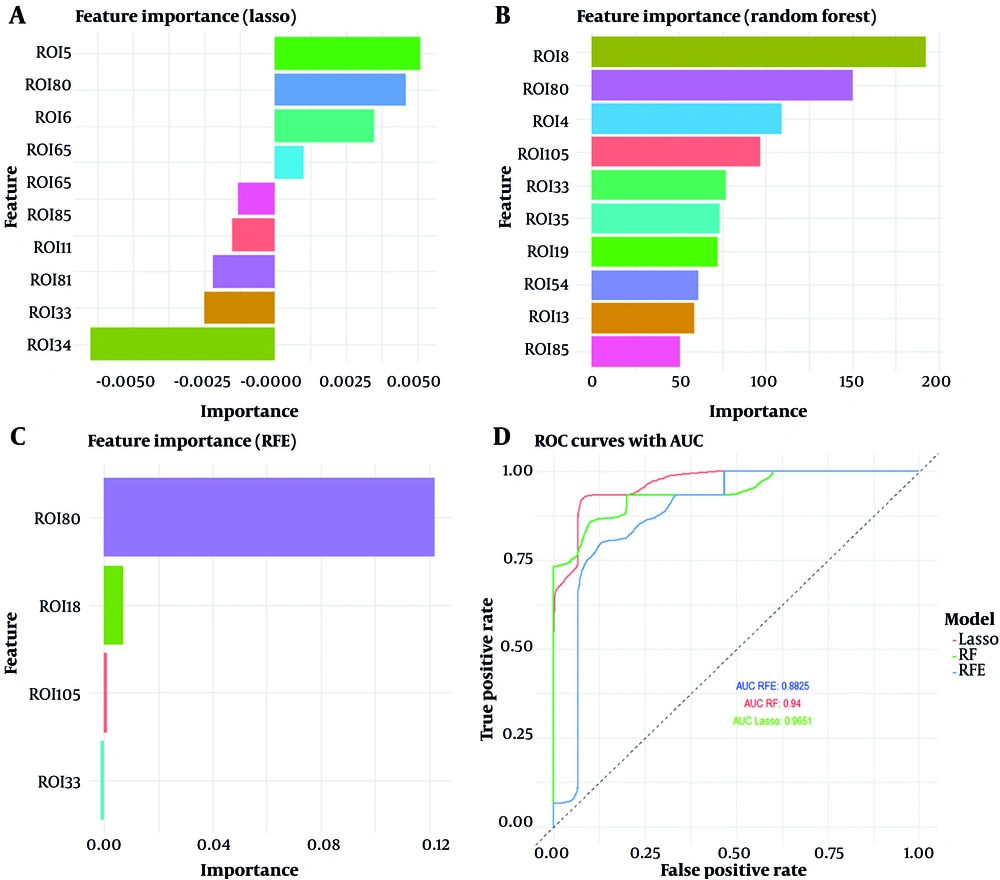
The LASSO method selected nine ROIs, assigning coefficient values to represent their relative importance. Of these, five ROIs had negative coefficients and four had positive coefficients. It is important to note that LASSO coefficients reflect relative importance rather than direct interpretability. Figure 1A visually depicts the coefficients for each ROI, clearly distinguishing positive and negative values.
A, regions of interest (ROIs) selected via the least absolute shrinkage and selection operator (LASSO) method and their coefficient values; B, ROIs identified using the random forest (RF) method and their Mean Decrease Gini Index values; C, ROIs selected through the recursive feature elimination (RFE) method and their coefficient values; D, ROC curves comparing the performance of LASSO, RF, and RFE in classifying Parkinson’s disease (PD) based on functional connectivity.
Figure 1.

A, regions of interest (ROIs) selected via the least absolute shrinkage and selection operator (LASSO) method and their coefficient values; B, ROIs identified using the random forest (RF) method and their Mean Decrease Gini Index values; C, ROIs selected through the recursive feature elimination (RFE) method and their coefficient values; D, ROC curves comparing the performance of LASSO, RF, and RFE in classifying Parkinson’s disease (PD) based on functional connectivity.

The RF method identified ten significant ROIs, with the Mean Decrease Gini Index quantifying their importance in classification. Table 2 lists the Gini Index values derived from RF, which serve as relative indicators of feature importance. Figure 1B highlights the selected ROIs and their contribution to differentiating between Parkinson’s patients and healthy individuals.
Table 2.Region of Interest Selection and Relative Importance Values from Least Absolute Shrinkage and Selection Operator, Random Forest, and Recursive Feature Elimination for Parkinson’s Disease Classification
ROI Number (Abbreviation)LASSO CoefficientRF Mean Decrease GiniRFE Coefficient
ROI 4 (FSR)-109.43-
ROI 5 (FSOL)0.0051--
ROI 6 (FSOR)0.0035--
ROI 11 (FIOL)-0.0025--
ROI 13 (FITL)-58.90-
ROI 18 (ROR)-192.490.0069
ROI 19 (SMAR)-72.11-
ROI 33 (CML)-0.006576.82-0.0001
ROI 34 (CMR)0.0010--
ROI 35 (CPL)-73.45-
ROI 54 (OIR)-61.26-
ROI 65 (AL)0.0046--
ROI 80 (HR)-0.0022150.430.1221
ROI 81 (TSL)-0.0013--
ROI 85 (TML)-0.001550.38-
ROI 105 (C9L)-96.850.0010

Abbreviations: LASSO, least absolute shrinkage and selection operator; RF, random forest; RFE, recursive feature elimination; ROI, region of interest.

The RFE method selected four ROIs, with corresponding coefficient values indicating their importance in separating Parkinson’s patients from healthy controls. These coefficients, like those from LASSO, indicate relative importance. Table 2 details the RFE-derived coefficient values, while Figure 1C visualizes the selected ROIs.
Notably, certain ROIs, such as ROI 33 (CML) and ROI 80 (HR), were consistently identified across multiple methods, underscoring their potential relevance in PD classification. To evaluate the predictive performance of the selected ROIs, logistic regression models were constructed to calculate sensitivity, specificity, and AUC values. Table 3 presents these results, along with Table 4 showing a comparative analysis using DeLong's Test.
Table 3.Predictive Performance of Selected Regions of Interest from Least Absolute Shrinkage and Selection Operator, Random Forest, and Recursive Feature Elimination in Parkinson’s Disease Classification with Comparative Analysis Using DeLong’s Test
Machine Learning MethodAUCSensitivitySpecificity
LASSO0.960.920.92
RF0.940.850.89
RFE0.880.790.87

Abbreviations: AUC, area under the curve; LASSO, least absolute shrinkage and selection operator; RF, random forest; RFE, recursive feature elimination.

Table 4.Comparative Analysis Using DeLong’s Test
ComparisonZ-Score95% Confidence IntervalP-Value a
LASSO and RF-10.92(-0.06, -0.04)< 0.001
LASSO and RFE-10.12(-0.03, -0.02)< 0.001
RF and RFE-16.24(-0.09, -0.07)< 0.001

Abbreviations: LASSO, least absolute shrinkage and selection operator; RF, random forest; RFE, recursive feature elimination.

a Asterisks denote statistical significance (P < 0.05).

The results in Tables 3 and 4 indicate that the LASSO method demonstrates superior predictive power compared to the other two methods in identifying brain regions that distinguish patients from healthy controls based on functional connectivity. This is evidenced by an AUC of 0.96, sensitivity of 0.92, and specificity of 0.92. Furthermore, DeLong's test revealed a statistically significant difference in predictive power between LASSO and both RF and RFE (P < 0.001). Figure 1D illustrates the ROC curves for all three methods, further emphasizing the superior predictive capability of LASSO.

5. Discussion

The primary objective of this study was to use machine learning methods to identify the most significant ROIs associated with PD. Three approaches — LASSO, RFE, and RF — were evaluated. The LASSO identified 9 ROIs, RF selected 10, and RFE pinpointed 4. Comparative analysis revealed that all three methods effectively differentiated patients from healthy individuals. Logistic regression and ROC curve analysis demonstrated that LASSO achieved the highest performance (AUC = 0.96), followed by RF (AUC = 0.94) and RFE (AUC = 0.88). DeLong's test confirmed that LASSO significantly outperformed both RF and RFE. Collectively, the three machine learning methods identified 16 distinct ROIs as crucial for differentiating Parkinson's patients from healthy individuals, corresponding to cognitive domains often impaired in PD. The discussion is organized into two key sections: Clinician-driven ROI selection and data-driven approach.

5.1. Clinician-Driven Region of Interest Selection

Cools investigated the effects of L-DOPA on cognitive function in PD, focusing on working memory. Our research similarly identified ROIs such as C9L and FSR, implicated in working memory impairment. Both studies produced consistent findings, highlighting the effectiveness of machine learning in pinpointing critical ROIs (16, 17). However, whereas Cools (16) relied on clinician judgment, our study employed machine learning for ROI selection.
A study by Postuma et al. demonstrated that PD impacts visual and auditory cognitive functions (18). Our research identified key ROIs such as HR and OIR, involved in these functions and impaired in PD (19, 20). The alignment of findings strengthens the validity of our results. While Postuma et al. (18) used clinical expertise for ROI identification, our approach was data-driven.
Obeso et al. demonstrated that PD impairs executive functions by affecting specific brain regions (21). In our study, C9L emerged as a key ROI influencing executive functions such as planning, decision-making, and language processing (22). Both studies address executive function impairment, but our study used machine learning to identify and prioritize ROIs, whereas Obeso et al. (21) relied on clinical diagnoses.
Braak et al. identified episodic memory impairment as a hallmark of PD (23). Our study highlighted ROIs including CML, TML, and CPL, integral to memory retrieval and self-referential thinking (22, 24, 25). While Braak et al. used clinical diagnoses, our work utilized advanced machine learning. Notably, our results align with Braak et al.'s staging model (23), emphasizing early limbic region involvement in memory impairment, but diverge by highlighting auditory regions such as HR, possibly reflecting dataset-specific connectivity patterns. Due to the small sample size, these alignments should be interpreted cautiously.

5.2. Data-Driven Approaches

Cheng et al. used a 116-region atlas, as in our study, and applied four machine learning models to identify the most significant ROIs for distinguishing PD from progressive supranuclear palsy (26). Logistic regression and SVM outperformed other models, and key regions affected motor, visual, and emotional functions. Our findings were concordant, with regions such as HR, OIR, CML, TML, and CPL implicated in visual, auditory, memory, and emotional functions.
Vicidomini et al. compared the accuracy of four machine learning models in classifying Parkinson's patients with and without gait freezing disorder (27). The RF performed best. Like our study, they used a 116-region atlas and found that ROIs selected by machine learning influenced visual and motor functions, aligning with our results. Table 5 provides a summary of the methods employed in each study discussed.
Table 5.Summary of Methods Employed in Each Study
Study Authors (y)Brain Atlas UsedMethods for Selecting ROIsCognitive Deficit
Cools (16)AAL (116)Clinical diagnosisWorking memory deficits
Postuma et al. (18)AAL (116)Clinical diagnosisVisual processing
Obeso et al. (21)AAL (116)Clinical diagnosisExecutive dysfunction
Braak et al. (23)AAL (116)Clinical diagnosisEpisodic memory impairment
Cheng et al. (26)AAL (116)Machine learning methodsVisual processing
Vicidomini et al. (27)AAL (116)Machine learning methodsVisual processing and executive dysfunction

Abbreviation: ROIs, regions of interest.

Certain ROIs were significant across all three machine learning methods. CML and HR were consistently identified as critical ROIs; ROR and C9L were prominent in both RF and RFE, while TML was significant in both LASSO and RF. CML is crucial for emotional functions (24, 28); HR is essential for auditory functions, including sound recognition and music perception (29); ROR influences facial motor functions (30-32); C9L contributes to working memory, planning, decision-making, and language processing (33, 34); and TML affects semantic memory, language comprehension, and discourse processing (35-37). These findings provide preliminary evidence of the robust performance of machine learning methods in identifying key ROIs related to PD.

5.3. Conclusions

The findings demonstrate that LASSO, RFE, and RF machine learning methods are promising for identifying the most critical ROIs. The selected regions align preliminarily with clinical studies and previous machine learning research, suggesting that, in the context of disease analysis and machine learning in fMRI studies, it is possible to pinpoint brain regions most influential in distinguishing patients from healthy individuals. In PD, the identified regions are associated with executive functions, working memory, memory recall, facial motor skills, and auditory and visual processing — all domains impaired in affected individuals. Consequently, abnormal alterations in the functional connectivity of these regions may contribute to the onset of PD. Early detection of these changes could potentially inform exploratory preventative strategies against disease progression.

5.4. Limitations and Future Directions

A primary limitation of this study is the relatively small sample size (15 patients and 15 controls), which may restrict generalizability. Although high AUC values indicate strong classification performance within this cohort, the results should be interpreted as preliminary. Future research should seek to replicate these methods in larger, multicenter cohorts to validate identified ROIs and enhance external validity. Applying these techniques to larger datasets, such as those from the Parkinson’s progression markers initiative (PPMI), could further test the robustness of these findings across more diverse populations.

Acknowledgments

Footnotes

References

  • 1.
    Teng J, Mi C, Shi J, Li N. Brain disease research based on functional magnetic resonance imaging data and machine learning: A review. Front Neurosci. 2023;17:1227491. [PubMed ID: 37662098]. [PubMed Central ID: PMC10469689]. https://doi.org/10.3389/fnins.2023.1227491.
  • 2.
    Ding J, Dan T, Wei Z, Cho H, Laurienti PJ, Kim WH, et al. Machine Learning on Dynamic Functional Connectivity: Promise, Pitfalls, and Interpretations. arXiv. 2024;Preprint. https://doi.org/10.48550/arXiv.2409.11377.
  • 3.
    Ozay M. Editorial: Novel perspectives and improvements in fMRI functional connectivity analysis methods used to investigate brain networks and cognitive mechanisms in humans. Front Neurosci. 2023;17:1222586. [PubMed ID: 37325039]. [PubMed Central ID: PMC10265644]. https://doi.org/10.3389/fnins.2023.1222586.
  • 4.
    Alarjani MS, Almarri BA. Brain functional connectivity analysis of fMRI-based Alzheimer's disease data. Front Med (Lausanne). 2025;12:1540297. [PubMed ID: 40046917]. [PubMed Central ID: PMC11880024]. https://doi.org/10.3389/fmed.2025.1540297.
  • 5.
    Olazadeh K, Borumandnia N, Khadembashi N, Alavi Majd H. Effect of Modafinil on functional connectivity in healthy young people using resting-state fMRI data. Am J Neurodegener Dis. 2022;11(1):1-9. [PubMed ID: 35600512]. [PubMed Central ID: PMC9123432].
  • 6.
    Grigis A, Gomez C, Frouin V, Duchesnay E, Uhrig L, Jarraya B. Revisiting the standard for modeling functional brain network activity: Application to consciousness. PLoS One. 2024;19(12). e0314598. [PubMed ID: 39680526]. [PubMed Central ID: PMC11649112]. https://doi.org/10.1371/journal.pone.0314598.
  • 7.
    Gonzalez-Castillo J, Fernandez IS, Lam KC, Handwerker DA, Pereira F, Bandettini PA. Manifold learning for fMRI time-varying functional connectivity. Front Hum Neurosci. 2023;17:1134012. [PubMed ID: 37497043]. [PubMed Central ID: PMC10366614]. https://doi.org/10.3389/fnhum.2023.1134012.
  • 8.
    Hart B, Cribben I, Fiecas M, Alzheimer's Disease Neuroimaging I. A longitudinal model for functional connectivity networks using resting-state fMRI. Neuroimage. 2018;178:687-701. [PubMed ID: 29879474]. https://doi.org/10.1016/j.neuroimage.2018.05.071.
  • 9.
    Xu W, Li Q, Liu X, Zhen Z, Wu X. Comparison of feature selection methods based on discrimination and reliability for fMRI decoding analysis. J Neurosci Methods. 2020;335:108567. [PubMed ID: 32001295]. https://doi.org/10.1016/j.jneumeth.2019.108567.
  • 10.
    Samadi B, Samadi S, Samadi M, Samadi S, Samadi M, Mohammadi M. Systematic Review of Detecting Sleep Apnea Using Artificial Intelligence: An Insight to Convolutional Neural Network Method. Arch Neurosci. 2024;11(1). https://doi.org/10.5812/ans-144058.
  • 11.
    Zolghadr Z, Batouli SA, Tehrani-Doost M, Shafaghi L, Hadjighassem M, Alavi Majd H, et al. Improvement of Classification Performance in High-Dimension Low-Sample-Size Modeling by Sparse Functional Connectivity States in Subjects with Attention Deficit-Hyperactivity Disorder and Healthy Controls. Arch Neurosci. 2023;10(2). https://doi.org/10.5812/ans-134329.
  • 12.
    Yoneyama N, Watanabe H, Kawabata K, Bagarinao E, Hara K, Tsuboi T, et al. Severe hyposmia and aberrant functional connectivity in cognitively normal Parkinson's disease. PLoS One. 2018;13(1). e0190072. [PubMed ID: 29304050]. [PubMed Central ID: PMC5755765]. https://doi.org/10.1371/journal.pone.0190072.
  • 13.
    Chen X, Wang Z, McKeown MJ. FMRI group studies of brain connectivity via a group robust Lasso. 2010 IEEE International Conference on Image Processing. Hong Kong, China. 2010. p. 589-92.
  • 14.
    Venkataraman A, Kubicki M, Westin CF, Golland P. Robust Feature Selection in Resting-State fMRI Connectivity Based on Population Studies. 2010 IEEE Computer Society Conference on Computer Vision and Pattern Recognition-Workshops. San Francisco, USA. 2010. p. 63-70.
  • 15.
    Akbarifar A, Maghsoudpour A, Mohammadian F, Mohammadzaheri M, Ghaemi O. A novel approach to dementia prediction leveraging recursive feature elimination and decision tree. Research Square. 2024;Preprints. https://doi.org/10.21203/rs.3.rs-4114596/v1.
  • 16.
    Cools R. Dopaminergic modulation of cognitive function-implications for L-DOPA treatment in Parkinson's disease. Neurosci Biobehav Rev. 2006;30(1):1-23. [PubMed ID: 15935475]. https://doi.org/10.1016/j.neubiorev.2005.03.024.
  • 17.
    du Boisgueheneuc F, Levy R, Volle E, Seassau M, Duffau H, Kinkingnehun S, et al. Functions of the left superior frontal gyrus in humans: a lesion study. Brain. 2006;129(Pt 12):3315-28. [PubMed ID: 16984899]. https://doi.org/10.1093/brain/awl244.
  • 18.
    Postuma RB, Berg D, Stern M, Poewe W, Olanow CW, Oertel W, et al. MDS clinical diagnostic criteria for Parkinson's disease. Mov Disord. 2015;30(12):1591-601. [PubMed ID: 26474316]. https://doi.org/10.1002/mds.26424.
  • 19.
    Dehaene S, Cohen L. The unique role of the visual word form area in reading. Trends Cogn Sci. 2011;15(6):254-62. [PubMed ID: 21592844]. https://doi.org/10.1016/j.tics.2011.04.003.
  • 20.
    Zhang J. Mining imaging and clinical data with machine learning approaches for the diagnosis and early detection of Parkinson's disease. NPJ Parkinsons Dis. 2022;8(1):13. [PubMed ID: 35064123]. [PubMed Central ID: PMC8783003]. https://doi.org/10.1038/s41531-021-00266-8.
  • 21.
    Obeso JA, Stamelou M, Goetz CG, Poewe W, Lang AE, Weintraub D, et al. Past, present, and future of Parkinson's disease: A special essay on the 200th Anniversary of the Shaking Palsy. Mov Disord. 2017;32(9):1264-310. [PubMed ID: 28887905]. [PubMed Central ID: PMC5685546]. https://doi.org/10.1002/mds.27115.
  • 22.
    Harvey J, Reijnders RA, Cavill R, Duits A, Kohler S, Eijssen L, et al. Machine learning-based prediction of cognitive outcomes in de novo Parkinson's disease. NPJ Parkinsons Dis. 2022;8(1):150. [PubMed ID: 36344548]. [PubMed Central ID: PMC9640625]. https://doi.org/10.1038/s41531-022-00409-5.
  • 23.
    Braak H, Del Tredici K, Rub U, de Vos RA, Jansen Steur EN, Braak E. Staging of brain pathology related to sporadic Parkinson's disease. Neurobiol Aging. 2003;24(2):197-211. [PubMed ID: 12498954]. https://doi.org/10.1016/s0197-4580(02)00065-9.
  • 24.
    Stevens FL, Hurley RA, Taber KH. Anterior cingulate cortex: unique role in cognition and emotion. J Neuropsychiatry Clin Neurosci. 2011;23(2):121-5. [PubMed ID: 21677237]. https://doi.org/10.1176/jnp.23.2.jnp121.
  • 25.
    Leech R, Sharp DJ. The role of the posterior cingulate cortex in cognition and disease. Brain. 2014;137(Pt 1):12-32. [PubMed ID: 23869106]. [PubMed Central ID: PMC3891440]. https://doi.org/10.1093/brain/awt162.
  • 26.
    Cheng W, Liang X, Zeng W, Guo J, Yin Z, Dai J, et al. Machine learning approach effectively discriminates between Parkinson's disease and progressive supranuclear palsy: Multi-level indices of rs-fMRI. Brain Res Bull. 2025;229:111476. [PubMed ID: 40706759]. https://doi.org/10.1016/j.brainresbull.2025.111476.
  • 27.
    Vicidomini C, Fontanella F, D'Alessandro T, Roviello GN, De Stefano C, Stocchi F, et al. Resting-state functional MRI metrics to detect freezing of gait in Parkinson's disease: A machine learning approach. Comput Biol Med. 2025;192(Pt B):110244. [PubMed ID: 40347799]. https://doi.org/10.1016/j.compbiomed.2025.110244.
  • 28.
    Jones DK, Christiansen KF, Chapman RJ, Aggleton JP. Distinct subdivisions of the cingulum bundle revealed by diffusion MRI fibre tracking: implications for neuropsychological investigations. Neuropsychologia. 2013;51(1):67-78. [PubMed ID: 23178227]. [PubMed Central ID: PMC3611599]. https://doi.org/10.1016/j.neuropsychologia.2012.11.018.
  • 29.
    Warrier C, Wong P, Penhune V, Zatorre R, Parrish T, Abrams D, et al. Relating structure to function: Heschl's gyrus and acoustic processing. J Neurosci. 2009;29(1):61-9. [PubMed ID: 19129385]. [PubMed Central ID: PMC3341414]. https://doi.org/10.1523/JNEUROSCI.3489-08.2009.
  • 30.
    Ackermann H, Riecker A. The contribution of the insula to motor aspects of speech production: a review and a hypothesis. Brain Lang. 2004;89(2):320-8. [PubMed ID: 15068914]. https://doi.org/10.1016/S0093-934X(03)00347-X.
  • 31.
    Wildgruber D, Ackermann H, Kreifelts B, Ethofer T. Cerebral processing of linguistic and emotional prosody: fMRI studies. Prog Brain Res. 2006;156:249-68. [PubMed ID: 17015084]. https://doi.org/10.1016/S0079-6123(06)56013-3.
  • 32.
    Eickhoff SB, Stephan KE, Mohlberg H, Grefkes C, Fink GR, Amunts K, et al. A new SPM toolbox for combining probabilistic cytoarchitectonic maps and functional imaging data. Neuroimage. 2005;25(4):1325-35. [PubMed ID: 15850749]. https://doi.org/10.1016/j.neuroimage.2004.12.034.
  • 33.
    Stoodley CJ, Schmahmann JD. Functional topography in the human cerebellum: a meta-analysis of neuroimaging studies. Neuroimage. 2009;44(2):489-501. [PubMed ID: 18835452]. https://doi.org/10.1016/j.neuroimage.2008.08.039.
  • 34.
    Schmahmann JD. The cerebellum and cognition. Neurosci Lett. 2019;688:62-75. [PubMed ID: 29997061]. https://doi.org/10.1016/j.neulet.2018.07.005.
  • 35.
    Binder JR, Desai RH, Graves WW, Conant LL. Where is the semantic system? A critical review and meta-analysis of 120 functional neuroimaging studies. Cereb Cortex. 2009;19(12):2767-96. [PubMed ID: 19329570]. [PubMed Central ID: PMC2774390]. https://doi.org/10.1093/cercor/bhp055.
  • 36.
    Hickok G, Poeppel D. The cortical organization of speech processing. Nat Rev Neurosci. 2007;8(5):393-402. [PubMed ID: 17431404]. https://doi.org/10.1038/nrn2113.
  • 37.
    Visser M, Jefferies E, Lambon Ralph MA. Semantic processing in the anterior temporal lobes: a meta-analysis of the functional neuroimaging literature. J Cogn Neurosci. 2010;22(6):1083-94. [PubMed ID: 19583477]. https://doi.org/10.1162/jocn.2009.21309.

Crossmark
Crossmark
Checking
Share on
Cited by
Metrics

Ordering Reprints

Articles are published under the Creative Commons license stated on each article. No permission or royalty fee is required for uses permitted by that license. CCC handles optional bulk and customized reprint orders. Any quotation covers production and delivery services only, not copyright permission. > Request Reprints from CCC 

Search Relations

Author(s):

Related Articles
