
1. Background
Optimizing postoperative pain control remains a central priority because of its effects on patient outcomes and healthcare utilization (1). Cervical sympathetic blocks are frequently included in the management of complex regional pain syndrome (CRPS), in which autonomic dysregulation is thought to contribute to the intensification and persistence of pain. Following tissue damage and inflammatory responses, sympathetic sprouting in the dorsal root ganglion, together with increased adrenoceptor expression on nociceptors and keratinocytes, may lead to ongoing pain and heightened sensitivity. Accordingly, sympathetic blocks, such as SGB, have been used for conditions in which sympathetic activity is believed to contribute to the underlying pathophysiology (2).
The analgesic effect of SGB is thought to involve modulation of inflammatory pathways and attenuation of sympathetic activity, thereby affecting nociceptive and neuropathic pain pathways, suppressing sympathetic hyperactivity, and stabilizing hemodynamics (3). Brachial plexus blocks cause complete sensory and motor blockade of the upper extremity, which may be inconvenient for patients despite their efficacy for intraoperative and postoperative analgesia. In contrast, the stellate ganglion, which provides sympathetic innervation to the head, neck, and upper extremities, can be selectively blocked without affecting motor or sensory function in these areas (4). Recent clinical studies have shown that SGB is effective in reducing postoperative pain and modulating sympathetic activity (5). Although SGB is well established for the treatment of sympathetically mediated chronic pain, such as CRPS, its potential role in reducing acute postoperative nociceptive pain has not been fully explored (6). Case reports have also highlighted the advantages of ultrasound-guided SGB in reducing acute postoperative pain and analgesic use while preserving intraoperative motor function when required for surgical monitoring (4).
Despite extensive study in sympathetically mediated chronic pain conditions such as CRPS, the potential role of SGB in acute postoperative pain has not been thoroughly investigated. Owing to a lack of high-quality randomized trials, recent systematic reviews indicate that the effectiveness of SGB in reducing acute postoperative pain remains uncertain, underscoring the need for further research (5). Potential clinical benefits of incorporating SGB into perioperative management include improved hemodynamic stability, reduced sympathetic-mediated stress responses, decreased opioid consumption, and improved postoperative recovery. Evidence from recent cohort studies and randomized trials suggests that preoperative SGB may reduce intraoperative blood pressure and heart rate fluctuations and lower early postoperative pain scores. However, the findings remain conflicting and require further validation (6, 7).
2. Objectives
Given the limited evidence regarding the effects of preoperative SGB on acute postoperative pain and perioperative hemodynamics in upper extremity surgery, this study aimed to evaluate whether preoperative SGB improves postoperative pain outcomes and stabilizes hemodynamic profiles in patients undergoing upper limb procedures.
3. Methods
3.1. Study Design and Setting
This retrospective case-control study was conducted at Dr. Shariati Hospital, Tehran University of Medical Sciences (TUMS), Tehran, Iran. We reviewed electronic and paper medical records of patients undergoing upper extremity surgery under general anesthesia (GA) from March 2019 to March 2020, equivalent to the Iranian calendar years 1398 to 1399. The primary aim of the study was to examine postoperative pain and related perioperative outcomes in patients who received ultrasound-guided SGB before surgery compared with those who did not receive SGB as part of routine anesthetic care.
Given the retrospective design, no formal sample size calculation was performed; all eligible patients who met the inclusion criteria during the study period were included.
3.2. Ethical Considerations
This study was approved by the Ethics Committee of TUMS (approval code: IR.TUMS.MEDICINE.REC.1389.815). Owing to the retrospective design and use of anonymized data, the requirement for informed consent was waived by the ethics committee. All procedures were conducted in accordance with the Declaration of Helsinki.
3.3. Study Population and Treatment Allocation
Patients aged 18 to 60 years with American Society of Anesthesiologists (ASA) physical status I or II who were candidates for elective upper extremity surgery with GA were allocated to receive preoperative ultrasound-guided SGB based on the individual anesthesiologist's clinical judgment, reflecting routine practice rather than a predefined institutional protocol. Factors likely influencing this decision included anticipated postoperative pain severity (e.g., fracture vs. soft tissue surgery), patient anxiety, expected sympathetic response, and clinician preference. Consequently, treatment allocation was nonrandomized and potentially subject to confounding by indication.
Patients were excluded if they had chronic pain, regular opioid use or substance abuse, vasoactive drug use, a local anesthetic allergy, significant cardiac, hepatic, or renal disease documented in their medical records, or incomplete records.
3.4. Propensity Score Matching
To reduce baseline differences between groups, 1:1 propensity score matching without replacement was performed using a nearest-neighbor algorithm. The following variables were selected a priori, based on clinical relevance and prior literature, as potential confounders of postoperative pain and opioid use: age, sex, body mass index (BMI), ASA physical status, type of surgery (categorized), and duration of surgery.
The equal number of patients in the 2 study groups did not result from prospective allocation or randomization; rather, it resulted from retrospective eligibility screening and 1:1 propensity score matching of available records. Therefore, treatment allocation remained nonrandomized and was based on routine clinical decision-making by the attending anesthesiologist.
A caliper width of 0.2 standard deviations of the logit of the propensity score was applied to improve match quality. Matching adequacy was further assessed visually by comparing propensity score distributions between groups.
3.5. Assessment of Covariate Balance
Balance between groups after matching was evaluated using standardized mean differences (SMDs) rather than relying solely on P values. An SMD < 0.1 was considered indicative of acceptable balance. Residual imbalances were examined and are reported in Table 1.
Table 1.
Baseline Demographic and Clinical Characteristics of the Study Population a
| Variables | SGB group (n = 18) | Control group (n = 18) | SMD | P-Value |
|---|---|---|---|---|
| Male | 14 (77.8) | 14 (77.8) | 0.00 | 1.000 |
| Female | 4 (22.2) | 4 (22.2) | 0.00 | 1.000 |
| Age (y) | 37.56 ± 13.32 | 31.61 ± 16.97 | 0.39 | 0.251 |
| BMI (kg/m2) | 24.55 ± 2.94 | 24.32 ± 2.85 | 0.08 | 0.813 |
| Duration of surgery (h) | 2.47 ± 0.73 | 2.47 ± 1.13 | 0.00 | 0.999 |
| ASA (I/II) | Similar distribution | < 0.10 b | - | |
| Type of surgery | 0.35 c | 0.128 | ||
| Upper extremity fracture | 3 (16.7) | 4 (22.2) | ||
| Finger surgery | 0 (0.0) | 2 (11.1) | ||
| Distal radius surgery | 8 (44.4) | 1 (5.6) | ||
| Dupuytren surgery | 2 (11.1) | 3 (16.7) | ||
| Forearm wound debridement | 2 (11.1) | 2 (11.1) | ||
| Nerve graft surgery | 3 (16.7) | 4 (22.2) | ||
| Wrist arthroscopy | 0 (0.0) | 2 (11.1) | ||
| Smoking history | 2 (11.1) | 3 (16.7) | 0.34 | 0.630 |
| Side of surgery | 0.34 | 0.310 | ||
| Left side | 9 (50.0) | 6 (33.3) | ||
| Right side | 9 (50.0) | 12 (66.7) | ||
| Estimated blood loss (mL); mean | 80 | 100 | 0.25 d | 0.193 |
| Baseline HR (beats/min) | 81.62 ± 13.55 | 79.33 ± 12.67 | 0.17 | 0.645 |
| Baseline SBP (mmHg) | 134.33 ± 11.04 | 135.22 ± 10.97 | 0.08 | 0.810 |
| Baseline DBP (mmHg) | 74.22 ± 9.29 | 72.55 ± 9.61 | 0.18 | 0.645 |
a Values are expressed as No. (%) or mean ± SD unless otherwise indicated. SMD was calculated as the difference in means divided by the pooled SD for continuous variables and as the difference in proportions divided by the pooled variance for binary variables. An SMD < 0.1 indicates good balance, 0.1 to 0.2 indicates acceptable balance, and > 0.2 suggests imbalance. Abbreviations: ASA, American Society of Anesthesiologists; BMI, body mass index; DBP, diastolic blood pressure; HR, heart rate; SBP, systolic blood pressure; SD, standard deviation; SGB, stellate ganglion block; SMD, standardized mean difference.
b ASA distribution was matched by design; exact SMD was not estimable from aggregated data.
c Global SMD for the multicategory variable surgery type, estimated using distributional difference.
d SD was not reported; SMD was approximated.
3.6. Stellate Ganglion Block Technique
For patients who received SGB, the procedure was performed before induction of GA by an experienced anesthesiologist. Patients were placed in the supine position with mild neck extension and rotation of the head to the opposite side. After skin preparation and antiseptic cleansing, a high-frequency linear ultrasound probe was placed at the level of the cricoid cartilage to identify anatomical structures. After negative aspiration, 8 mL of diluted 0.5% bupivacaine was injected adjacent to the stellate ganglion. Patients were monitored continuously during and after the block.
3.7. Anesthesia and Intraoperative Analgesia Protocol
All patients received GA using a standardized institutional approach. However, intraoperative opioid administration (fentanyl and morphine) was not protocolized and was administered at the discretion of the attending anesthesiologist based on hemodynamic responses (e.g., increases in heart rate [HR] or systolic blood pressure [SBP] and diastolic blood pressure [DBP]) and perceived nociception.
3.8. Postoperative Pain Assessment
Postoperative pain intensity was assessed using the NRS, ranging from 0 to 10, by recovery room and ward nursing staff as part of routine clinical documentation. Although no formal research-specific assessment protocol was used, institutional practice follows a semistandardized schedule, with pain scores typically recorded on arrival to recovery, 1 hour postoperatively, and then at regular intervals of approximately 6, 12, 18, and 24 hours. These time points were extracted consistently for all patients.
Although postoperative pain scores and hemodynamic variables were documented at relatively standardized clinical time points as part of routine institutional care, no prospective research-specific schedule was applied. All data were extracted retrospectively from medical records.
3.9. Postoperative Analgesic Protocol
Postoperative analgesia followed routine institutional practice, including rescue opioid analgesia (intravenous morphine) when NRS ≥ 4, with an initial dose of 2 mg IV morphine, repeated as needed based on clinical response. Nonopioid analgesics (e.g., acetaminophen or nonsteroidal anti-inflammatory drugs) were administered according to physician orders, but their use was not strictly standardized across patients. These analgesic practices were applied similarly in both groups, although individual clinician discretion may have introduced minor variability.
3.10. Outcome Definitions
The primary outcome of this study was postoperative NRS pain scores within the first 24 hours.
Secondary outcomes included intraoperative opioid consumption (fentanyl and morphine), postoperative opioid consumption within 24 hours, time to first postoperative opioid request, and hemodynamic parameters (SBP, DBP, and HR).
Intraoperative and postoperative opioid use were analyzed separately to ensure clear interpretability.
3.11. Statistical Analysis
Statistical analysis was performed using SPSS software version 23. Continuous variables were presented as mean ± standard deviation, and categorical variables as frequencies and percentages. Comparisons between groups were conducted using the independent t-test for continuous variables and the chi-square test or Fisher exact test for categorical variables. Changes in pain scores and hemodynamic parameters over time were evaluated using repeated-measures analysis. A P value of less than 0.05 was considered statistically significant.
4. Results
4.1. Study Population
A total of 36 patients who underwent upper extremity surgery during the study period were included in the analysis (Figure 1). Based on anesthetic records, 18 patients received a preoperative ultrasound-guided SGB (SGB group), and 18 patients underwent similar surgical procedures without receiving an SGB (non-SGB group). All included patients completed postoperative follow-up for at least 24 hours, and complete data were available for pain assessment, opioid consumption, and hemodynamic monitoring.
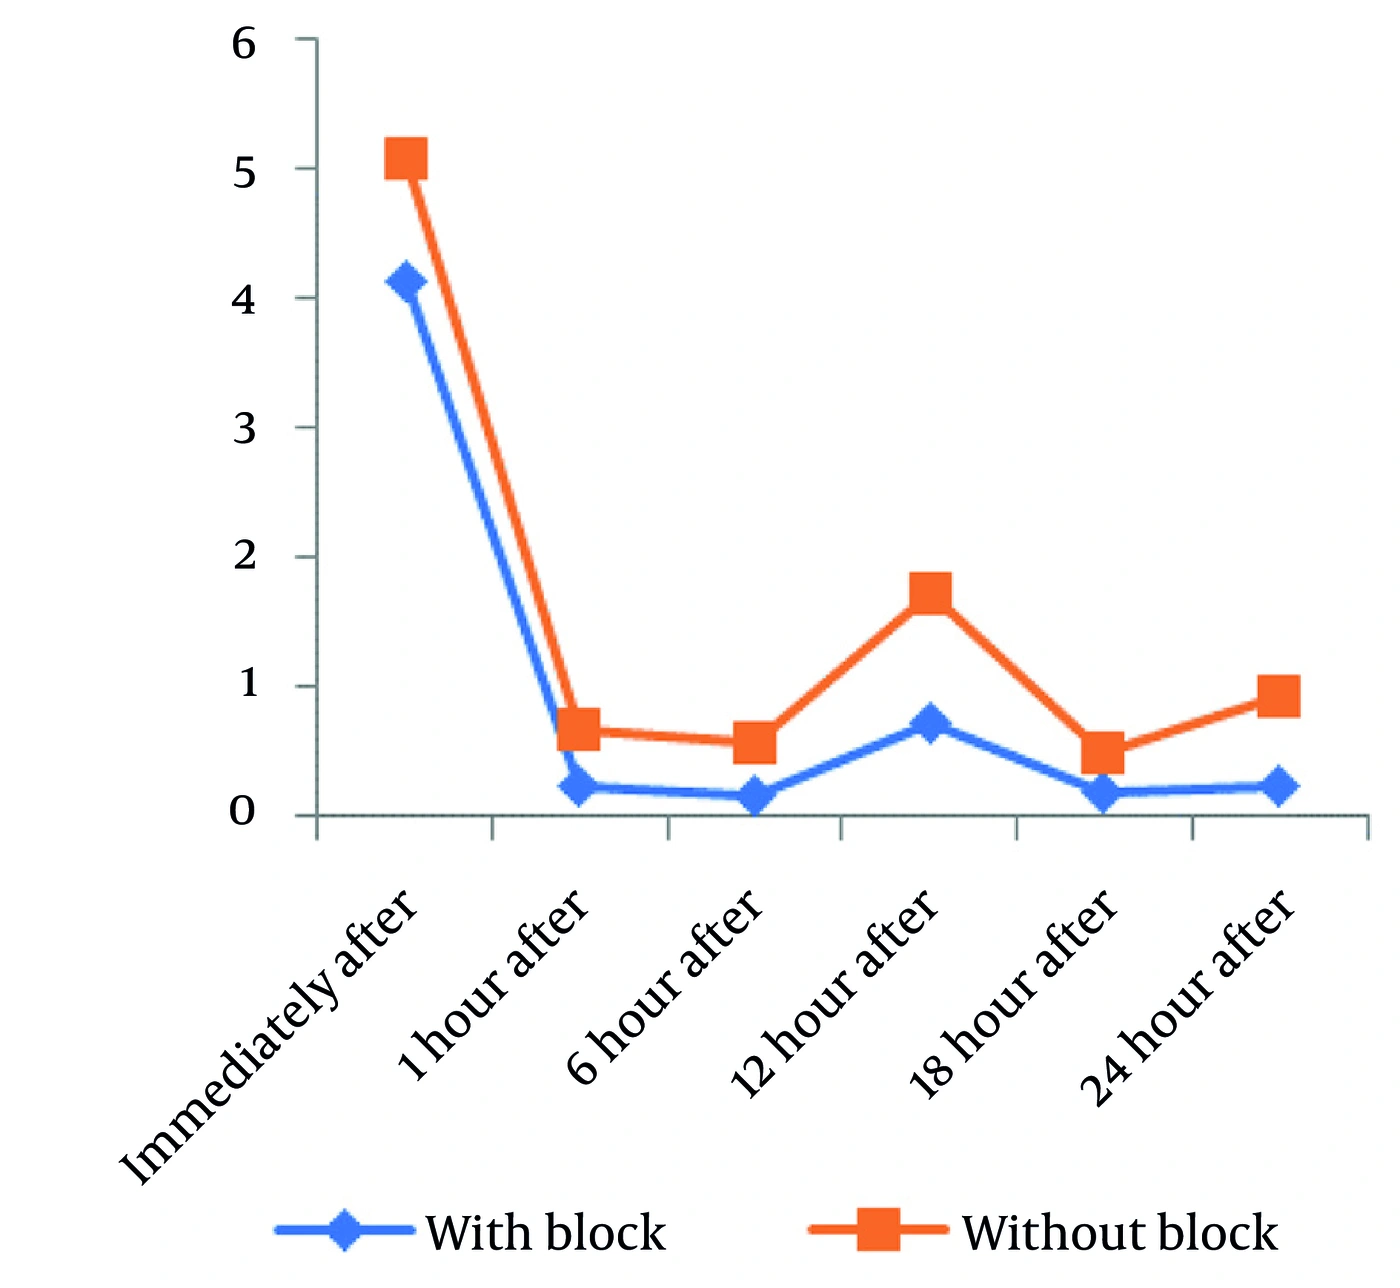
Figure 1.
The Strengthening the Reporting of Observational Studies in Epidemiology (STROBE) diagram of the study.
4.2. Baseline Demographic and Clinical Characteristics
The 2 groups were comparable with respect to baseline demographic and clinical characteristics, including sex (77.8% male in both), age (37.56 ± 13.32 years in the SGB group vs. 31.61 ± 16.97 years in the non-SGB group; P = 0.251), BMI (24.55 ± 2.94 kg/m2 vs. 24.32 ± 2.85 kg/m2; P = 0.813), surgery duration (2.47 ± 0.73 hours vs. 2.47 ± 1.13 hours; P = 0.999), surgery types (P = 0.128), smoking history (11.1% vs. 16.7%; P = 0.630), surgical side (P = 0.310), and intraoperative blood loss (80 cc vs. 100 cc; P = 0.193). In the SGB group, the mean duration of the stellate ganglion block was 3.25 ± 1.25 hours (Table 1).
In addition to P values, SMDs were calculated to assess post-matching balance. Most covariates demonstrated acceptable balance (SMD < 0.1), although minor residual imbalance was observed in the distribution of specific surgery types, which may reflect incomplete control of procedural heterogeneity.
4.3. Postoperative Pain Scores
Postoperative pain intensity, measured using the NRS (0-10), was the primary outcome. These measurements were obtained as part of routine postoperative care and extracted from nursing and anesthesia records. For this study, NRS values were documented immediately after surgery and at 1, 6, 12, 18, and 24 hours postoperatively.
Secondary outcomes included total opioid consumption during surgery and within the first 24 hours after the operation, as well as the time to first postoperative opioid request. Hemodynamic parameters, including SBP, DBP, and HR, were also recorded during surgery and in the recovery period. Patient satisfaction was evaluated using a standard postoperative satisfaction score documented in the medical records. Any adverse events related to the procedure or anesthesia that occurred during hospitalization were also recorded.
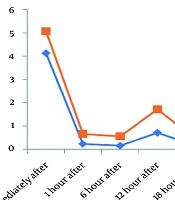
At all evaluated time points, including immediately after surgery and at 1, 6, 12, 18, and 24 hours postoperatively, the mean pain score was lower in the SGB group than in the non-SGB group. Analysis of pain score trends over time showed a statistically significant difference between the 2 groups (P < 0.011) (Table 2 and Figure 2).
Table 2.
Postoperative Pain Intensity Assessed Using the Numeric Rating Scale (NRS) at Predefined Time Points During the First 24 Hours After Surgery a
| Numeric Rating Scale | SGB Group | Control Group | P-Value |
|---|---|---|---|
| Immediately after surgery | 4.11 ± 0.26 | 5.07 ± 0.30 | 0.023 |
| 1 (h) after surgery | 2.39 ± 0.24 | 4.80 ± 0.67 | 0.001 |
| 6 (h) after surgery | 0.83 ± 0.16 | 2.07 ± 0.57 | 0.027 |
| 12 (h) after surgery | 0.72 ± 0.17 | 1.72 ± 0.35 | 0.016 |
| 18 (h) after surgery | 0.17 ± 0.09 | 0.50 ± 0.18 | 0.015 |
| 24 (h) after surgery | 0.22 ± 0.10 | 0.93 ± 0.26 | 0.012 |
a Values are expressed as mean ± SD.
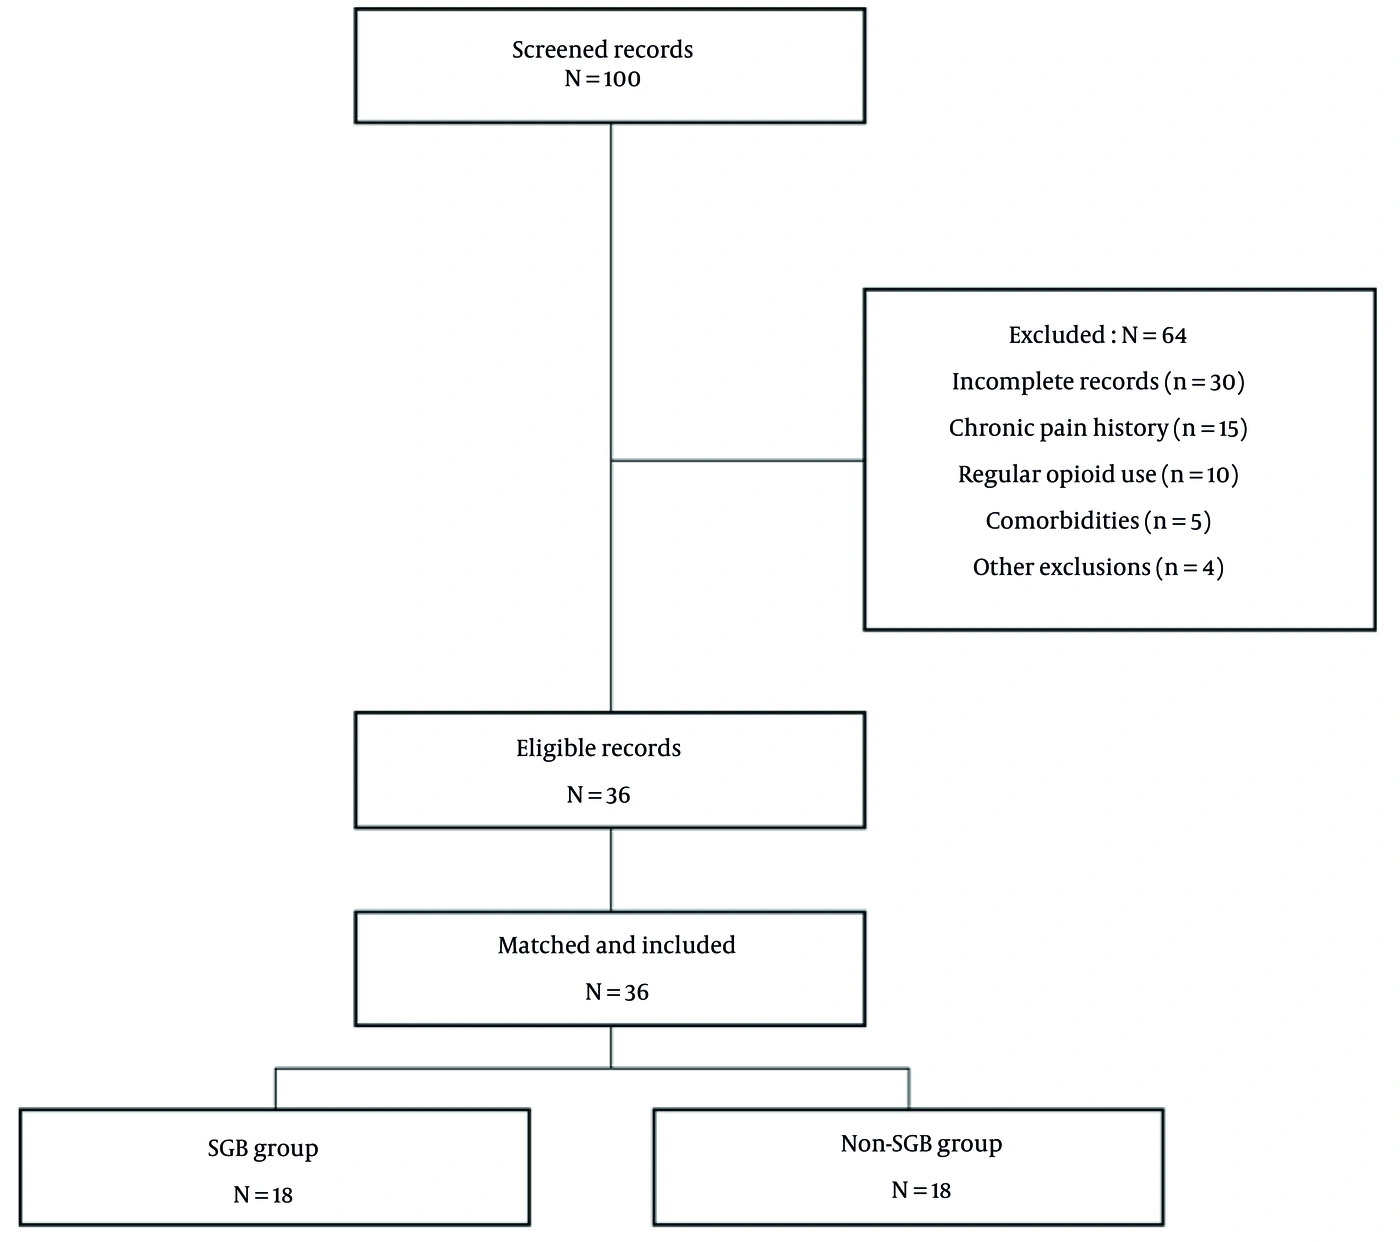
Figure 2.
Trend of postoperative pain scores measured using the Numeric Rating Scale (NRS) during the first 24 hours after upper extremity surgery in patients who received preoperative stellate ganglion block compared with controls.
4.4. Opioid Consumption and Timing of First Request
The mean opioid dose (fentanyl) during surgery and within the first 24 postoperative hours in the SGB and non-SGB groups was 49.18 ± 38.88 µg and 123.28 ± 43.59 µg, respectively, and was lower in the SGB group (P = 0.037). The mean morphine dose during surgery in the SGB and non-SGB groups was 0 mg and 2.00 ± 0.40 mg (administered in 6 patients, 33.33%), respectively, and was lower in the SGB group (P = 0.021). The time to first postoperative opioid request in the SGB and non-SGB groups was 61.50 ± 10.22 minutes and 38.00 ± 9.46 minutes, respectively, and was longer in the SGB group (P = 0.046) (Table 3).
Table 3.
Intraoperative and Postoperative Opioid Consumption and Time to First Postoperative Opioid Request in Patients with and Without Preoperative Stellate Ganglion Block a
| Variables | SGB Group (n = 18) | Control Group (n = 18) | P-Value |
|---|---|---|---|
| Intraoperative fentanyl dose (µg) | 49.18 ± 38.88 | 123.28 ± 43.59 | 0.037 |
| Intraoperative morphine use | 0 (0.0) | 6 (33.3) | 0.021 |
| Morphine dose (mg) b | 0 | 2.00 ± 0.40 | 0.021 |
| Time to first postoperative opioid request (min) | 61.50 ± 10.22 | 38.00 ± 9.46 | 0.046 |
a Values are expressed as mean ± SD or No. (%).
b Morphine was administered only in patients who required rescue analgesia.
4.5. Hemodynamic Parameters
Changes in SBP, DBP, and HR were analyzed using repeated-measures analysis.
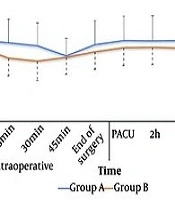
No significant between-group differences were observed in SBP at baseline or during the first 120 minutes intraoperatively. However, after 120 minutes and during recovery, the SGB group demonstrated higher mean SBP values. The overall time trend differed significantly between groups (P < 0.011), suggesting a time-by-group interaction effect.
No statistically significant between-group differences in trends over time were observed for DBP and HR (P = 0.124 and P = 0.334, respectively).
Assumptions for repeated-measures analysis, including sphericity, were assessed, and appropriate corrections were applied when necessary.
4.6. Patient Satisfaction
The mean postoperative satisfaction score in the SGB and non-SGB groups was 3.61 ± 0.97 and 2.61 ± 0.85, respectively, and was higher in the SGB group (P = 0.002). Categorical analysis showed complete satisfaction in 14 patients (77.8%) in the SGB group and 4 patients (22.2%) in the non-SGB group; partial satisfaction in 3 patients (16.7%) and 11 patients (61.1%); partial dissatisfaction in 0 patients (0.0%) and 3 patients (16.7%); and complete dissatisfaction in 1 patient (5.6%) and 0 patients (0.0%) (P = 0.001) (Table 4). No serious adverse events were observed in either group during the 24 hours after admission.
Table 4.
Postoperative Patient Satisfaction Levels in the Stellate Ganglion Block and Control Groups a
| Satisfaction Levels | SGB Group | Control Group | P-Value |
|---|---|---|---|
| Complete satisfaction | 14 (77.7) | 4 (22.2) | 0.002 |
| Partial satisfaction | 3 (16.7) | 11 (61.1) | 0.002 |
| Partial dissatisfaction | 0 (0.0) | 3 (16.7) | 0.002 |
| Complete dissatisfaction | 1 (5.6) | 0 (0.0) | 0.002 |
| Mean satisfaction score | 3.61 ± 0.97 | 2.61 ± 0.85 | 0.002 |
a Values are expressed as No. (%) or mean ± SD.
5. Discussion
Compared with similar surgical procedures performed without SGB, this study showed that preoperative ultrasound-guided SGB was associated with lower postoperative pain scores, decreased opioid consumption, and increased patient satisfaction. Because SGB was administered at the anesthesiologist’s discretion, confounding by indication cannot be excluded. It is plausible that patients perceived to be at higher risk of postoperative pain were preferentially selected for SGB, which would bias the results toward underestimating the true analgesic effect. Conversely, if SGB was used in more stable or less complex cases, this could bias the results in the opposite direction. Although propensity score matching improved comparability, residual confounding from unmeasured variables remains possible.
These results support the potential use of SGB as an adjunct analgesic method during upper extremity surgery. Similar findings from earlier studies have shown that ultrasound-guided SGB can successfully reduce postoperative pain after upper limb procedures (8, 9). Aleanakian et al. showed that SGB is both safe and effective in alleviating sympathetically maintained pain in patients with CRPS and neuropathic pain disorders (10). Other studies have reported substantial pain reduction following SGB in CRPS, with more than half of patients experiencing more than 50% improvement (11, 12). Comparable results were also observed in the study by Imani et al. (13).
The analgesic effects of SGB may be explained by its influence on sympathetic activity and inflammatory mediators. Sympathetic activation and postoperative inflammation are known contributors to acute pain (5). According to recent research, SGB may alter nerve growth factor (NGF), a crucial mediator in signaling pathways linked to stress (14). Additionally, NGF increases norepinephrine release and sympathetic outflow, thereby increasing peripheral sensitization and pain perception (15). However, not all studies have consistently shown benefits; Wu et al. found no decrease in acute postoperative pain after thoracoscopic surgery using SGB (16), indicating that the effectiveness of SGB may vary depending on surgical context or patient characteristics.
In addition to effectiveness, safety remains a crucial factor for the wider use of SGB. Within 24 hours after surgery, no significant adverse events were noted in our study. This is consistent with the findings of Yoo et al., who reported no problems after SGB (17). Nonetheless, other studies have documented varying complication rates, ranging from mild paresthesia (18) to higher incidences of transient hoarseness, dysphagia, blurred vision, headache, and nausea (19). These disparities could result from variations in patient anatomy, operator experience, or technique. Anesthetic spread in this area can affect autonomic, cardiovascular, endocrine, and immune responses because of the stellate ganglion’s dense network of neural and vascular structures (20).
In terms of hemodynamic effects, our findings do not provide consistent evidence of improved perioperative stability. Although SBP was higher in the SGB group at later intraoperative and recovery time points, no significant differences were observed in DBP or HR. This pattern does not uniformly support a stabilizing effect of SGB and may instead reflect reduced intraoperative opioid use, variability in anesthetic depth, or complex autonomic modulation associated with sympathetic blockade. Therefore, the hemodynamic effects of SGB in this context should be interpreted cautiously.
5.1. Study Limitations
This study has several important limitations. First, the retrospective nonrandomized design precludes causal inference, and the findings should be interpreted as associations rather than evidence of efficacy. Second, although propensity score matching was used, residual confounding due to unmeasured variables, such as intraoperative nociceptive stimuli, clinician decision-making, and individual pain sensitivity, remains likely. Third, the inclusion of heterogeneous upper extremity procedures, such as fracture surgery, nerve grafting, and arthroscopy, introduces variability in postoperative pain trajectories and analgesic requirements, which may not have been fully captured in the matching process. Despite the use of propensity score matching, the retrospective design cannot eliminate residual confounding or selection bias. Therefore, the findings should be interpreted as associations rather than definitive evidence of causality.
5.2. Conclusions
Preoperative ultrasound-guided SGB was associated with lower postoperative pain scores, reduced opioid consumption, and higher patient satisfaction in this cohort of patients undergoing upper extremity surgery. However, given the retrospective design, small sample size, heterogeneity of procedures, and nonstandardized analgesic pathways, these findings should be considered hypothesis-generating rather than definitive evidence of efficacy. Prospective randomized controlled trials with standardized protocols are required to better define the clinical role of SGB in perioperative pain management.