1. Background
Oxygen is vital for the development and growth of living organisms and low oxygen pressure conditions can cause hypoxia (1). The exposure of rats to hypobaric hypoxia for four weeks is the most common approach used to produce a systemic hypoxia, which stimulates the production of active oxygen species and reduces the number of enzymes, antioxidants, and lipid peroxidation (2). Increasing oxidative stress leads to morphological changes in the hippocampus (3, 4). The antioxidant agents help high rate cell survival by removing free radicals and dangerous compounds (5). Flax, scientifically named “Linum Usitatisimum”, is an herb containing polyunsaturated fatty acids (PUFA) (6, 7), so it is able to protect the brain in stroke models (8). Flaxseed (Fx) by neuroprotective effects can reduce the brain injury in hypoxia animal models (9, 10). Additionally, Fx is a good source of lignans, which is one of the major classes of phytoestrogens that have antioxidant properties to remove free radicals. Estrogen affects learning and memory in animal models and human studies and leads to increased dendritic thorn density in pyramidal neurons of the hippocampal region (11, 12). ALA is converted in the body into two types of fatty acids including eicosapentaenoic acid (EPA) and docosahexaenoic acid (DHA) (13). DHA has useful effects on preventing brain damage and functional outcomes (14).
Due to the effects of hypoxia on the brain tissue, especially the hippocampus region, and the neuroprotective effects of Fx on animal models, we investigated the effects of supplementary Fx on the hippocampus region of a rat model of hypoxia.
2. Methods
2.1. Experimental Design
In this study, 24 Wistar adult rats (body weight = 240 - 300 g) were kept under constant laboratory conditions and room temperature (20 - 22°C) and randomly divided into four (n = 6) experimental groups: Control (Co.), sham (Sh.), hypoxia (Hx), hypoxia + flaxseed (Hx + Fx).
Hypoxic rats were exposed to hypoxia (low oxygen pressure) by placing in a hypoxic chamber where the atmospheric pressure of oxygen was reduced (Oxygen 8%, Nitrogen 92%), 4 hours daily for 30 days. The hypoxic chamber was made of plexiglass equipped with a nitrogen gas inlet and a device controlling the oxygen pressure. During the four hours that the rats were in the chamber, a suitable amount of nitrogen gas entered the chamber as long as the oxygen control device showed the oxygen content of the chamber at 8%. The Co. group maintained in conditions of normoxia (oxygen 21%) and free access to normal food and water.
The Hx + Fx group was exposed to hypoxia four hours a day and fed with 10% Fx after the first hypoxic exposure for 6 weeks.
2.2. Preparation of Brain Sections
The rats were decapitated under anesthesia (80 mg/kg ketamine and 10 mg/kg xylazine) and the tissue was fixed by transcardial perfusion with 0.9% saline and kept in 4% paraformaldehyde in PBS. The brains were removed and cut down into five μm sections for H&E and Nissl staining. The sections were examined under a light microscope (Olympus, CX31, and Tokyo, Japan).
2.3. Cresyl Violet (Nissl) Staining
The dark neurons were visualized by staining for the histological samples of the brain injury with Nissl staining. Briefly, the brain was sectioned coronally with the thickness of 5 µm. The sections were stained with 0.04% Nissl staining dissolved in acetate buffer for 1 hour and dark neurons in the hippocampus were counted (15).
2.4. Cell Quantification
The cells were counted for each animal from the injured area (equivalent adult rat bregma coordinates -2.52 to -4.56 mm) in the dorsal part of the hippocampus cornu ammonis (CA1, CA2, and CA3 areas) and dentate gyrus (DG). The number of dark neurons counted was used as an index of cell death.
2.5. Tissue Preparation for Enzyme Assay
The hippocampus region of the rat brain was dissected, removed, and homogenized. The debris was removed by centrifugation at 3500 g for 10 minutes. The supernatant was collected to use for the estimation of the oxidative stress marker (Malondialdehyde (MDA)) and the antioxidant enzyme activity.
2.6. Evaluation of Brain Total Antioxidant Capacity (TAC) and Lipid Peroxidation
After removing and homogenizing the hippocampus, the debris was removed by centrifugation at 3500 g for 10 minutes. The supernatant was collected and 50 mg of the supernatant was homogenized again in 10 volumes of a buffer (solution PBS) and centrifuged. The supernatant was collected and used for enzymatic studies.
2.7. IL-18 Demonstrations
After the induction of hypoxia, blood samples were collected and centrifuged for 10 minutes at 20000 rpm to separate plasma for biochemical analysis of interleukin (IL). IL-18 was determined in the serum by using the enzyme-linked immunoabsorbent assay (ELISA) and Kit (Zell Bio-GmbH) according to the instruction of the manufacturer.
2.8. Data Analysis
Statistical analysis was performed via one-way analysis of variance (ANOVA) and the post hoc Tukey and Tamhane T2 tests using SPSS 16 and P < 0.05 was considered significant.
3. Results
3.1. Fx Effects on Neuronal Density and Dead Neurons in the Hippocampus of Hypoxic Rats
In the hypoxic group, the number of dark cells in the hippocampus significantly increased as compared to the control group (P < 0.05) (Figure 1). In the Fx + Hx group, the number of dark neurons in the hippocampus significantly decreased after 6 weeks (P < 0.05). No significant differences were observed between the control and sham groups with respect to the number of dark cells in any of the tested brain regions (Figure 2).
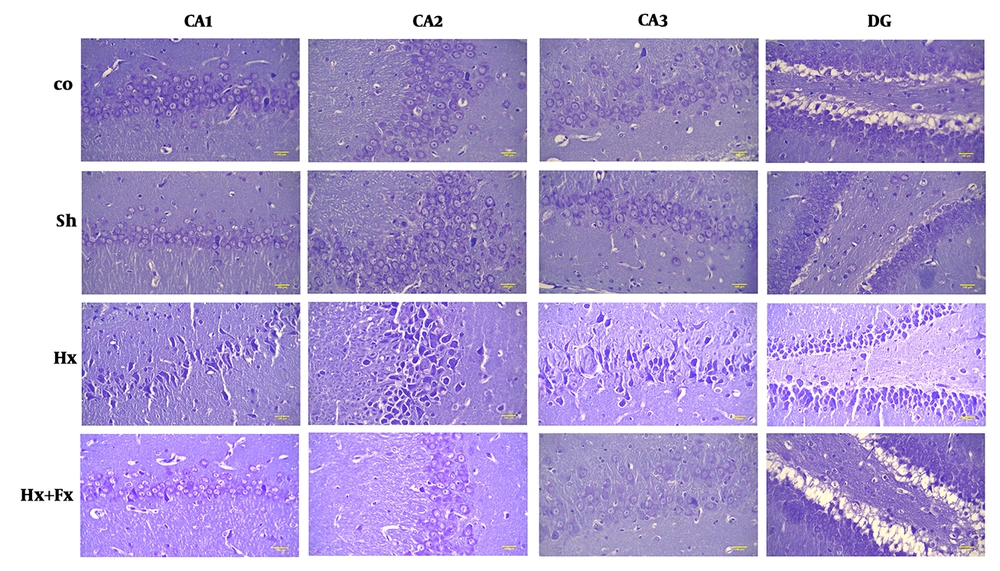
Figure 1.
Effects of Fx supplementation on histological changes in the hippocampus of rats with hypoxia. Histological changes in the hippocampus of rats during hypoxia induction and the effect of flaxseed on the histopathology of different areas of the hippocampus (Cresyl Violet (Nissl) staining, X400). Hypoxia leads to disturbed neuronal density in different areas of the hippocampus and significant improvements were observed in the Hx + Fx group. Co = control, Sh = sham, Hx = hypoxia, Hx + Fx = hypoxia treatment with flaxseed.
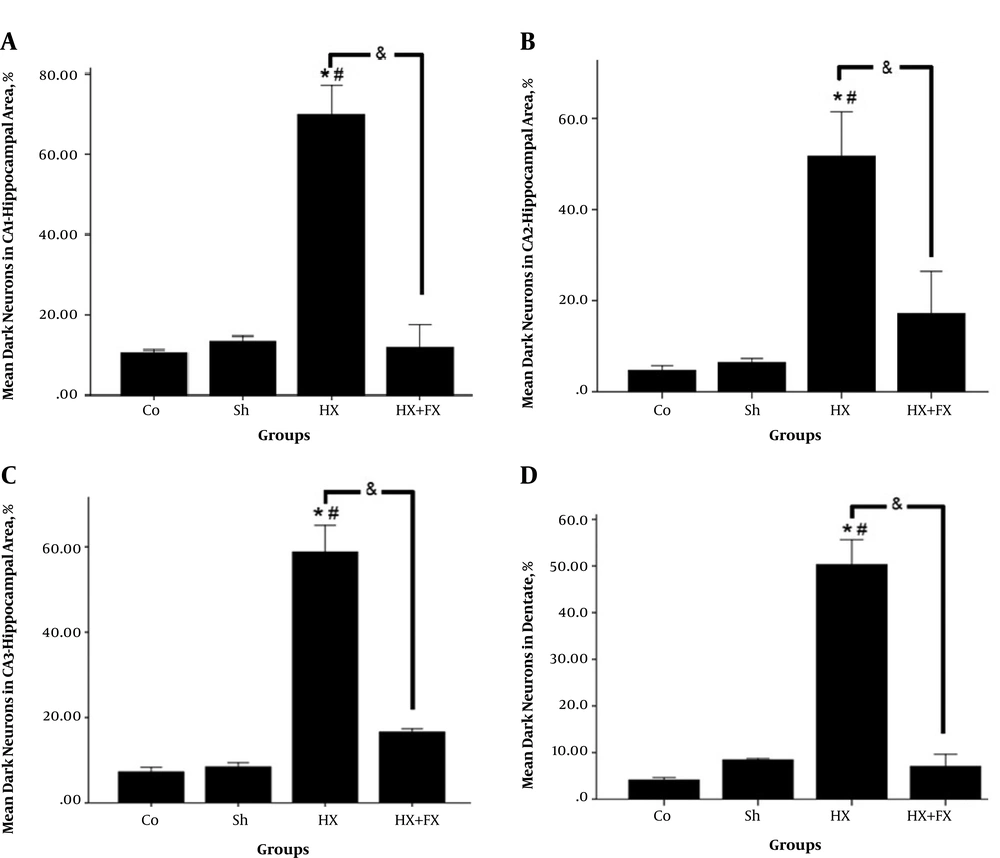
Figure 2.
Effects of Fx on the number of dark neurons in different regions of the hippocampus in rats with hypoxia. A, CA1; B, CA; C, CA3; and D, DG. * = compared to Co. group; # = compared to Sh. group; & = compared two groups of Hx and Hx + Fx. Co = control, Sh = sham, Hx = hypoxia, Hx + Fx = hypoxia treatment with flaxseed.
3.2. Fx Effects on TAC and MDA in the Hippocampal Region of Hypoxic Rats
A significant increase (P < 0.05) was observed in the TAC concentration of the Hx + Fx group in comparison with the other groups (Figure 3).
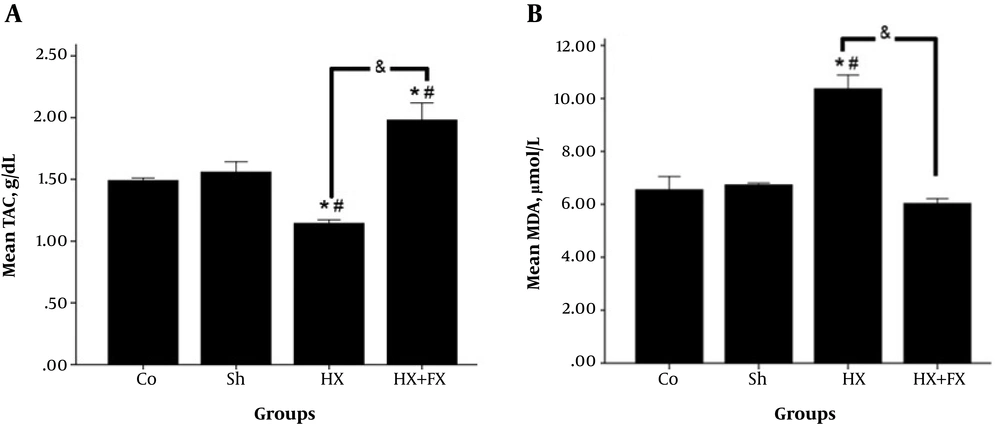
Figure 3.
Effects of Fx on the stress oxidative factors of the hippocampus in rats with hypoxia. A, TAC concentration was significantly different so that a significant increase was observed in TAC concentration in the treatment group in comparison with the other groups (P < 0.05); B, the mean MDA concentration significantly increased in the Hx group compared to the Co. and Sh. groups. There is also a significant difference with the Hx + Fx group (P < 0.05). * = compared to Co. group; # = compared to Sh. group; & = compared two groups of Hx and Hx + Fx. and Sh. groups. Co = control, Sh = sham, Hx = hypoxia, Hx + Fx= hypoxia treatment with flaxseed.
3.3. Evaluation of IL-18
Pro-inflammatory cytokine IL-18 was evaluated in the sera for confirming the model of hypoxia. In comparison with the control and sham groups, the Hx group showed a significant rise (P < 0.05) in the level of IL-18 after hypoxia (Figure 4).
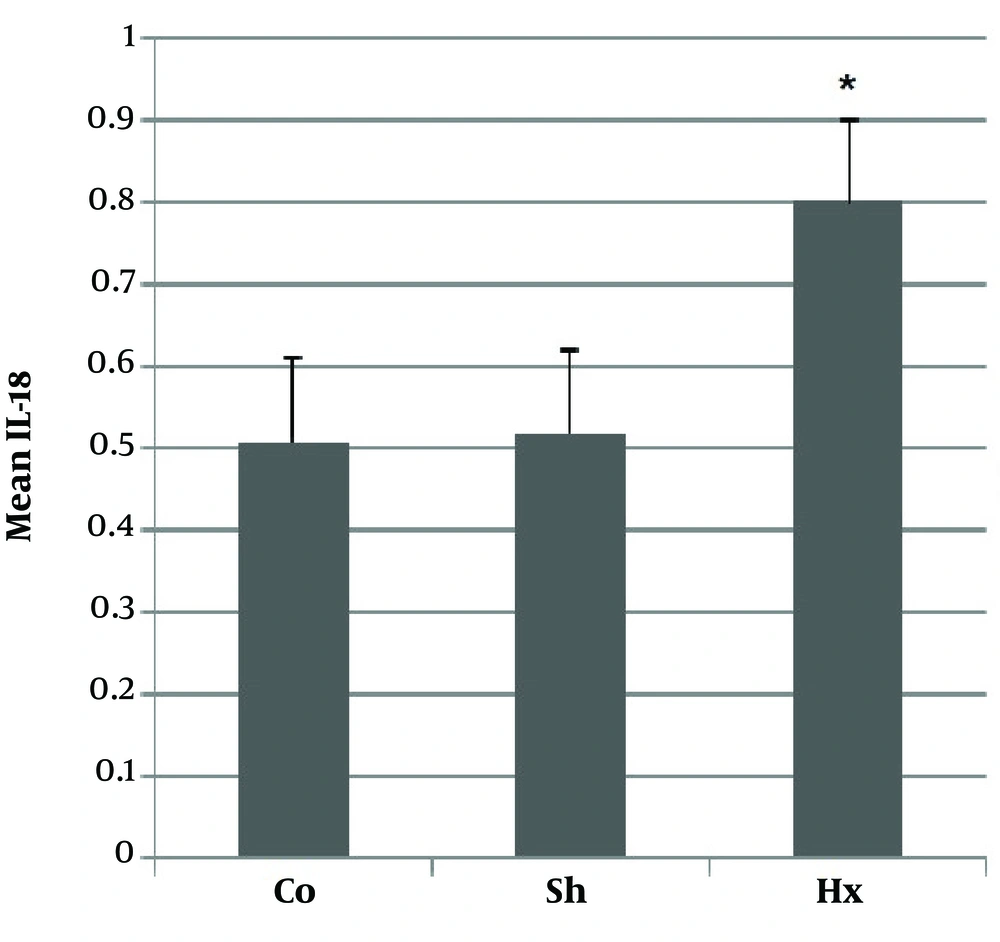
Figure 4.
The changes in the serum IL-18 levels of rats after induction of hypoxia, showing a significant rise in the level of IL-18 in the Hx group compared to Co. and Sh. groups *. Co = control, Sh = sham, Hx = hypoxia.
3.4. Correlation Between Numerical Data
According to Table 1, a significant correlation was observed between the amount TAC and the number of dark neurons in the different regions of the hippocampus so that an increase in the number of dark neurons was associated with a decline in TAC (Figure 5). There was a significant correlation between the MDA level and the number of dark neurons in the hippocampus so that with an increase in the number of dark neurons, the MDA level increased (Table 1, Figure 6).
Table 1.
The Effects of Oral Fx on TAC and MDA Concentrations
| Hippocampal Areas | TAC (g/dL) | MDA (μmol/L) |
|---|---|---|
| Dark neurons in CA1 (%) | ||
| r | -0.792 | 0.982 |
| P value | 0.004 | 0.000 |
| Dark neurons in CA2 (%) | ||
| r | -0.618 | 0.888 |
| P value | 0.043 | 0.000 |
| Dark neurons in CA3 (%) | ||
| r | -0.675 | 0.948 |
| P value | 0.032 | 0.000 |
| Dark neurons in DG (%) | ||
| r | -0.758 | 0.972 |
| P value | 0.011 | 0.000 |
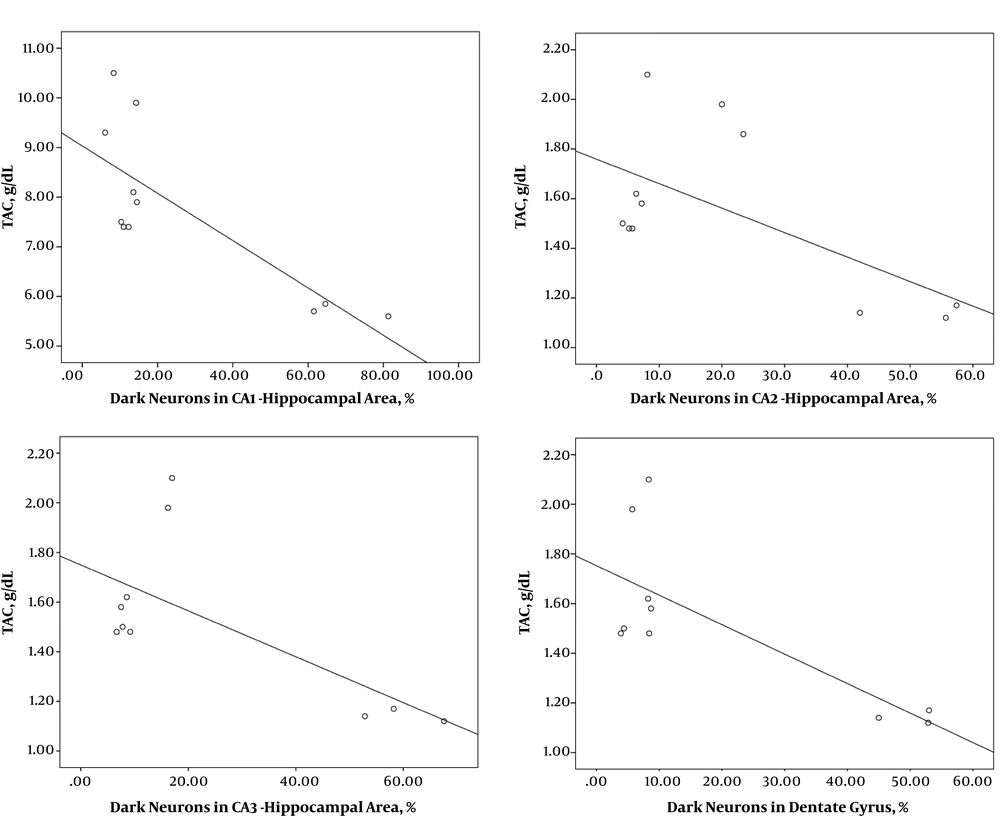
Figure 5.
Correlation between numerical data of TAC and number of dark neurons in different areas of the hippocampus following treatment with Fx in rats with hypoxia. By increasing the number of dark neurons in different areas of the hippocampus, A, CA1; B, CA; C, CA3; D, DG, the TAC amount decreased.
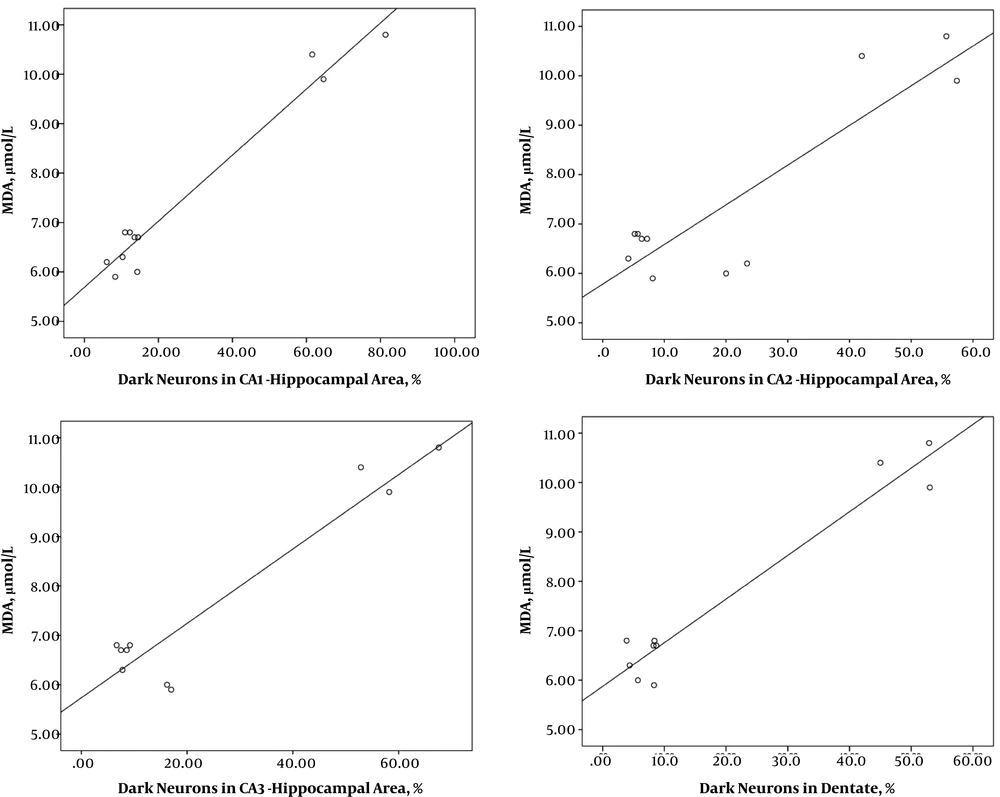
Figure 6.
Correlation between numerical data of MDA and number of dark neurons in different areas of the hippocampus following treatment with Fx in rats with hypoxia. A significant correlation was observed between the amount MDA and the number of dark neurons in different regions of the hippocampus, A, CA1; B, CA; C, CA3 and D, DG, and with an increase in the number of dark neurons, the MDA level increased.
4. Discussion
In this study, we evaluated the neuroprotective effects of Fx in the rat hippocampus subjected to hypoxia. Our results indicated that the Fx consumption in hypoxic rats could increase neuroprotection against a hypoxic injury.
In the central nervous system, an injury caused by hypoxia extends the spectrum of cognitive impairments (16-18). Inflammation is a critical factor in the development of hypoxia in the brain and the production of pro-inflammatory cytokines like IL-18 occurs in the hypoxia. Hedtjarn et al. (19), found that IL-18 markedly increased after hypoxia suggesting that it is important for the development of HI brain injury. Some investigations confirmed that the generation of reactive oxygen species and the subsequent oxidative stress have harmful effects in perinatal brain hypoxia (20-23). The brain is one of the most sensitive regions in response to oxidative damage (24, 25). Lievre et al. found out that the neuronal generation of ROS increased after transient hypoxia (26).
In the present study, Fx was used to decrease the effects of hypoxia in rats. Fx is one of the richest sources of n-3 PUFA acid and α-linolenic acid (27, 28). Some studies reported that Fx exerts anti-inflammatory effects and the important anti-atherogenic property of ALA may have a potent anti-inflammatory role (29, 30). Nounou et al. reported that Fx is one of the promising cytoprotective factors for increasing defense mechanisms in the physiological systems against oxidative stress (31). Lots of evidence indicated that polyunsaturated fatty acids, like docosahexaenoic acid (DHA), improved brain injury (32-34). DHA maintains neurons and reduces cerebral damage at the level of the middle hippocampus (35, 36). Studies have shown that a low dietary consumption of FA or low plasma DHA concentration is associated with impaired neurogenesis (37-39). In a study by Mokhtari et al. (28), the neuroprotective effects of Fx oil on the functional motor recovery were evaluated in a model of ischemic brain stroke. They showed that Fx could protect the cortex against ischemic stroke by upregulation of the brain-derived neurotrophic factor (BDNF) and glial cell-derived neurotrophic factor (GDNF) (28).
DHA is cleaved from the membrane phospholipids to free DHA during brain ischemia and reperfusion (I/R) (40-42). Although DHA up-regulates the Bcl-2 family, it down-regulates caspase-3 (41, 43, 44). During hypoxia, the production of reactive oxygen species increases in addition to the protective ability of the cells, which activate lipid peroxidation (45, 46). Pan et al. (47) found that chronic administration of (DHA) could reduce MDA levels. Our results showed that the mean number of dark neurons was high in the hippocampus region following hypoxia. Moreover, the number of dark pyramidal neurons reduced in the treatment group in comparison with the hypoxic group. In this study, we found that there was a significant change in the level of TAC and lipid peroxidation in the treatment group as compared to the hypoxia group in the hippocampus region.
4.1. Conclusions
The findings of the current study confirmed the greater survival of hippocampal neurons in flaxseed treated animals and provided an evidence to stimulate the clinical development of flaxseed for use as effective therapy in hypoxic brains in order to reduce the cognitive impairment.