This study aimed to examine the intra- and inter-individual variability of SE in submaximal sprint running. We hypothesized that sprinting at higher SE levels would result in less variability both within and between individuals. Overall, the results of this study support our hypothesis.
5.1. Relationship Between Subjective Effort and Coefficient of Variation
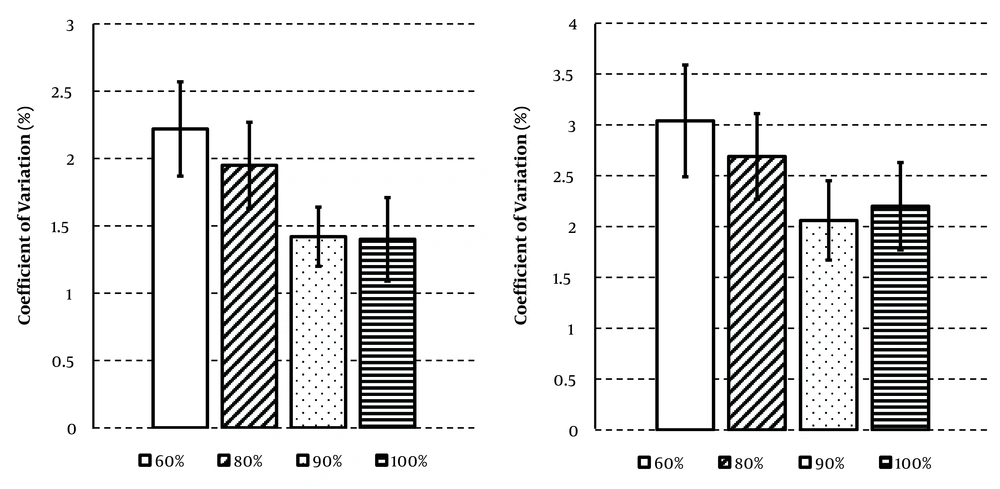
In terms of inter-individual variability, as hypothesized, we found that at higher SE levels, the CV was smaller. These results align with the findings of a previous study (
22). Muraki et al. reported that the inter-individual variability of running speed tended to decrease as the SE level increased to 90% or more (
22); our study shows that this trend persists across a wider range of SE levels. Therefore, when coaches use SE to adjust sprint intensity, the association between lower SE levels and higher inter-individual variability should be taken into account.
We also observed smaller intra-individual variability in sprint performance at higher SE levels, as hypothesized. The CV for 60T was smaller at higher SE levels, with statistically significant differences observed for all comparisons except 60% vs. 80% and 90% vs. 100%. The CV for SP was also smaller at higher SE levels, with significant differences when comparing SP at 60% SE with that at 90% and 100%. These results suggest that there is more intra-individual variation when SE is below 80%. The question of whether the reliability of perceived exertion varies with exercise intensity is critical for the practical use of this measurement. However, there are limited reports on the relationship between exercise intensity and variability in perceived exertion.
Although we observed lower variability in performance at higher SE levels, the variability was consistently small across all SE levels. Intra-individual variability in SP ranged from 2.06% to 3.04%. Coffey et al. examined changes in various indicators before and after a repeated sprint running protocol and found that the CV for visual analog scale scores for muscle soreness was 49.2%, while the CV for subjective well-being measures was 5.9% (
23). Mann et al. studied inter-individual variability in RPE during running at 70% VO2max and reported that the CV for RPE in trained participants was 12% (
24). Scott et al. assessed the test-retest reliability of the CR10 and CR100 sRPE scales in an intermittent running test (
20) and found that the CVs for both methods were over 30%. Therefore, the inter- and intra-individual variability in SE levels during sprint running recorded in this study is comparatively small.
5.2. Relationship Between Subjective Effort and Sprint Performance
In this study, we found several common associations between sprinters' SE and actual performance. First, in submaximal sprinting, the ratio of actual running speed to maximal sprinting was higher than the prescribed SE: On average, participants' speed was 89.72% for 60% SE, 95.50% for 80% SE, and 98.11% for 90% SE. In other words, a 10% difference in SE results in only a (2 - 3) % difference in actual running speed.
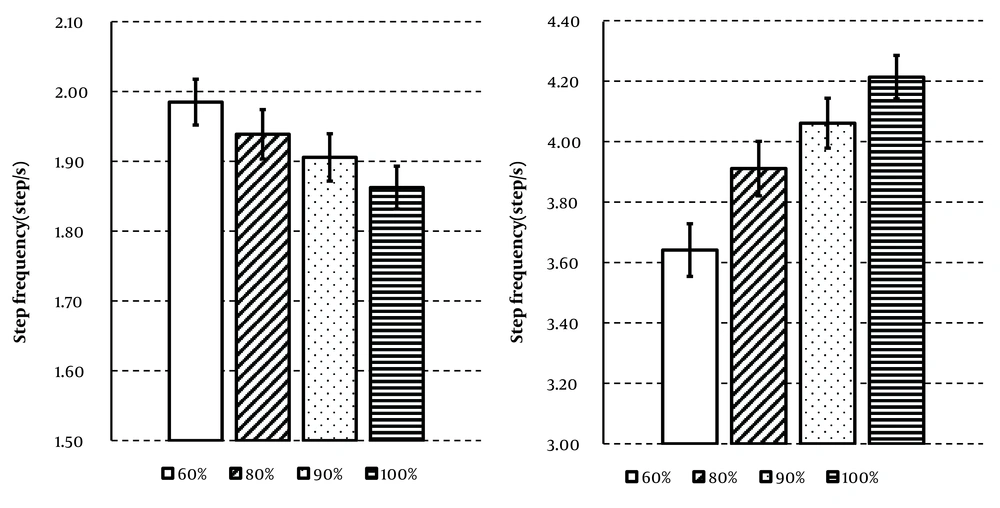
Second, our results suggest that biomechanical variables change as SE increases. At higher SE levels, sprinters increase their running speed by shortening their stride length and increasing their step frequency. Although this seems counterintuitive when considering the basic principle that speed equals stride length multiplied by step frequency, similar findings have been reported in previous studies (
12,
22,
25). Hasebe et al. investigated performance and kinematic differences between overground and treadmill running using SE (30%, 50%, and 70%) (
12) and found that subjects adjusted their speed by step frequency rather than stride length during overground running. Hunter et al. explored the negative interaction between step length and step frequency (
25). They found that vertical takeoff velocity was the main source of this negative interaction. As running speed decreases, ground contact time increases, leading to increased vertical velocity and longer flight time, which results in longer stride length and reduced step frequency.
Several limitations of this study should be noted. First, all participants belonged to the same university Track & Field club. Participants specializing in the same event may have similar relationships between SE and actual performance because they train together regularly. However, our data showed no significant differences in the relationships between SE and CV for short-distance and long-distance sprinters. While event specialization may affect inter-individual variability, it is unlikely to impact intra-individual variability, so this limitation probably did not affect our main findings.
Second, we used the CV of sprint performance over 5 days as a measure of variability, but a longer study period would increase the robustness of our results. Nevertheless, the relationship between SE and CV in this study was statistically significant, indicating that our procedures appropriately assessed the reliability of individual performance. Third, we were unable to account for environmental factors (e.g., wind and temperature) during the experiments. However, since running at all SE levels was measured on the same day in random order, this limitation likely had minimal impact on SE comparisons.
Fourth, we did not analyze the effect of trial order or individual differences. Further research is needed to determine whether individual characteristics influence SE variability. However, in this study, performance level was not associated with variability in SE. Finally, since the participants were Track & Field sprinters, these findings may not be generalizable to athletes from other sports. Future research is needed to examine SE-related variations in sprint performance across athletes from different sports.
Despite these methodological limitations, we have provided valuable insights into the feasibility of using SE during sprint running. The results of this study suggest that athletes and coaches may be able to utilize SE to prevent injuries during sprint running. Athletes can monitor their training load and avoid excessive strain by recording their SE and running distance during daily sprint training.
Although SE during sprint running is a useful indicator of exercise intensity, further research is needed to establish its effectiveness in preventing injuries and improving performance across various sports. Sports such as swimming, cycling, and skating, which are similar to track and field as record-setting sports, may also benefit from the use of subjective effort as a training tool. It is essential to clarify the relationship between training load measured via SE and its impact on performance and injury risk. Additionally, it is necessary to investigate whether measuring running intensity using SE is equally reliable for different subjects (e.g., women, athletes from team sports) and under various conditions (e.g., different distances, ground surfaces).
5.3. Conclusions
Track & Field coaches sometimes attempt to control training loads appropriately by referring to athletes' SE. The findings of this study suggest that this coaching method is reliable: The CV of sprint performance at all SE levels above 60% was below 5%, and running speed at 90% SE was as stable as at maximal sprint effort.
While SE is useful for sprinters, the results of this study highlight several considerations for athletes and coaches when adjusting running exercise intensity based on SE. First, performance tends to become slightly unstable as SE decreases, indicating that SE is more effective at higher running intensities. Second, changes in SE also result in changes in running behavior: Sprinters tend to emphasize higher step frequency at high SE levels and longer stride lengths at low SE levels. Since high running speed is achieved through both high step frequency and long stride length, performance may be enhanced by appropriately adjusting SE to maintain longer stride lengths at higher SE levels.